The July 2015 Burlington investor presentation serves as a roadmap for the company's operational refinement within the off-price retail sector. By focusing on 'better buying' and 'better selling' through technology, Burlington demonstrated a clear path to margin expansion and sales growth. The deck emphasizes a shift from a coat-centric legacy to a diversified apparel and home goods destination, supported by a 7% CAGR in net sales and a 10% CAGR in EBITDA from 2010 to 2014. While the deck lacks a specific 'ask' typical of startup pitches, it functions as a comprehensive update for public mark…
Key takeaways
- Net sales grew from $3,670 million in 2010 to $4,815 million in 2014, representing a ~7% CAGR (Slide 10).
- EBITDA increased at a ~10% CAGR over the same period, reaching $448 million in 2014 (Slide 10).
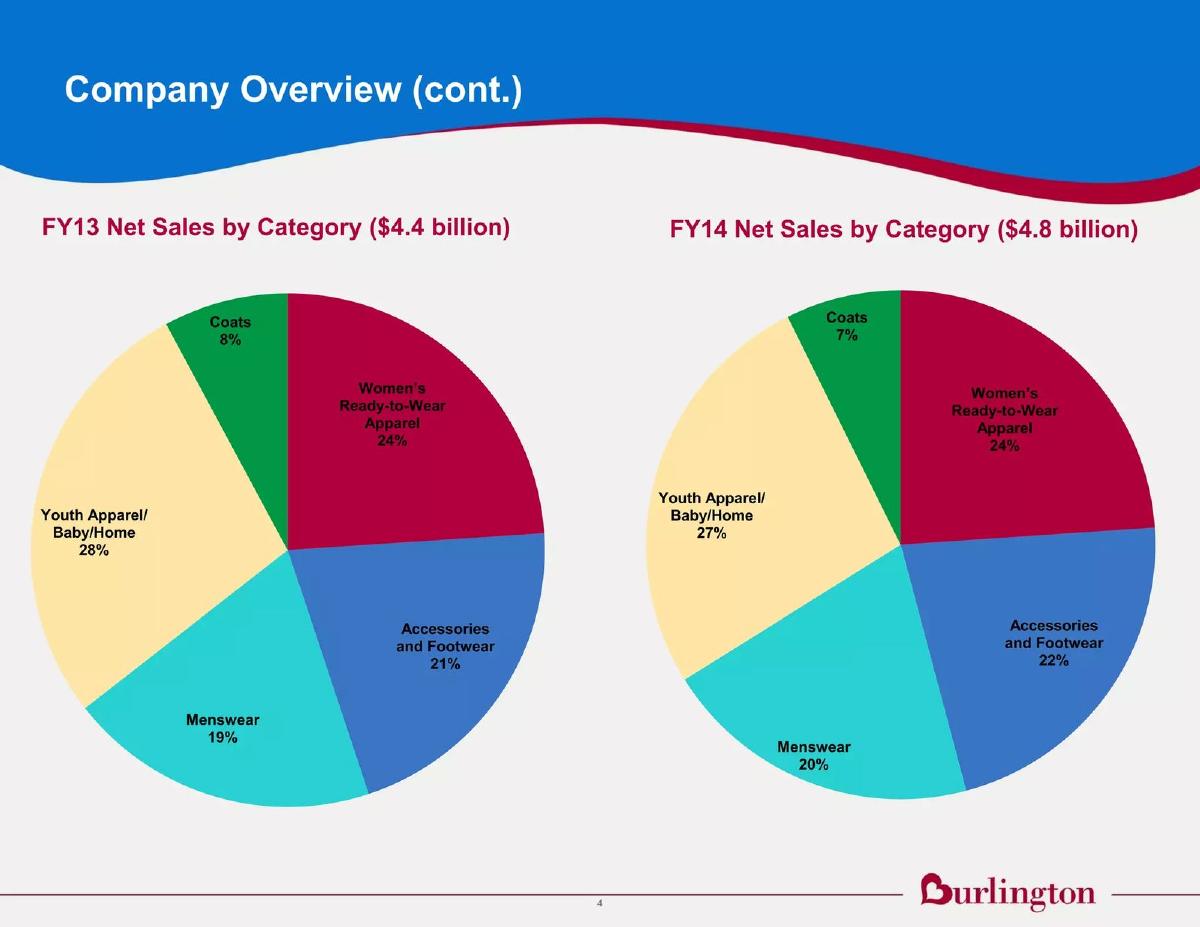
- The company shifted its category mix, with Youth Apparel/Baby/Home growing from 28% to 27% of sales while maintaining Women's Ready-to-Wear at 24% (Slide 4).
- Operational focus is centered on the 'FQBP' model: Fashion, Quality, Brand, and Price (Slide 6).
- Inventory strategy emphasizes 'staying liquid' through minimal pre-season purchasing and in-season closeouts (Slide 6).
- Technology investments are targeted at markdown optimization and business intelligence to ensure the 'right price' and 'right product' (Slide 8).
- Comparable store sales growth accelerated significantly, moving from -0.2% in 2010 to 4.9% in 2014 (Slide 10).
- Fiscal Year 2015 guidance projected an Adjusted EPS increase of ~20% compared to the prior year (Slide 14).
Executive Summary and Brand Positioning
Slide 1: Title Slide
The presentation opens with the classic Burlington logo, emphasizing its core categories: Ladies, Mens, Kids, Home, and Coats. The imagery features a diverse range of models representing these categories, signaling a broad market appeal. The slide is dated July 2015, placing this in the context of Burlington's post-IPO growth phase.
Slide 2: Investment Highlights
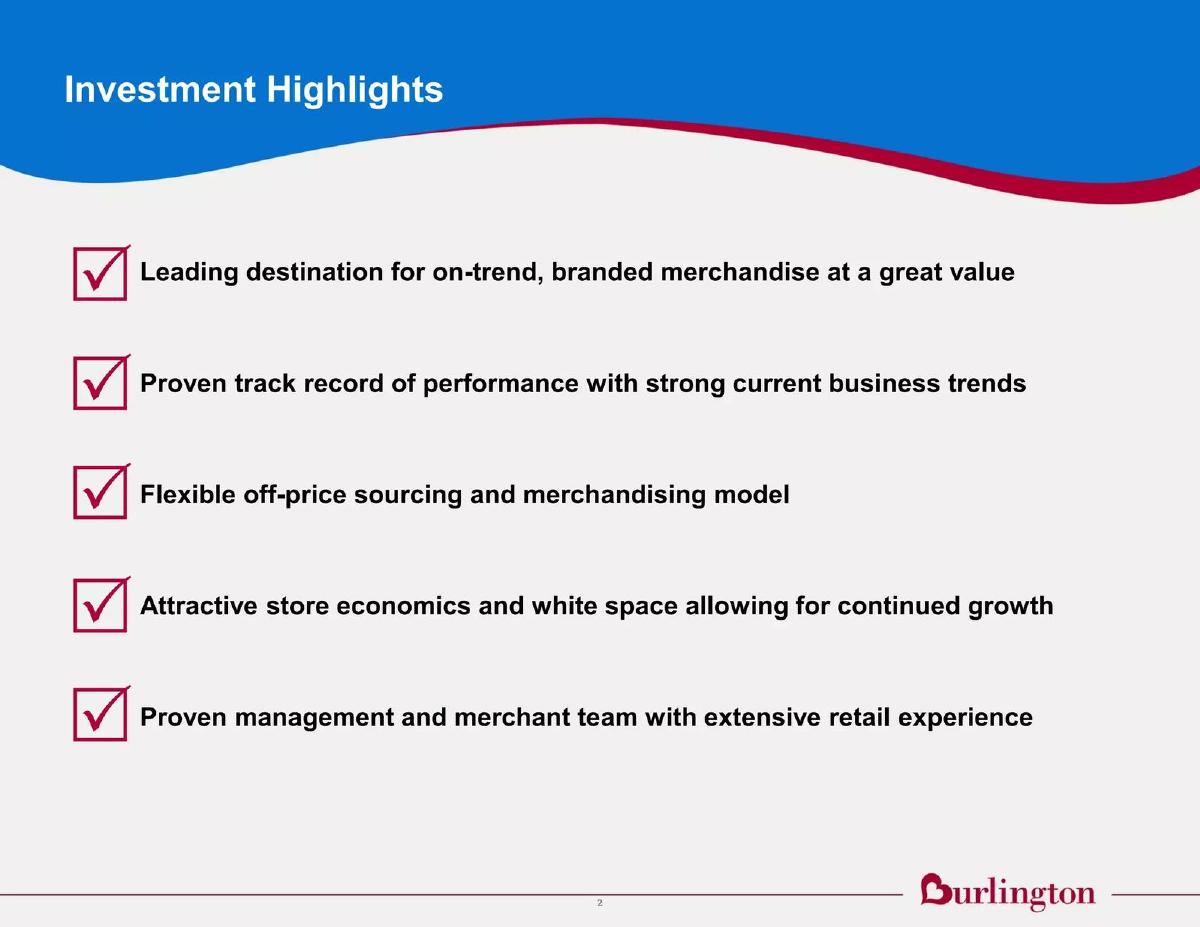
This slide serves as the executive summary, listing five key pillars for the investment case. It highlights Burlington as a destination for branded merchandise at a "great value" and points to a "proven track record" of performance. Crucially, it mentions a "flexible off-price sourcing and merchandising model" and "attractive store economics," suggesting that the business is both scalable and efficient. The mention of "white space" indicates that the company believes there is significant room for new store openings.
Business Overview and Category Mix
Slide 4: Company Overview (cont.)
This slide provides a breakdown of Net Sales by Category for Fiscal Year 2013 ($4.4 billion) and Fiscal Year 2014 ($4.8 billion). The data shows a stable and diversified revenue stream. Women's Ready-to-Wear Apparel remained constant at 24% of sales. The largest segment, Youth Apparel/Baby/Home, saw a slight decrease from 28% to 27%, while Menswear grew from 19% to 20%. Accessories and Footwear also saw a slight uptick from 21% to 22%. Notably, the "Coats" category—Burlington's historical namesake—only accounted for 7-8% of sales, demonstrating the company's successful transition into a full-line off-price retailer.
Operational Strategy: Buying and Selling
Slide 6: Refined Off-Price Model Through Improved Buying and Inventory Management
This slide details the "better buying" component of Burlington's strategy. It introduces the acronym FQBP: Fashion, Quality, Brand, and Price. The operational flow is described through four blocks: staying liquid with minimal pre-season purchasing, maintaining shallow but broad assortments for more selection, utilizing a "pack and hold" program for seasonal deals, and maintaining flexible floor sets. This strategy is designed to drive comparable store sales by ensuring the inventory is always fresh and aligned with current consumer demand.
Slide 8: Invested in Technology and Systems to Drive Growth and Improve Efficiency
Complementing the buying strategy is the "better selling" strategy powered by technology. This slide outlines how Burlington uses systems for planning, forecasting, and allocation. The goal is to get the "right product to the right stores at the right time at the right price." Key technological levers mentioned include markdown optimization and business intelligence/product attribution. This indicates a move away from manual retail management toward a data-driven approach to maximize sell-through and minimize unnecessary discounts.
Financial Performance and Momentum
Slide 10: Proven Track Record With Accelerating Momentum
This is the core data slide of the deck, showing three key metrics from 2010 to 2014. Net Sales grew from $3,670 million to $4,815 million (7% CAGR). Comp Store Sales showed a dramatic recovery, moving from -0.2% in 2010 to 4.9% in 2014. EBITDA grew from $308 million to $448 million (10% CAGR). The fact that EBITDA growth (10%) is higher than sales growth (7%) demonstrates operating leverage and improving margins over the four-year period.
Future Outlook and Appendix
Slide 12: Appendix Divider
A simple transition slide marking the beginning of the supplemental financial data and detailed reconciliations.
Slide 14: Fiscal Year 2015 Outlook
Burlington provides specific guidance for Q2 2015 and the full Fiscal Year 2015. For the full year, they projected Net Sales growth of +6-7% and Comp Store Sales growth of +2-3%. The most significant figure is the expected increase in Adjusted EPS of ~20% compared to the prior year, with a target range of $2.15 to $2.25. This slide is intended to build investor confidence in the continued execution of the strategies outlined earlier in the deck.
Slide 16: Adjusted Net Income and Adjusted EBITDA Reconciliation
This technical slide provides a bridge between GAAP Net Income and the "Adjusted" figures used throughout the presentation. It lists various costs such as debt amendments, loss on extinguishment of debt, impairment charges, and stock option modifications. For FY 14, the reconciliation shows how a GAAP Net Income of $66.0 million was adjusted to an Adjusted Net Income of $138.6 million and an Adjusted EBITDA of $448.1 million. This level of transparency is standard for public company investor relations but provides deep insight into the company's capital structure and non-recurring expenses.
What Works and What is Missing
What Works: The deck is exceptionally clear about its operational levers. The distinction between "better buying" (Slide 6) and "better selling" (Slide 8) provides a logical framework for how the company generates value. The financial data on Slide 10 is presented cleanly, showing clear upward trends in both top-line and bottom-line metrics. The category mix slide (Slide 4) effectively counters any lingering perception that Burlington is just a coat retailer.
What is Missing: As an investor presentation for a public company, this deck lacks the "Problem" and "Solution" slides typical of a startup pitch. It assumes the audience understands the off-price retail market. There is no mention of the competitive landscape (e.g., TJX or Ross Stores), which is a common omission in internal investor decks but a gap for an outside analyst. Additionally, while "white space" for new stores is mentioned on Slide 2, there is no specific map or target number for store count expansion in the provided slides.
Founder Takeaways
Focus on Operating Leverage: Burlington highlights that their EBITDA is growing faster than their revenue. For founders, demonstrating that your business becomes more efficient as it scales is a powerful way to attract late-stage or public market investors. Define Your Operational Moat: Burlington doesn't just say they are good at retail; they explain the specific mechanics (staying liquid, pack and hold, markdown optimization) that make them successful. Founders should be equally specific about their "secret sauce." Transparency in Metrics: The detailed reconciliation on Slide 16 shows a commitment to financial transparency. While startups may not have such complex debt structures, providing clear bridges between raw data and "adjusted" metrics builds significant trust with sophisticated investors.
Frequently asked questions
- What is the core value proposition Burlington presents to investors?
- Burlington positions itself as a leading destination for branded merchandise at a great value, underpinned by a flexible off-price sourcing model. The deck emphasizes that their 'better buying' and 'better selling' strategies allow them to offer high-quality national brands at significant discounts while maintaining attractive store economics and room for physical expansion.
- How does Burlington manage its inventory differently than traditional retailers?
- According to Slide 6, Burlington utilizes a 'liquid' buying strategy. This involves minimal pre-season purchasing and a heavy reliance on in-season closeouts. They also use a 'pack and hold' program for seasonal deals from national brands, allowing them to allocate floor space flexibly to the strongest performing categories rather than being locked into rigid seasonal sets.
- What role does technology play in their growth strategy?
- Technology is framed as a driver of efficiency and growth on Slide 8. The company invests in planning, forecasting, and allocation systems to ensure the right products reach the right stores at the right time. Specifically, they highlight markdown optimization and business intelligence as key tools for maintaining margins and improving product attribution.
- What were the financial growth trends leading up to this presentation?
- The company showed consistent upward momentum between 2010 and 2014. Net sales grew steadily each year, and EBITDA growth outpaced sales growth (10% CAGR vs 7% CAGR). Most notably, comparable store sales moved from negative territory in 2010 to nearly 5% growth by 2014, indicating improved store-level productivity.
- What was the projected outlook for the 2015 fiscal year?
- For the full year 2015, Burlington provided guidance of 6-7% net sales growth and 2-3% comparable store sales growth. The most aggressive target was a ~20% increase in Adjusted EPS, supported by a projected 10-20 basis point improvement in Adjusted EBITDA margin.