BUILK’s pitch deck centers on a 'free-to-fee' data play within the fragmented construction industry. By providing free project management and procurement tools to construction SMBs, the company captures granular spending data that is otherwise inaccessible. The deck highlights a significant milestone of $200 million in construction spending data captured from 3,000 companies, alongside a modest $200,000 in revenue for 2013. While the deck effectively demonstrates traction and a clear value proposition for data-hungry suppliers, it lacks traditional venture components such as a detailed team s…
Key takeaways
- The company positions itself as a data crowdsourcing platform rather than just a software provider (Slide 1).
- BUILK reported $200,000 in revenue for the year 2013 (Slide 2).
- The platform has successfully onboarded 3,000 construction companies to its ecosystem (Slide 2).
- Captured construction spending data reached $200 million by the time of the deck's creation (Slide 2).
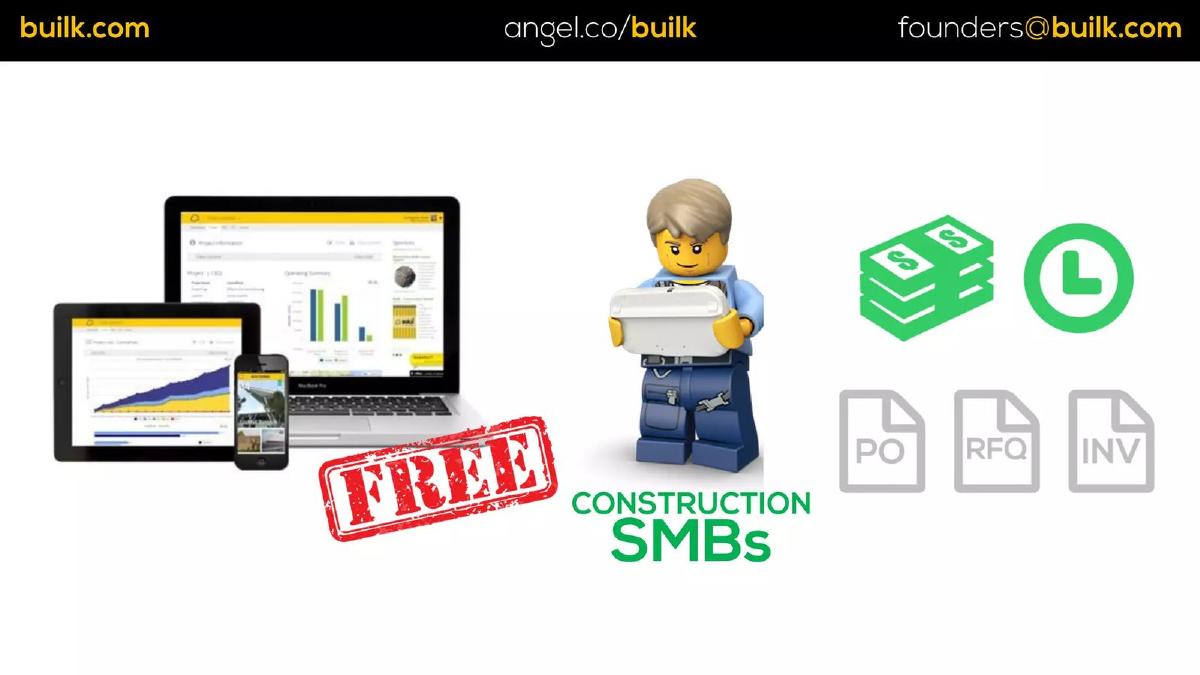
- The business model relies on offering free software to SMBs to digitize POs, RFQs, and invoices (Slide 3).
- Spending data growth is aggressive, cited at 40% quarterly from Q1 2011 through Q1 2014 (Slide 4).
- BUILK targets a massive $8 trillion global construction market, with a specific focus on the 40% located in Asia (Slide 5).
- The deck lists major regional partners including Tata Steel (Thailand), SCG, and KBank (Slide 4).
Executive Summary: The Data Play in Construction
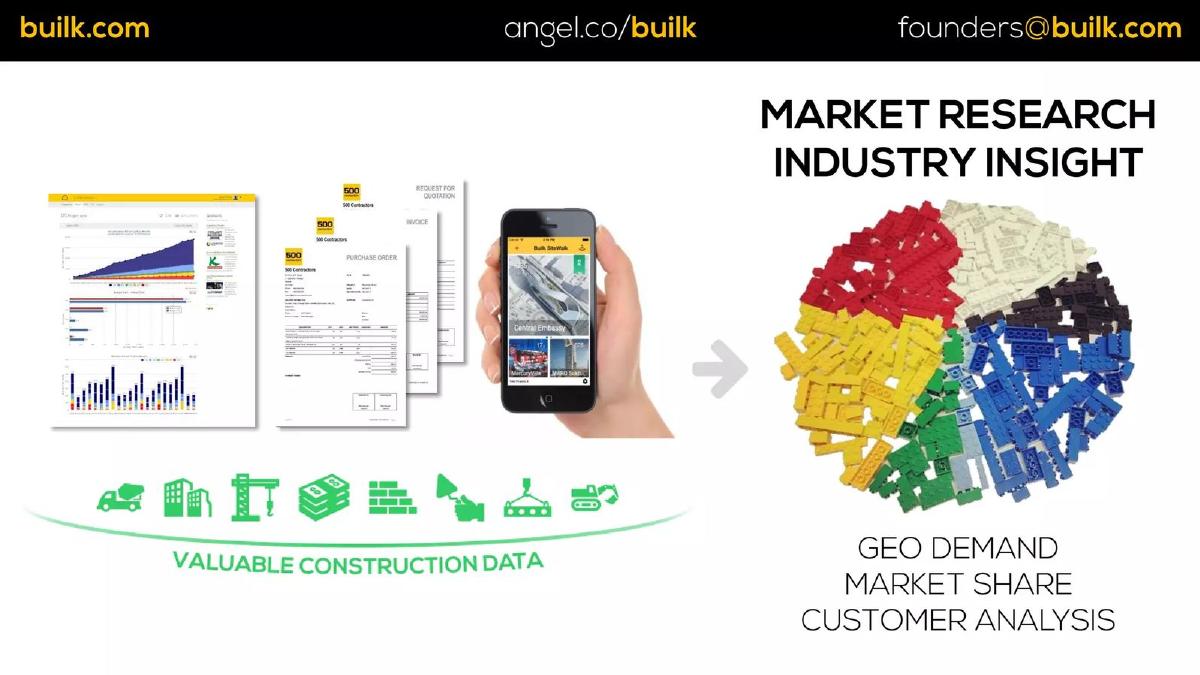
BUILK’s pitch deck is a concise, 11-slide presentation (of which 6 are analyzed here) that focuses heavily on the 'Big Data' potential of the construction industry. Rather than selling software, BUILK positions itself as a crowdsourcing engine. The core thesis is simple: give SMB contractors free tools to manage their business, and in exchange, aggregate the massive spending data that flows through those tools. This teardown examines a deck that is light on text but heavy on high-level metrics and market scale.
Slide 1: Title and Value Proposition
The cover slide establishes the brand identity immediately. The logo features a yellow construction helmet and the tagline 'construction united.' Below the logo, the company states its primary function: 'WE CROWDSOURCE CONSTRUCTION DATA.' This is a critical positioning choice. By leading with data rather than 'software' or 'SaaS,' BUILK signals to investors that their value lies in the insights and marketplace potential of the information they collect, rather than just the monthly subscription fees of a tool.
Slide 2: Key Performance Indicators (KPIs)
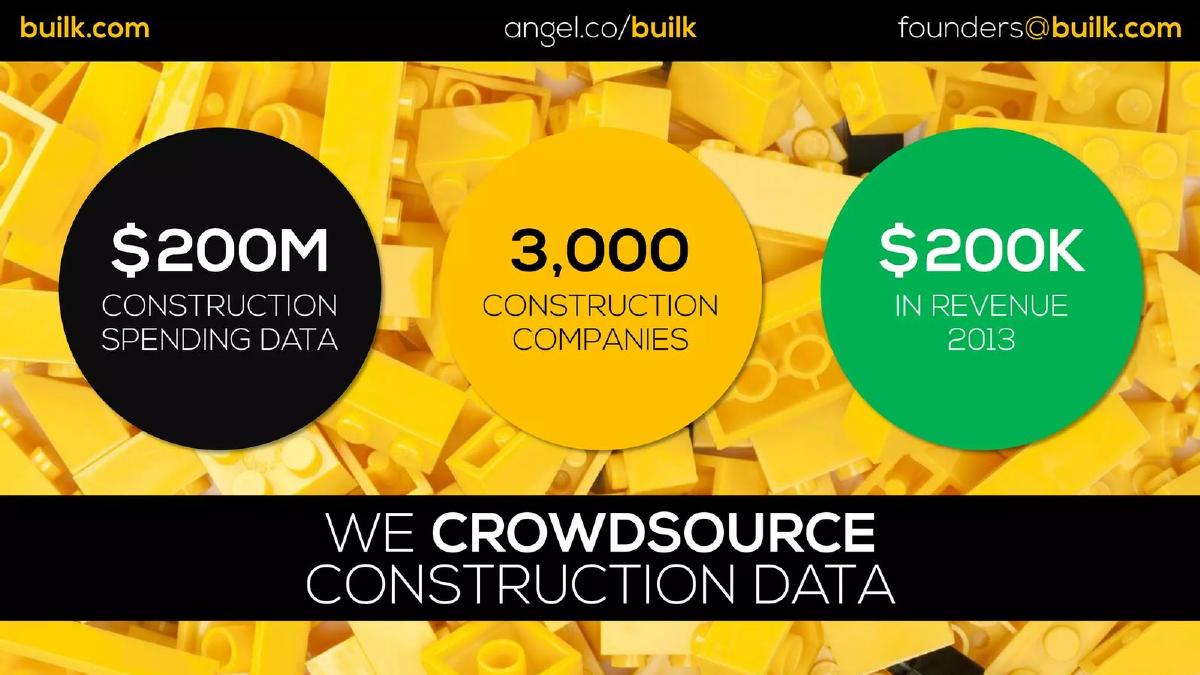
This slide uses a high-contrast 'stoplight' color scheme to present three core metrics. The figures quoted are specific and provide a snapshot of the company's scale at the time of the pitch:
$200M Construction Spending Data: This represents the total volume of transactions processed through the platform. · 3,000 Construction Companies: This defines the user base and the scale of the 'crowd' providing the data. · $200K In Revenue 2013: This provides the financial baseline, showing that the company is post-revenue but still in an early stage relative to the spending data it tracks.
The repetition of the tagline 'WE CROWDSOURCE CONSTRUCTION DATA' at the bottom of the slide reinforces the core mission.
Slide 3: The 'Free' Software Strategy
Slide 3 explains the 'how' behind the data collection. It features a graphic of a LEGO-style construction worker and a 'FREE' stamp over images of a laptop, tablet, and smartphone. The slide lists the specific documents the software digitizes: PO (Purchase Order), RFQ (Request for Quotation), and INV (Invoice).
The target audience is clearly identified as 'Construction SMBs.' By offering these tools for free, BUILK removes the barrier to entry for small contractors who might otherwise rely on paper or Excel. This is the 'hook' that allows the company to capture the data mentioned on the previous slide. The inclusion of a clock icon and dollar signs suggests the value prop for the SMB is time and money saved.
Slide 4: Growth Velocity and Partnerships
This slide serves as a dual-purpose traction and validation slide. On the left, it displays logos of major corporate entities, including Tata Steel (Thailand), BlueScope Steel, SCG (Siam Cement Group), Shera, and KBank. These are likely the 'fee' side of the 'free-to-fee' model—enterprises that pay for access to the data or the marketplace.
On the right, a bar chart (styled with LEGO bricks) shows the growth of spending data from Q1/11 to Q1/14. The chart indicates that the data volume was negligible in 2011 but accelerated sharply through 2013, reaching the $200M mark. A large yellow circle highlights the key metric: '40% Spending Data Growth Quarterly.' This demonstrates consistent, high-speed scaling of the platform's utility.
Slide 5: Market Opportunity
BUILK moves from its internal metrics to the global opportunity. Using a LEGO globe as a visual, the slide quotes a '$8 Trillion Construction Spending' figure for the total addressable market (TAM). It then narrows the focus to the company's home region, noting that '40% in ASIA' of that spending occurs there. The word 'SMBs' is highlighted in green, reminding the investor that while the market is huge, BUILK’s specific entry point is the underserved small-to-medium business segment that makes up the bulk of the industry's fragmented tail.
Slide 6: Contact and Founder Info
The final slide in this set returns to the yellow textured background. It identifies the founder as Patai Padungtin and provides a contact email. The slide maintains the 'construction united' branding, ensuring the deck ends on a consistent visual note.
What Works in This Deck
Clarity of Mission: The deck does not hide behind jargon. It tells the investor exactly what it does (crowdsources data) and how it does it (free software for SMBs) within the first three slides.
Metric-Driven Traction: Citing $200M in spending data alongside a 40% quarterly growth rate is a powerful way to show product-market fit. It proves that contractors are actually using the tool for their core business operations.
Visual Consistency: The use of LEGO-style imagery is a clever thematic choice for a construction company. It makes a 'boring' industry look modern and modular, which aligns with the 'Construction United' branding.
What Is Missing
The Team: There is no slide detailing the experience of Patai Padungtin or the broader leadership team. In early-stage fundraising, the 'who' is often as important as the 'what.'
The Ask: The deck never specifies how much money is being raised, what the valuation expectations are, or how the funds will be allocated (e.g., hiring, geographic expansion, R&D).
Business Model Depth: While we see $200k in revenue, the deck doesn't explain the unit economics. How much does it cost to acquire one of those 3,000 SMBs? What is the lifetime value of the data they provide? Without these details, it is hard to judge the sustainability of the 'free' model.
Competition: The deck operates in a vacuum. It does not acknowledge other construction tech players or traditional ERP incumbents, leaving the investor to wonder about BUILK's defensive moat.
Founder's Playbook: What to Copy
The 'One Big Number' Approach: BUILK focuses on 'Spending Data' as their North Star metric. Founders should identify the one metric that best represents the value of their ecosystem and highlight its growth aggressively.
Strategic Logo Placement: By placing KBank and Tata Steel next to their growth chart, BUILK implies enterprise validation without needing pages of testimonials. If you have big-name partners, let their logos do the heavy lifting.
Simplified Workflow Explanation: Slide 3 is a masterclass in explaining a product without showing a single screenshot of the UI. By listing 'PO, RFQ, INV,' they tell the investor exactly which business processes they own.
Frequently asked questions
- What is BUILK's primary revenue model?
- While the software is 'FREE' for construction SMBs (Slide 3), the deck implies a data-driven or marketplace model. By capturing $200M in spending data, BUILK creates value for the large corporate partners listed on Slide 4, such as Tata Steel and SCG. The $200,000 in 2013 revenue likely stems from these B2B partnerships or premium services, though the deck does not explicitly detail the fee structure.
- How does BUILK acquire data from construction companies?
- BUILK provides free digital tools for essential construction workflows. According to Slide 3, these include Purchase Orders (PO), Requests for Quotation (RFQ), and Invoices (INV). By moving these paper-based processes onto their cloud platform, BUILK automatically aggregates the underlying spending data, which reached $200M across 3,000 companies (Slide 2).
- What is the scale of the market BUILK is addressing?
- Slide 5 identifies a global construction spending market of $8 trillion. The company specifically highlights that 40% of this spending occurs in Asia. Their strategy focuses on the 'SMBs' (Small and Medium Businesses) segment within this Asian market, which is traditionally underserved by expensive, enterprise-grade ERP software.
- What evidence of traction does the deck provide?
- Traction is demonstrated through three primary metrics: user growth (3,000 companies), data volume ($200M in spending), and growth velocity. Slide 4 shows a consistent upward trajectory in spending data from 2011 to 2014, maintaining a 40% quarterly growth rate. The presence of logos like KBank and BlueScope Steel also suggests enterprise-level validation.
- What critical information is missing from this pitch deck?
- The deck is missing several standard slides: there is no dedicated team slide showing founder backgrounds, no slide detailing the specific investment 'Ask' (amount or terms), and no competitive landscape analysis. Additionally, the unit economics (CAC/LTV) and a clear roadmap for how the $200k revenue scales into the $8T market are absent.