Broadwind Energy presented this deck at the B. Riley Investor Conference in May 2015, positioning itself as a leading wind tower manufacturer with a diversifying industrial base. The presentation is notable for its raw financial honesty, showing both the successes of a 10% Sales CAGR from 2010-2014 and the struggles of its Services division, which saw operating losses widen in Q1 2015. The company emphasizes its 'asset rich' status, citing a tangible asset value of $5.70 per share and a massive $165M tax loss carry-forward. While the core tower business remains the primary revenue driver at 7…
Key takeaways
- The company achieved a 10% Sales CAGR between 2010 and 2014, growing from approximately $140M to over $200M in annual revenue (Slide 7).
- Broadwind successfully reduced SG&A as a percentage of revenue by more than 10 percentage points between 2010 and 2014 (Slide 7).
- The balance sheet was significantly deleveraged, with debt and capital leases falling from over $40M in 2009 to less than $5M by Q1 2015 (Slide 9).
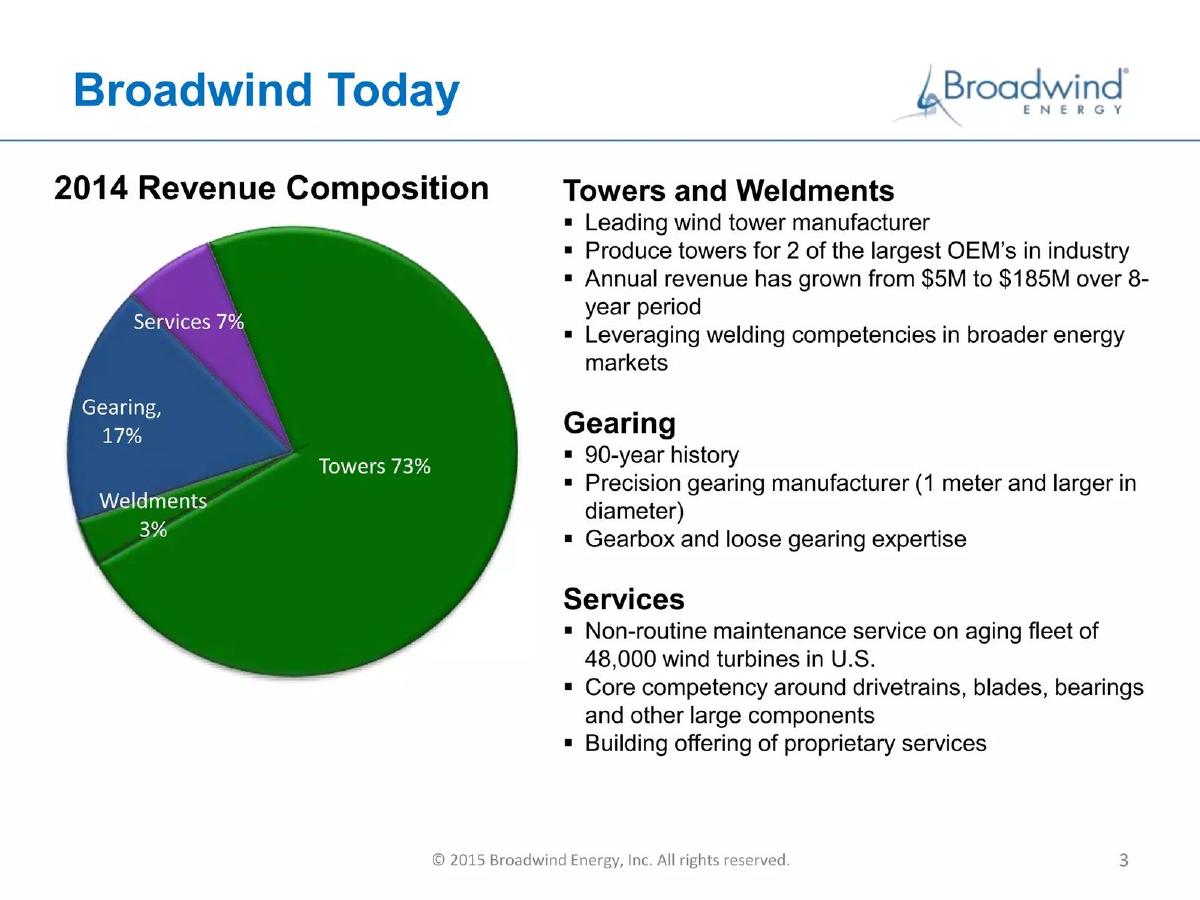
- Towers and Weldments represent the core business, accounting for 73% of 2014 revenue composition (Slide 3).
- The company holds a significant $165M tax loss carry-forward, which acts as a major future financial asset (Slide 11).
- The Services division struggled in early 2015, reporting an operating loss of $2.6M in Q1 2015 compared to a $1.3M loss in Q1 2014 (Slide 15).
- Broadwind claims a tangible asset value of $5.70 per share, framing the company as 'asset rich' despite market volatility (Slide 11).
- The deck identifies a 'net debt negative' position as of May 2015, indicating cash exceeds total debt (Slide 9).
Executive Summary: The Industrial Turnaround Narrative
The Broadwind Energy deck for the May 2015 B. Riley Investor Conference is a study in corporate transparency and restructuring. Unlike early-stage startup decks that sell a dream, this is a 'show your work' presentation for a public entity. It balances the impressive growth of its core tower manufacturing business against the operational friction of its services and gearing segments. The overarching narrative is one of stabilization: reducing debt, cutting overhead, and preparing for a more diversified industrial future.
Slide 1: Title and Context
The cover slide establishes the setting: the B. Riley Investor Conference on May 14, 2015. The imagery—gears, oil rigs, mining trucks, and wind turbines—immediately communicates that while 'Energy' is in the name, the company operates across the heavy industrial spectrum. This visual cues the diversification strategy mentioned later in the deck.
Slide 3: Broadwind Today - Revenue Composition
This slide provides a clear breakdown of the business units. Towers dominate the revenue at 73%, followed by Gearing at 17%, Services at 7%, and Weldments at 3%. The bullet points emphasize the scale of the tower business, noting growth from $5M to $185M in annual revenue over eight years. It also highlights a 90-year history in precision gearing, providing a sense of legacy and technical expertise that offsets the relatively young wind tower business.
Slide 5: Wind Power Drivers
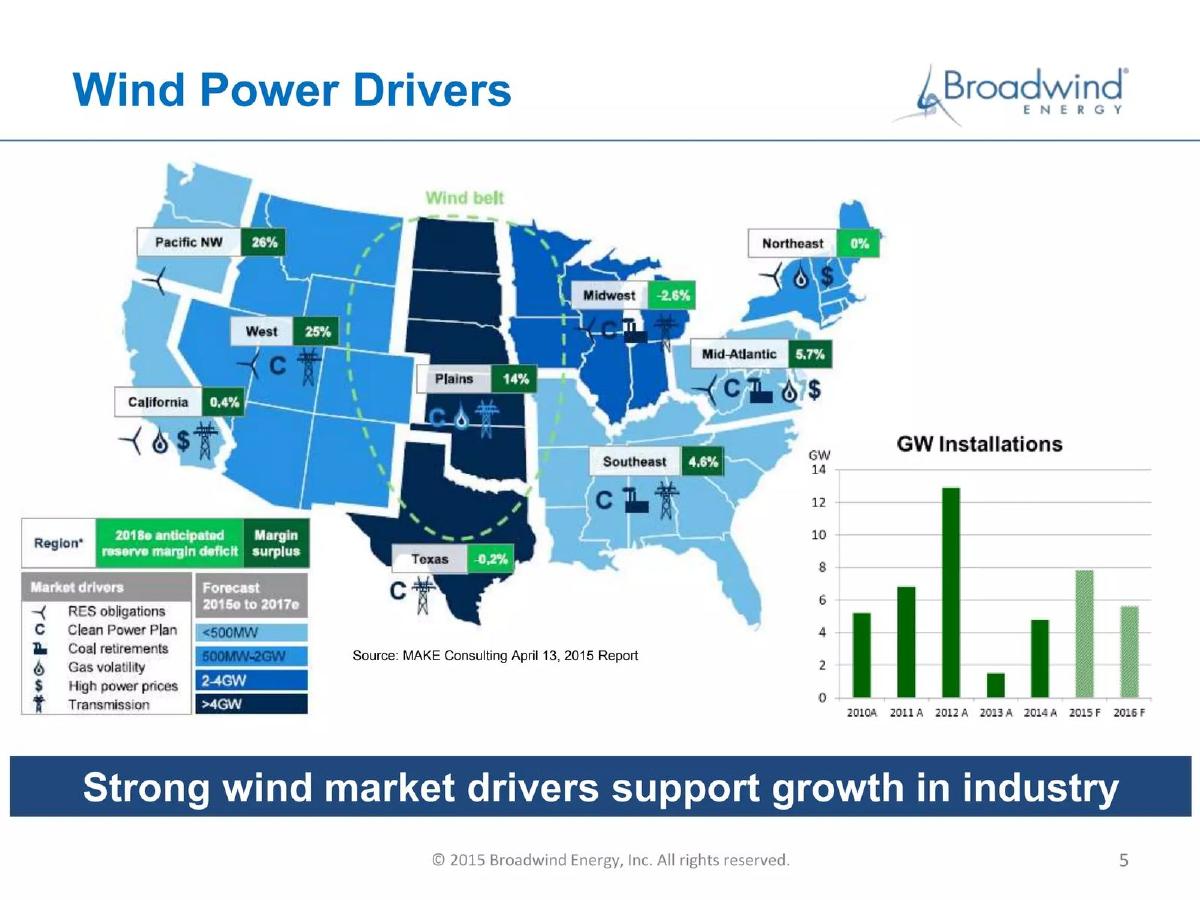
Broadwind uses this slide to validate its primary market. By including a map of the U.S. with regional 'reserve margin' data and a bar chart of GW Installations, the company acknowledges the cyclical nature of the wind industry. The chart shows a massive spike in 2012 (over 12 GW) followed by a near-total collapse in 2013, with a slow recovery projected for 2015 and 2016. This slide is crucial for setting expectations regarding revenue volatility.
Slide 7: Executing On Our Plan - Financial Metrics
Sales: Shows a 10% CAGR from 2010 to 2014, ending the period above $200M. · Gross Margin: Shows improvement from near 0% in 2010 to approximately 8% in 2014, including restructuring impacts. · SG&A as % of Revenue: A downward trend showing an improvement of over 10 percentage points since 2010. · Adj. EBITDA: A swing from a $10M loss in 2010 to nearly $10M in profit in 2014.
These metrics tell a story of a company that has successfully optimized its internal operations even as market conditions fluctuated.
Slide 9: Strengthening Our Balance Sheet
Slide 9 focuses on deleveraging. The 'Debt and Capital Leases' chart is the standout, showing a reduction from ~$42M in 2009 to under $5M in Q1 2015. The company explicitly states it is 'net debt negative.' However, the 'Operating Working Capital' chart shows a spike in Q1 2015 to nearly 15% of sales, which the company attributes to a $10M investment in inventory due to 'port issues.' This is a rare example of a company explaining a negative balance sheet trend proactively.
Slide 11: Investment Thesis
This slide summarizes the 'Why Now?' for investors. It lists seven key points, most notably the $165M tax loss carry-forward and a tangible asset value of $5.70/share . By highlighting these, Broadwind is appealing to value investors who look for downside protection in the form of hard assets and tax advantages. It also mentions the resolution of 'Abilene production issues,' signaling that past operational hurdles are cleared.
Slide 13: Towers and Weldments Segment Detail
This slide dives deep into the core business. While the 2014 FY revenue was $184.9M, the Q1 2015 revenue of $41.0M was down from Q1 2014's $48.3M. The company is honest about the decline, citing a 'lower margin mix of towers' and 'excess costs associated with Abilene production ramp-up.' The inclusion of a 'Forecast' for Q2 and Q3 in the bar chart suggests a back-heavy year, which is a common tactic to keep investors optimistic after a soft first quarter.
Slide 15: Services Segment Detail
The final slide in this set covers the most troubled part of the business. The Services division saw its operating loss double from $1.3M in Q1 2014 to $2.6M in Q1 2015. The 'Adj. EBITDA' margin was a staggering -111.0% for the quarter. Broadwind doesn't hide this; instead, it outlines a corrective action: 'Closing South Dakota gearbox shop by mid-year.' This shows management is willing to cut underperforming assets to protect the bottom line.
What Broadwind Does Well
Broadwind excels at financial transparency . In an era where many decks use 'vanity metrics,' Broadwind includes exact dollar amounts for operating losses, specific charges for inventory, and clear explanations for margin compression. The use of multi-year bar charts (2010-2014) effectively demonstrates a long-term trend of operational improvement that outweighs a single bad quarter.
The deck also does a great job of contextualizing macro-economic factors . By citing 'port issues' and 'wind market drivers,' they separate management performance from external market forces. This helps build trust with sophisticated investors who understand that industrial companies are often at the mercy of logistics and regulation.
What is Missing from the Deck
The most glaring omission in this 8-slide sample is a Team Slide . While this is a public company where the leadership is likely known to the B. Riley audience, a pitch deck teardown usually looks for the 'who' behind the 'what.' There is no mention of the CEO, COO, or the engineering talent required to maintain '90-year history' precision gearing.
Additionally, there is no Competitor Analysis . Broadwind claims to be a 'leading' manufacturer, but it doesn't define the competitive landscape or explain why an OEM would choose Broadwind over a domestic or international rival. In a commodity-adjacent business like steel towers, understanding the competitive moat is essential.
Founder Takeaways: Copy These Moves
1. The 'Asset Rich' Argument: If your company has significant tangible assets (equipment, real estate, or even tax carry-forwards), highlight them. Slide 11's mention of the $5.70/share asset value provides a 'floor' for the stock price that can comfort nervous investors.
2. Own Your Losses: Slide 15 is a masterclass in handling bad news. By presenting the loss alongside a specific plan to fix it (closing the South Dakota shop), management looks proactive rather than defeated.
3. Use Multi-Year Trends: A single year of growth can be a fluke. Broadwind’s 5-year charts on Slide 7 prove that their cost-cutting and sales growth are part of a sustained strategy, not a temporary bump.
4. Segmented Reporting: Don't just show the whole company. By breaking the business into Towers, Gearing, and Services, Broadwind allows investors to value the 'good' parts of the business separately from the 'turnaround' parts.
Frequently asked questions
- What is Broadwind Energy's primary source of revenue?
- According to slide 3, Towers and Weldments are the primary revenue drivers, accounting for 73% of the company's 2014 revenue composition. The company identifies as a leading wind tower manufacturer, producing towers for two of the largest OEMs in the industry, with tower revenue growing from $5M to $185M over an eight-year period.
- How has the company's debt profile changed over time?
- Broadwind executed a significant deleveraging strategy. Slide 9 shows that total debt and capital leases peaked at over $40M in 2009. By Q1 2015, this figure was reduced to less than $5M. The company describes itself as 'net debt negative' and 'asset rich,' intending to fund future working capital needs through operations rather than new debt.
- What are the major headwinds facing the Services division?
- Slide 15 reveals that the Services division is underperforming, with an operating loss of $2.6M in Q1 2015, which was 135.4% of sales. The deck attributes this to weaker blade revenue and a $700K charge related to gearing inventories. To address this, the company announced the closure of its South Dakota gearbox shop by mid-2015.
- What is the 'Investment Thesis' presented to investors?
- The thesis on slide 11 rests on several pillars: the resolution of Abilene production issues, a transformation toward a balanced industrial/wind revenue mix, a $165M tax loss carry-forward, and a tangible asset value of $5.70 per share. It positions the company as a beneficiary of the resurgence in U.S. manufacturing and wind market grid parity.
- How does the company view the U.S. wind market?
- Slide 5 illustrates 'Wind Power Drivers' across the U.S., citing MAKE Consulting data. It highlights regional reserve margin deficits and surpluses, noting that market drivers like RES obligations and the Clean Power Plan support industry growth. However, the GW Installations chart shows significant volatility, with a major peak in 2012 followed by a sharp drop in 2013.