Pre-Orders, Crowdfunding and Units Sold in a Pitch Deck: 10
How hardware and physical-product startups show demand on a pitch deck: pre-orders, crowdfunding backers, waitlists and units shipped.
Pre-Orders, Crowdfunding and Units Sold in a Pitch Deck: What Each Number Proves
Hardware and physical-product startups often have to show demand before, or just after, they can ship. The usual evidence is a count: pre-orders, crowdfunding backers, waitlist sign-ups, orders from a partner, or units shipped. Each count proves something different, and each is easy to misread. This guide compares ten real slides on what the number measures, whether money changed hands, and whether a reader can tell how much each customer paid.
TL;DR
Say what was counted (waitlist sign-ups, paid pre-orders, crowdfunding backers, units shipped to retailers, or units bought by end customers), whether money was collected, over what period, and the amount. Omate gives both the total pledged and the number of backers, so the average pledge can be worked out (about $236). Clair Health separates a waitlist from pre-orders and dates the chart. Edurino gives customers and revenue for its crowdfunding campaign and for pre-sales afterwards. Ring states units shipped over a named 18 months beside a sales run rate. Prynt's units shipped don't say whether they sold through the retailers pictured. Aeris left a placeholder ("Over X Units Sold") on the slide, and Dame and Piper make claims with no volume.
Pre-order and unit-volume claims on real pitch deck slides
Each example shows the exact stored slide above its analysis and links to the full teardown. Most fully defined first. Figures are quoted as shown; calculations are ours.
Omate traction slide — slide 2
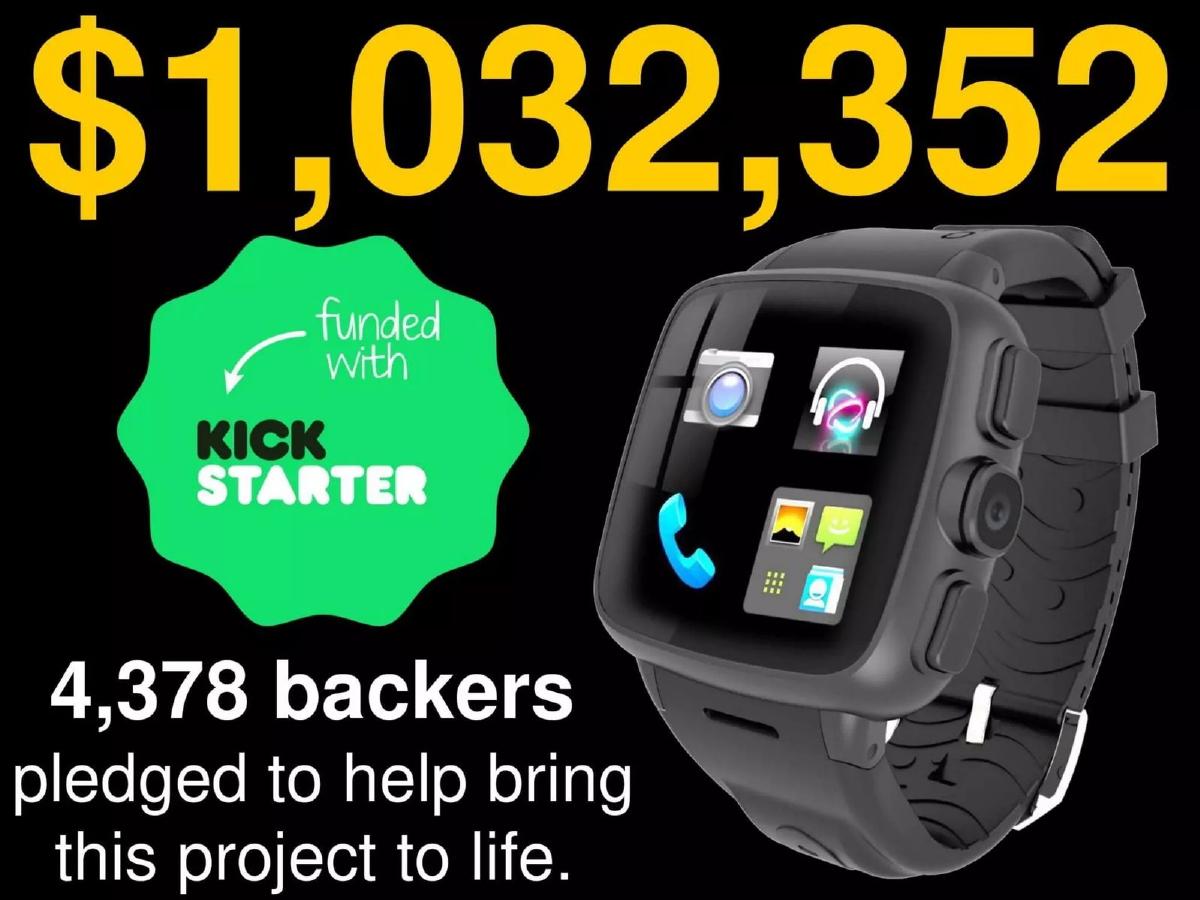
Smartwatch maker. A full-bleed slide showing the watch and a Kickstarter badge.
Omate deck, slide 2. Exact stored slide matched to this analysis.
Our analysis: Money and a count together, so the average commitment can be checked.
Evidence and limitation: $1,032,352 ÷ 4,378 ≈ $236 per backer. That is an average across reward tiers, so it may differ from the watch's list price. The slide doesn't give the campaign's dates or its funding goal, so a reader can't see how quickly it funded or by how much it beat the goal.
What a founder can adapt: Add the goal and the period: "$1.03M from 4,378 backers in [n] days, [x]× our $[goal] goal."
Supporting analysis
What the deck claims: "$1,032,352" in large type. "Funded with Kickstarter." "4,378 backers pledged to help bring this project to life."
Presentation choice: Two numbers from a public platform are hard to inflate and let a reader judge price and reach at once.
When it does not fit: Don't show the total without the backer count; a reader can't tell a few large pledges from many small ones.
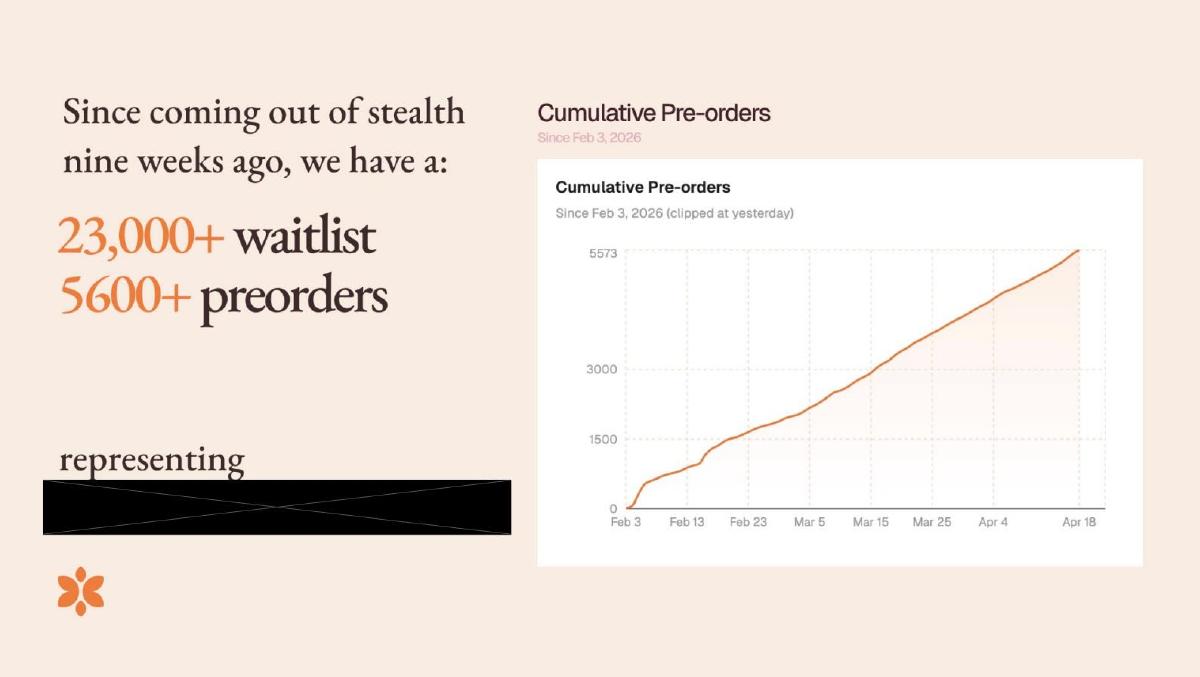
Consumer health product. Text on the left, a line chart titled "Cumulative Pre-orders" on the right. One figure on the slide is blacked out.
Clair Health deck, slide 3. Exact stored slide matched to this analysis.
Our analysis: Waitlist and pre-orders kept apart, with a start date and a cumulative chart.
Evidence and limitation: 5,600 ÷ 23,000 ≈ 24% of the waitlist number, though the slide doesn't say pre-orders came from the waitlist. The chart's top value (5,573) is consistent with "5600+" rounded. The redacted line probably held the money value of the pre-orders, which a reader would need to see the price paid; we can't check it. The slide doesn't say whether pre-orders are paid in full or refundable deposits.
What a founder can adapt: "5,600 pre-orders ($[value], [full / deposit, refundable?]) since 3 Feb 2026; 23,000 on the waitlist."
Supporting analysis
What the deck claims: "Since coming out of stealth nine weeks ago, we have a: 23,000+ waitlist, 5600+ preorders, representing [redacted]." Chart: "Cumulative Pre-orders. Since Feb 3, 2026 (clipped at yesterday)." The top of the y-axis reads 5573.
Presentation choice: Separating free sign-ups from pre-orders shows how many people moved to the stronger commitment.
When it does not fit: Don't add waitlist and pre-orders into one "demand" figure.
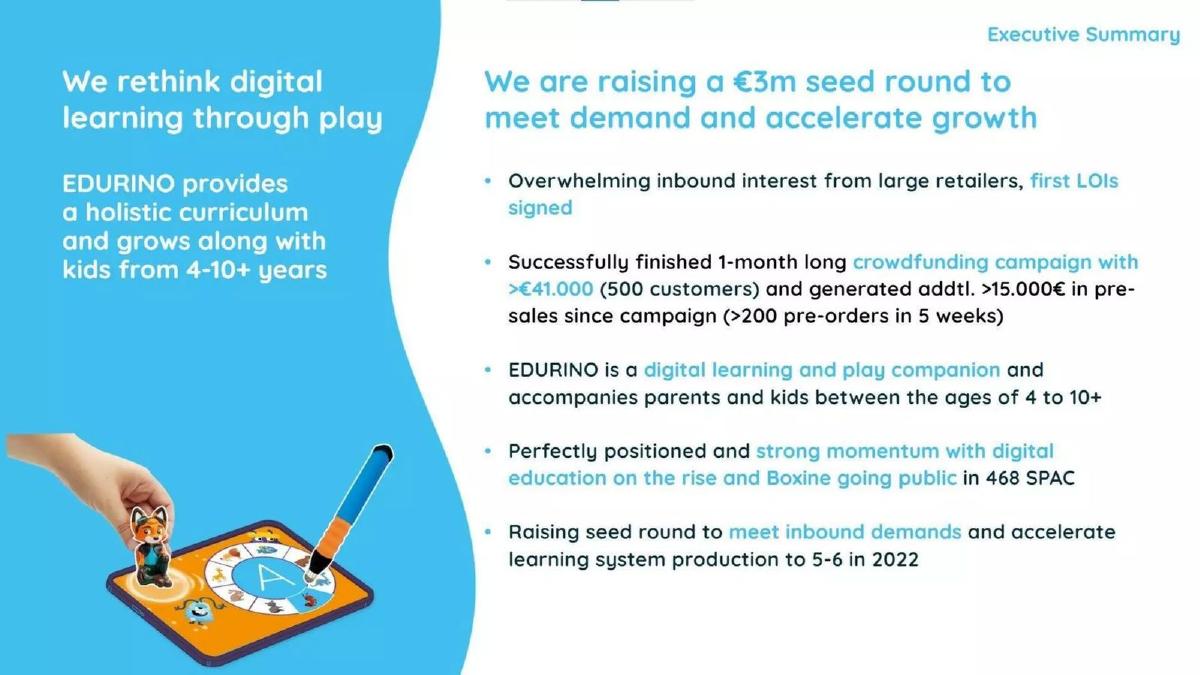
Children's learning game with physical figures and a pen. An executive summary slide for a €3M seed round.
Edurino deck, slide 2. Exact stored slide matched to this analysis.
Our analysis: Two stages of demand, each with money, customers and a period.
Evidence and limitation: €41,000 ÷ 500 ≈ €82 per customer in the campaign. The later pre-sales, >€15,000 from >200 pre-orders, give at most about €75 each if both figures are near their stated minimums; the ">" signs mean the true average is uncertain. Both periods are named (one month; five weeks).
What a founder can adapt: Keep the structure; give exact figures instead of ">" where you have them.
Supporting analysis
What the deck claims: "Successfully finished 1-month long crowdfunding campaign with >€41.000 (500 customers) and generated addtl. >15.000€ in pre-sales since campaign (>200 pre-orders in 5 weeks)." Also: "first LOIs signed" with large retailers.
Presentation choice: Showing sales continued after the campaign ended answers the question of whether demand was only campaign excitement.
When it does not fit: Don't call letters of intent from retailers orders; the slide correctly keeps them separate.
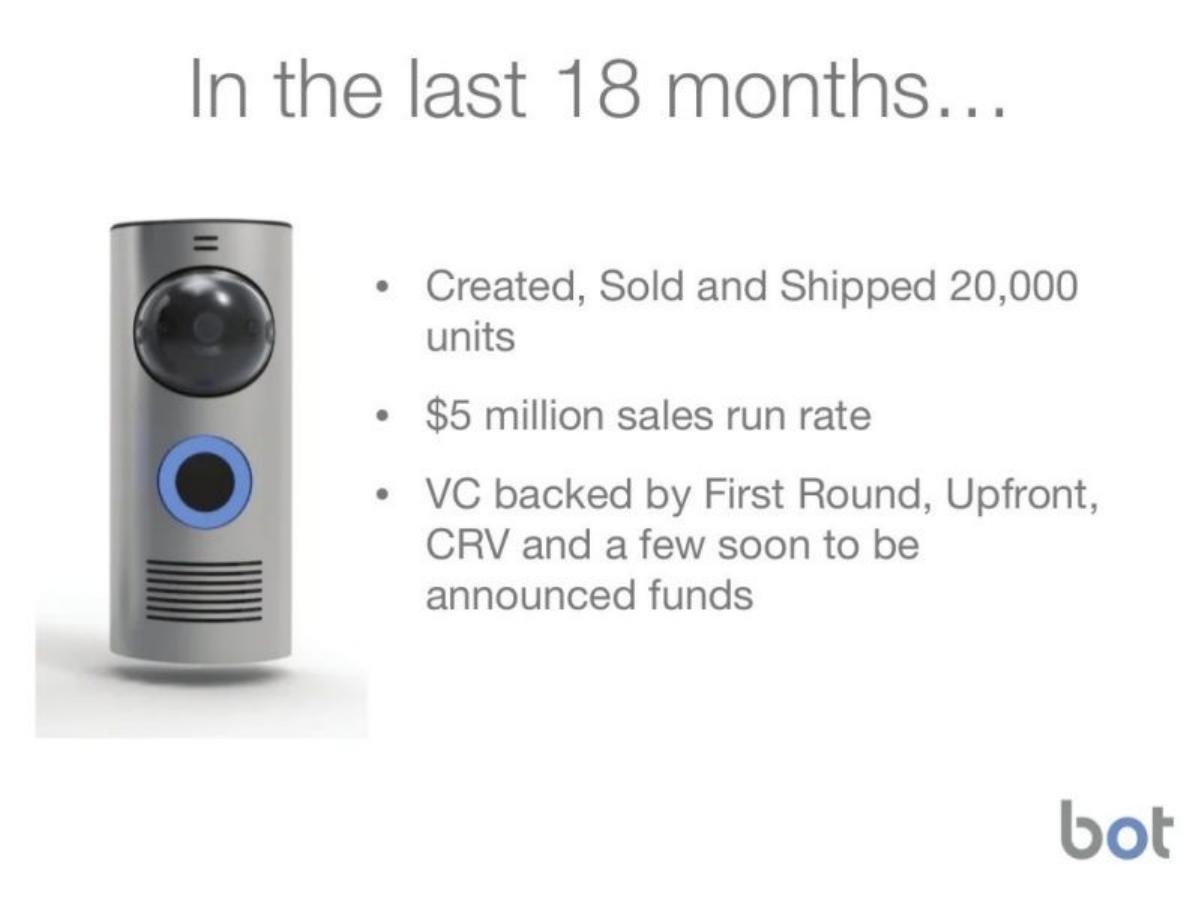
Video doorbell company, then early in its life. A photo of the doorbell beside three bullets.
Ring deck, slide 2. Exact stored slide matched to this analysis.
Our analysis: A cumulative unit count with its period, beside a current run rate.
Evidence and limitation: The units cover 18 months; the run rate is current sales annualised. The two can't be divided to give a price: $5M ÷ 20,000 = $250 would mix a cumulative count with a forward-looking annual figure. What the pair shows is that current sales are running well ahead of the 18-month average. "Sold and shipped" says units reached customers, not just stock.
What a founder can adapt: Add the month the run rate is based on: "$5M run rate ([month] sales × 12)."
Supporting analysis
What the deck claims: "In the last 18 months... Created, Sold and Shipped 20,000 units. $5 million sales run rate. VC backed by First Round, Upfront, CRV and a few soon to be announced funds."
Presentation choice: A named period and "sold and shipped" make the count checkable; the run rate shows recent pace.
When it does not fit: Don't imply a run rate and a cumulative total describe the same period.
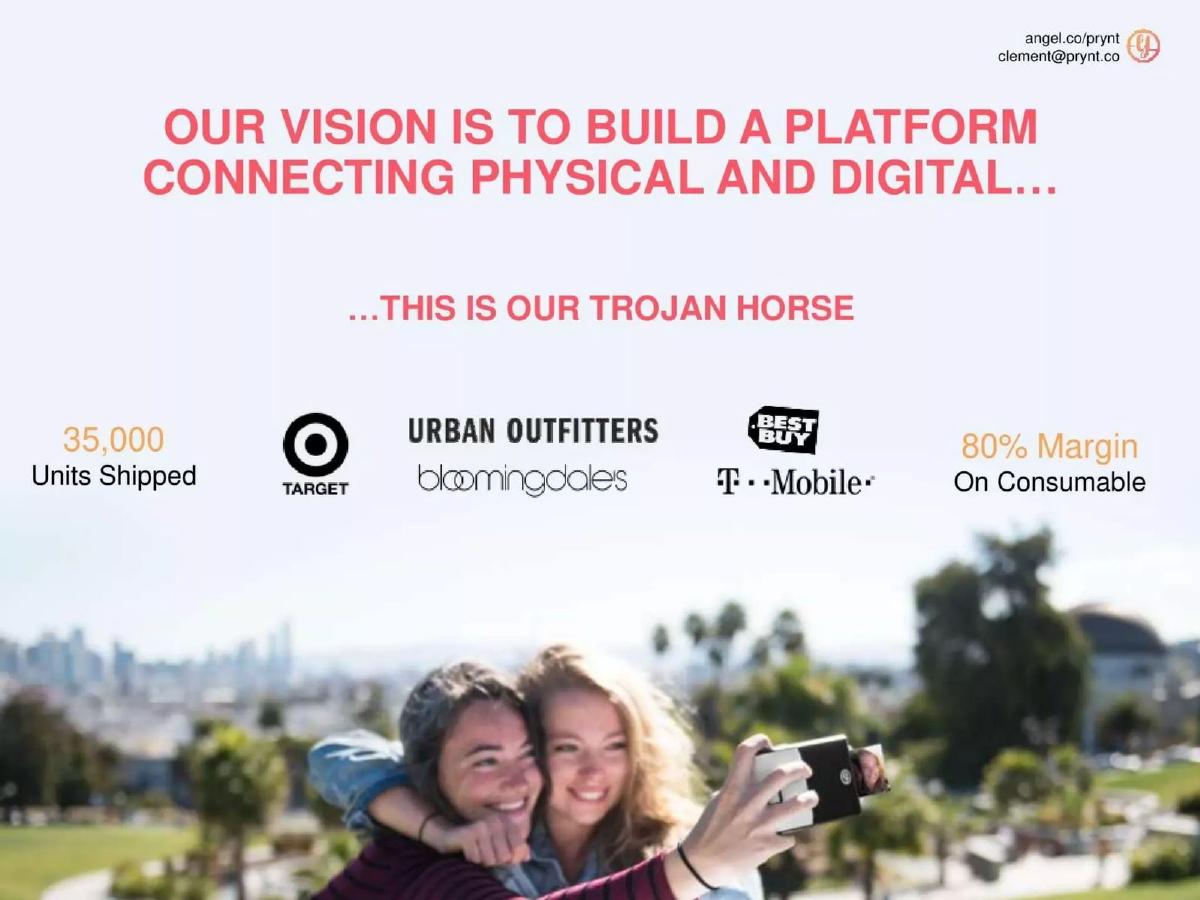
Instant-photo phone case. A slide headed "Our vision is to build a platform connecting physical and digital… this is our Trojan horse".
Prynt deck, slide 4. Exact stored slide matched to this analysis.
Our analysis: A volume figure and distribution, without sell-through or a period.
Evidence and limitation: "Shipped" beside retailer logos can mean shipped to those stores, not bought by shoppers; the slide doesn't say, and gives no period. The 80% margin applies to the consumable (photo paper), not the device, which the wording correctly limits.
What a founder can adapt: "35,000 units shipped since [date]; [n]% sold through at retail; [n] paper packs per device."
Supporting analysis
What the deck claims: "35,000 Units Shipped." Retailer logos: Target, Urban Outfitters, Bloomingdale's, Best Buy, T-Mobile. "80% Margin On Consumable."
Presentation choice: Retailers and a unit count establish that the product is in the market; the consumable margin points to repeat revenue.
When it does not fit: Don't let units shipped into retail stand in for customer purchases.
Loungewear brand. A screenshot of the founder's Kickstarter page under the heading "My Experiment".
Lazy Creatures deck, slide 4. Exact stored slide matched to this analysis.
Our analysis: A small campaign presented as a test, with dates.
Evidence and limitation: $9,603 ÷ 81 ≈ $119 per backer. The goal isn't shown, so how far it was beaten isn't known. Framing a small campaign as an experiment is honest: 81 backers shows people would pay, not that there is a large market.
What a founder can adapt: Add the goal and what happened next: "$9,603 from 81 backers ($[goal] goal); [repeat rate] of backers reordered."
Supporting analysis
What the deck claims: Screenshot: "81 backers", "$9,603 pledged", "Funded." Text: "In February of 2014, I started planning a Kickstarter campaign to test for product/market fit… I launched the campaign in May, and hit my goal amount in June."
Presentation choice: Calling it an experiment sets the reader's expectations correctly and shows the founder tested before building more.
When it does not fit: Don't present a small campaign as proof of market size.
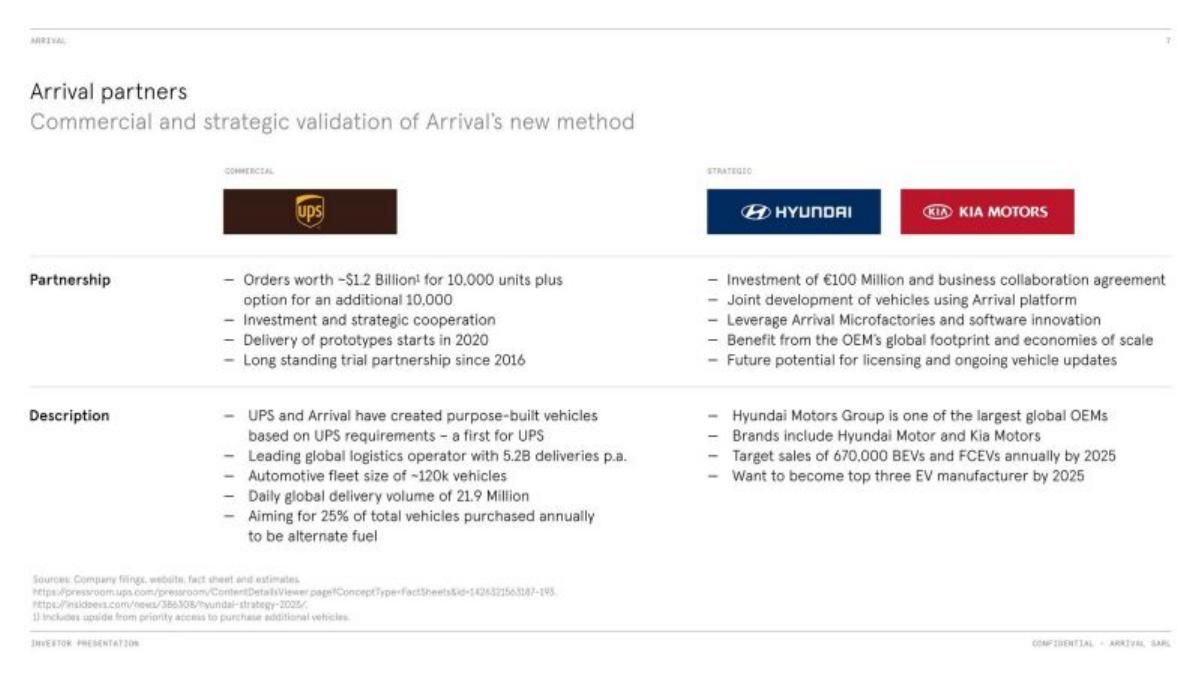
Electric commercial vehicle maker; an investor presentation from its move to the public market. A table of two partners, UPS and Hyundai/Kia.
Arrival deck, slide 6. Exact stored slide matched to this analysis.
Our analysis: A large partner order with its unit count, value and option stated separately.
Evidence and limitation: ~$1.2B ÷ 10,000 ≈ $120,000 per vehicle. The option for 10,000 more is kept separate from the order, which is correct: an option is not a commitment. The slide doesn't say how much, if anything, is payable before delivery or whether the order can be cancelled — the questions that decide how firm a partner order is.
What a founder can adapt: Add firmness: "10,000 units, ~$1.2B (firm / cancellable; [deposit] paid); option for 10,000 more."
Supporting analysis
What the deck claims: UPS: "Orders worth ~$1.2 Billion for 10,000 units plus option for an additional 10,000." "Delivery of prototypes starts in 2020." A footnote qualifies the order figure.
Presentation choice: Units and value together let a reader check the price; separating the option avoids doubling the figure.
When it does not fit: Don't add options to firm orders in a headline number.
Air purifier maker. A lifestyle photo with four lines of text.
Aeris deck, slide 2. Exact stored slide matched to this analysis.
Our analysis: The headline number is missing; the rest has no base.
Evidence and limitation: "X" is a placeholder left on the slide, so the main figure is missing. The 800% growth has no base (units, revenue, or a starting figure), so it can't be checked. Countries and retailers show reach, not volume.
What a founder can adapt: "[n] units sold in 2020 ([n] in 2019, +800%); 12 countries, 50+ retailers."
Supporting analysis
What the deck claims: "Over X Units Sold." "+800% Growth For 2020." "Sold in 12 Countries with Over 50 Retailers."
Presentation choice: Included as a warning: a placeholder on a sent deck costs more credibility than a small number would.
When it does not fit: Don't send a deck without searching it for placeholders like X, TBD or [ ].
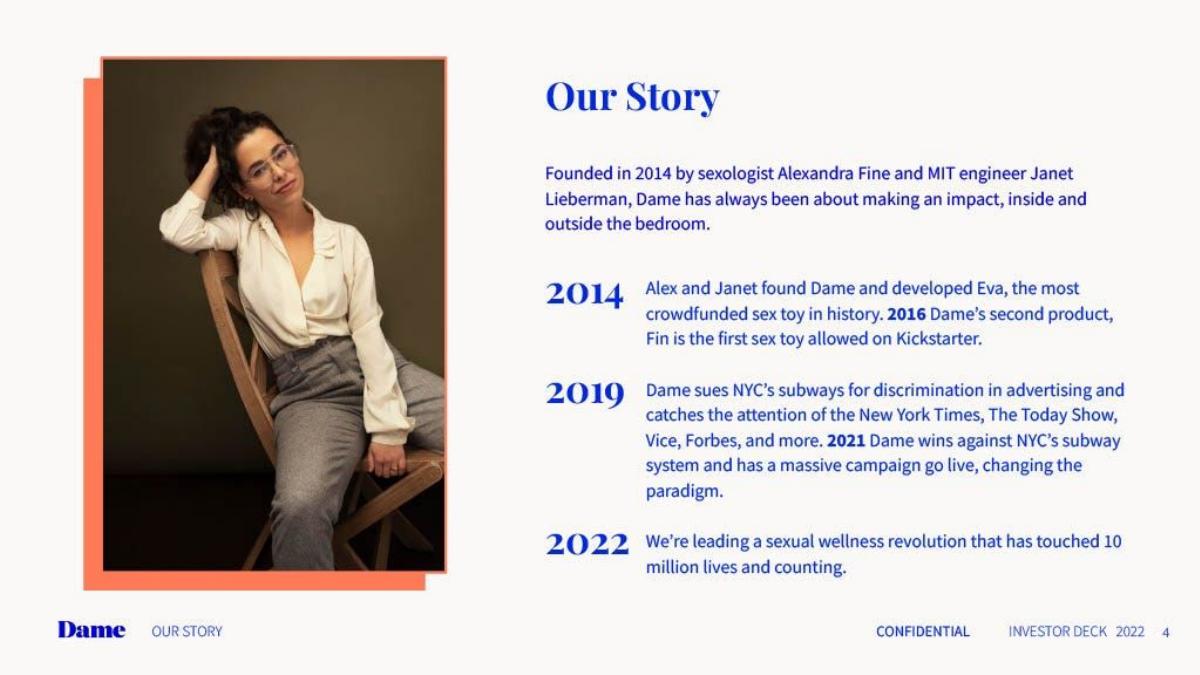
Sexual wellness brand. A company-story slide from its 2022 investor deck.
Dame deck, slide 4. Exact stored slide matched to this analysis.
Our analysis: A ranking claim and a reach figure, neither defined.
Evidence and limitation: "Most crowdfunded … in history" gives no amount, number of backers or source, so it can't be checked on the slide. "Touched 10 million lives" doesn't say whether that is customers, reach or media audience.
What a founder can adapt: "Eva: $[amount] from [n] backers on [platform], [year] — the largest for the category as of [date]."
Supporting analysis
What the deck claims: "2014 Alexandra and Janet found Dame and developed Eva, the most crowdfunded sex toy in history. 2016 Dame's second product, Fin is the first sex toy allowed on Kickstarter." "2022 … a sexual wellness revolution that has touched 10 million lives and counting."
Presentation choice: A category record can be strong evidence when it comes with the figure; alone it reads as a slogan.
When it does not fit: Don't state a "most" or "first" without the figure and a source.
Whether each slide says what was counted, whether money changed hands, the period and the amount.
Example
Count
Money shown
Period
Per customer
Main gap
Omate
4,378 backers
$1,032,352 pledged
Not stated
≈$236
Goal and dates
Clair Health
5,600 pre-orders; 23,000 waitlist
Redacted
Since 3 Feb 2026
Not shown
Value; deposit or full
Edurino
500 + 200 customers
>€41,000; >€15,000
1 month; 5 weeks
≈€82; ≤~€75
Exact figures
Ring
20,000 units sold and shipped
$5M run rate
18 months
Can't be derived
Run-rate month
Prynt
35,000 units shipped
Not stated
Not stated
Not shown
Sell-through; period
Lazy Creatures
81 backers
$9,603 pledged
May–June 2014
≈$119
Goal
Arrival
10,000 vehicles (+10,000 option)
~$1.2B
Deliveries from 2020
≈$120,000
Firmness; deposit
Aeris
"X" units (placeholder)
Not stated
2020
Not shown
Headline number missing
Dame
"Most crowdfunded"
Not stated
2014
Not shown
Amount; source
Piper
8 units, one buyer
Not stated
Not stated
Not shown
Total volume
Key Takeaways
A waitlist, a paid pre-order, a crowdfunding pledge and a shipped unit are different levels of commitment; name which one you are counting.
Give the money beside the count so a reader can see the price paid per customer.
Date the count: "since launch on [date]" or "in [n] weeks".
Units shipped to retailers are not units bought by customers; say which.
A partner's order with options attached is not the same as a firm order; separate the two.
Check the slide for placeholders and figures without a base before sending it.
Write your demand line
Fill in each line before putting a pre-order or unit figure on a slide.
What was counted. Waitlist sign-ups, paid pre-orders, deposits, crowdfunding backers, partner orders, units shipped, or units bought by end customers.
Money. The amount collected or committed, and whether deposits are refundable.
Period. The start date, or "in [n] weeks since launch".
Per customer. Money ÷ count, so a reader can compare it with your price.
Firmness. For partner orders: firm or cancellable, options listed separately.
Next step. Delivery date, and how many pre-orders have converted to shipped units.
Copyable framework: [n] [paid pre-orders / backers / units sold] worth [amount] since [date] ([full payment / refundable deposit]); [waitlist] on the waitlist.
Illustrative example 1 — written by us
Before: Over X Units Sold. +800% Growth For 2020.
After: [n] units sold in 2020, up from [n] in 2019 (+800%), through 50+ retailers in 12 countries.
What improved: Our illustrative rewrite; not Aeris's wording. Bracketed values are placeholders. It supplies the missing figure and the base for the growth rate.
What this guide adds
The pre-revenue guide covers evidence before any sales, such as pilots, letters of intent and surveys. The consumer product guide covers sell-through once a product is on shop shelves. This page covers the step in between for products you can hold: demand shown as pre-orders, crowdfunding and units shipped, and how to word each so it isn't overstated.
Five counts, five levels of commitment
Waitlist sign-ups: an email address, no money. Useful for showing reach, weak as proof of demand.
Paid pre-orders or deposits: money collected before delivery. Say whether it is a full payment or a refundable deposit.
Crowdfunding backers: people who pledged on a platform such as Kickstarter. The total pledged divided by backers gives the average pledge, a rough price check. Pledges can include reward tiers above the product price.
Orders from a business partner: often large, but may include options (the right to buy more later) that are not firm.
Units shipped or sold: shipped to a retailer is not the same as bought by an end customer; returns and unsold stock sit between the two.
How we read each slide
We quote figures as shown and use only visible numbers in calculations. Where a slide gives both money and a count, we divide to find the average per customer. We don't assume a price, a date or a conversion rate the slide doesn't show.
Common mistakes
Waitlist presented as orders. Sign-ups cost nothing; keep them separate from paid pre-orders.
Total without a count. Give backers or customers next to the money.
No period. "In nine weeks" means more than a bare total.
Shipped treated as sold. Stock in shops isn't a customer purchase.
Options added to orders. Rights to buy more later are not commitments.
Placeholders left in. Search the deck for X, TBD and brackets before sending.
Diagnostic checklist
What was counted is named (waitlist, pre-order, backer, shipped, sold).
Money collected or committed is shown.
Deposit or full payment, and refundable or not, stated.
Period or start date stated.
Partner orders separated from options.
No placeholders or growth figures without a base.
Frequently asked questions
How we chose these examples
Corpus: published pitch deck teardowns on StartupFundraising.com. Founder-uploaded private decks are excluded.
Selection (2026-09-25): we searched stored slide text on slides 2–7 for pre-order, Kickstarter, Indiegogo, backers, units sold, units shipped and installed base, excluding disclaimer and market-size slides, kept only slides with a stored slide image, and inspected each image. We excluded a duplicate copy of the Ring slide, market-size slides that count other companies' units, and slides where units referred to property.
Figures are quoted as shown in the stored slide images. Calculations are ours and use only visible numbers. Where figures are given as minimums (">"), derived averages are approximate.
Review: stored slide text and images were checked on 2026-09-25 and matched to company, deck and slide number (editorial model review). No person has yet completed an editorial review of this page. We make no claim that any slide caused a fundraising outcome.