How consumer apps show traction without revenue: active users, retention, DAU/MAU and engagement instead of downloads. Seven real slides compared.
Consumer App Traction Slide: Real Examples
Seven consumer app traction slides, shown in full, compare which numbers prove people keep using an app, and which only prove they installed it.
TL;DR
For a consumer app, downloads show reach but not whether people stay. The stronger slides below lead with active users over a dated period and a measure of return: Wunderlist's daily and monthly actives from Dec '12 to Jul '13, Renaissance's 35% DAU/MAU, Pair's 61% retention, Localeikki's 24% returning within seven days. The weaker ones stop at downloads or show a curve with no values. Whatever you show, define it: retention over what period, active meaning what, growth rate calculated how.
Consumer app traction slides from real pitch decks
Each example shows the exact stored slide above its analysis and links to the full teardown. Figures are the companies' own claims. Stage and year are given only where the slide states them.
Wunderlist traction slide — slide 5
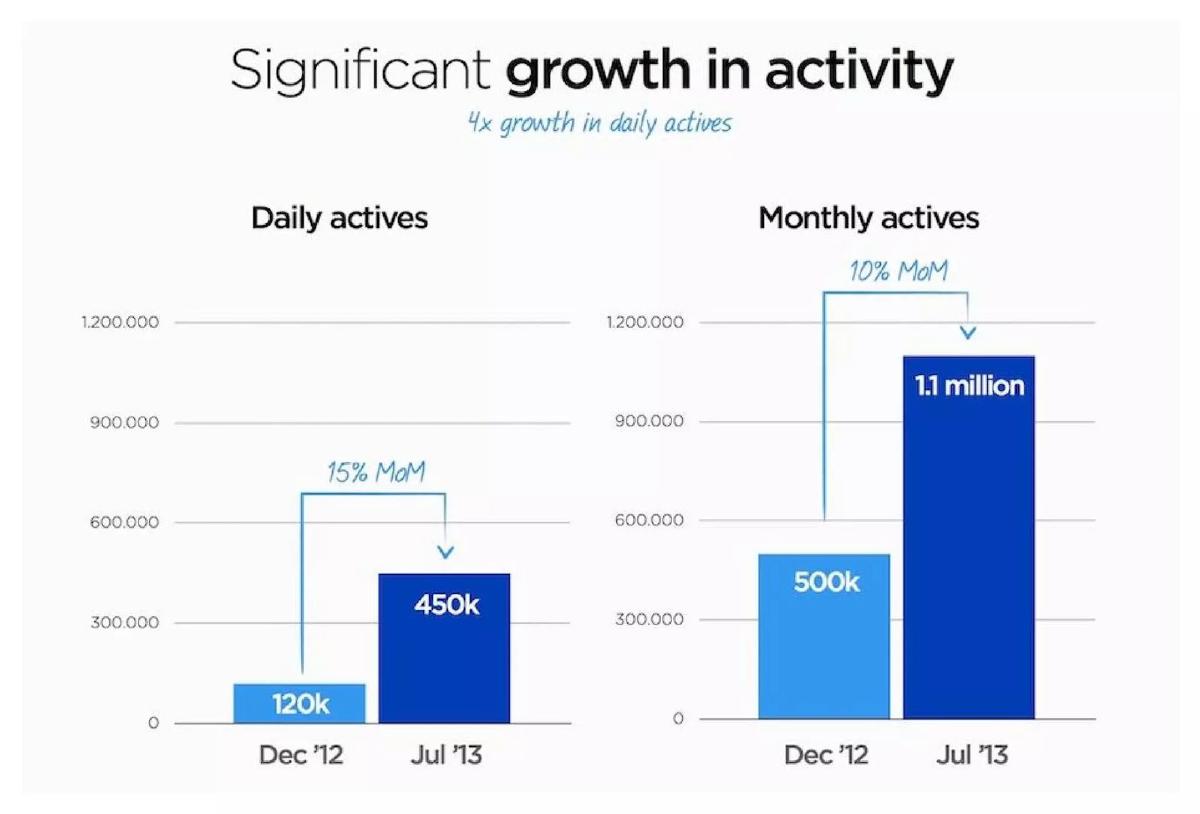
To-do list app. The slide compares Dec '12 with Jul '13.
Wunderlist deck, slide 5. Exact stored slide matched to this analysis.
Our analysis: Two dated bars per metric, both daily and monthly, and a growth rate for each. Daily actives growing faster than monthly actives means a larger share of users return each day.
Evidence and limitation: 120k to 450k is 3.75x; the headline rounds to 4x. Use the exact multiple.
What a founder can adapt: Show daily and monthly actives side by side for the same two dates.
Supporting analysis
What the deck claims: "Significant growth in activity — 4x growth in daily actives": daily actives 120k (Dec '12) to 450k (Jul '13), labelled 15% month on month; monthly actives 500k to 1.1 million, labelled 10% month on month.
Presentation choice: Two dated bars per metric, both daily and monthly, and a growth rate for each. Daily actives growing faster than monthly actives means a larger share of users return each day.
When it does not fit: 120k to 450k is 3.75x; the headline rounds to 4x. Use the exact multiple.
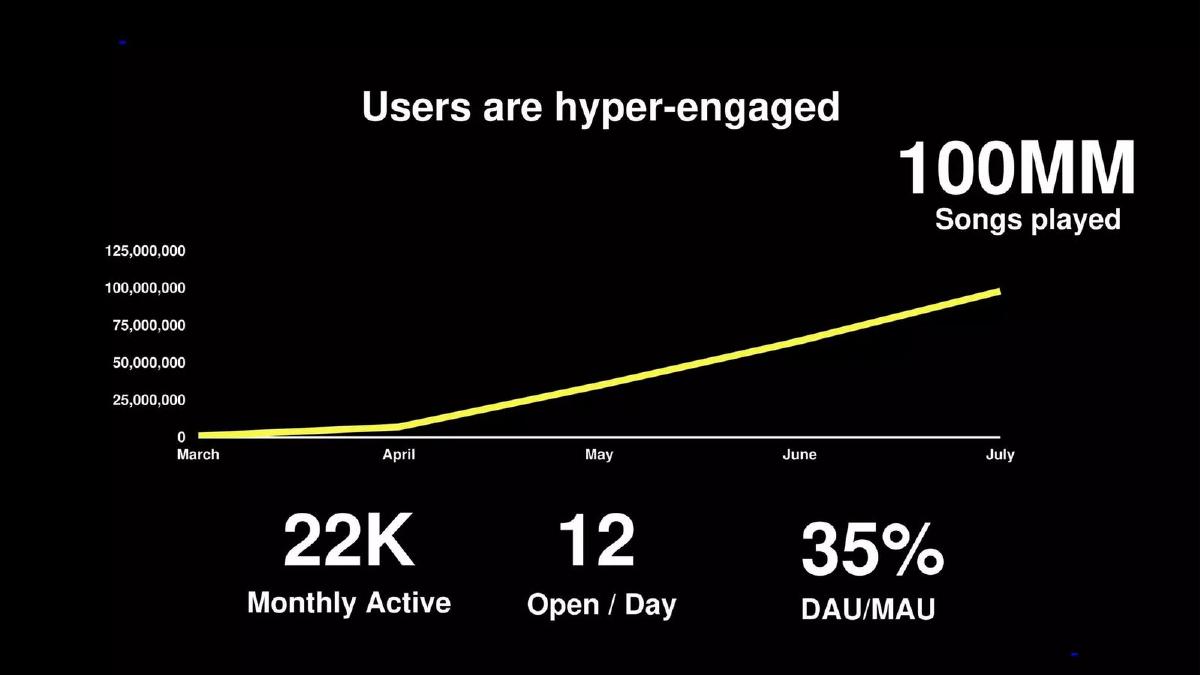
Music app. The chart runs March to July; the year is not stated.
Renaissance deck, slide 5. Exact stored slide matched to this analysis.
Our analysis: DAU/MAU and opens per day measure habit directly, which matters more than user count at this size.
Evidence and limitation: A cumulative line always rises. Show plays per active user per month instead, and state the year.
What a founder can adapt: Add one engagement ratio (DAU/MAU, sessions per day) next to your user count.
Supporting analysis
What the deck claims: "Users are hyper-engaged": a cumulative songs-played line reaching 100 million, with 22K monthly active users, 12 opens per day and 35% DAU/MAU.
Presentation choice: DAU/MAU and opens per day measure habit directly, which matters more than user count at this size.
When it does not fit: A cumulative line always rises. Show plays per active user per month instead, and state the year.
Pair deck, slide 3. Exact stored slide matched to this analysis.
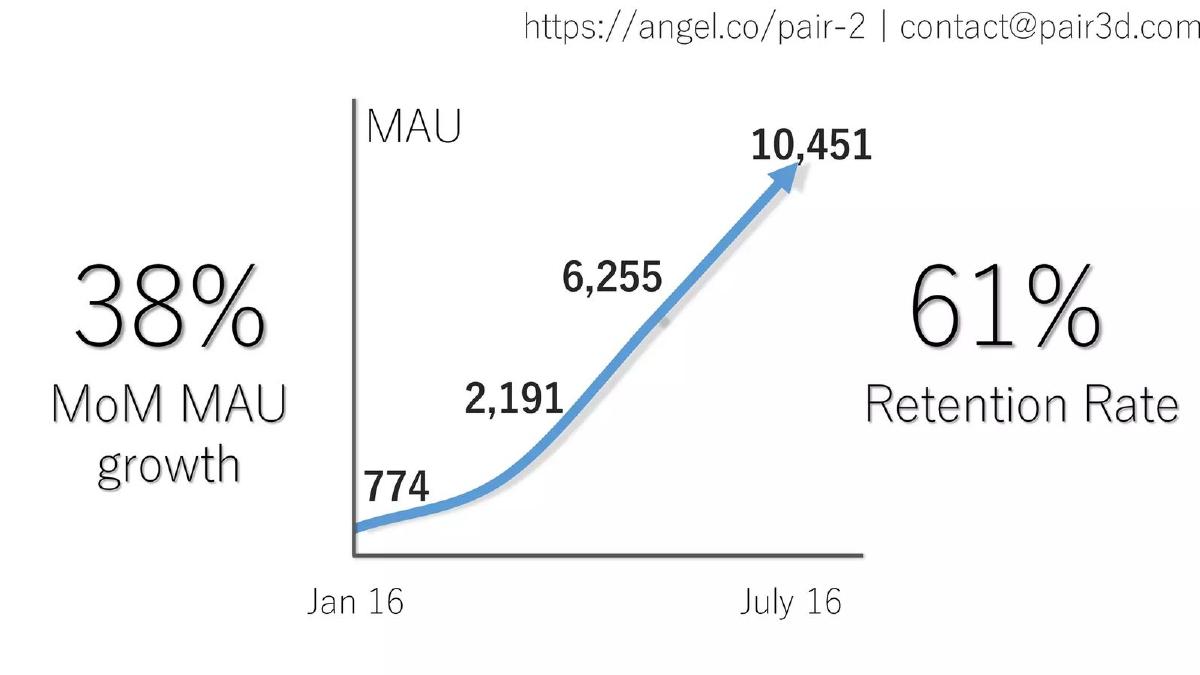
Our analysis: Monthly actives with real values and dates, plus a retention figure, on one clear slide.
Evidence and limitation: 774 to 10,451 in six months is about 54% a month on average, not 38%; explain the method. "Retention" needs a period (day 30? month 3?).
What a founder can adapt: Keep the dated values on the chart, as Pair does.
Supporting analysis
What the deck claims: MAU chart: 774 (Jan 16), 2,191, 6,255, 10,451 (July 16). "38% MoM MAU growth" and "61% Retention Rate".
Presentation choice: Monthly actives with real values and dates, plus a retention figure, on one clear slide.
When it does not fit: 774 to 10,451 in six months is about 54% a month on average, not 38%; explain the method. "Retention" needs a period (day 30? month 3?).
Local exploration app at MVP stage. Year not stated on the slide.
Localeikki deck, slide 5. Exact stored slide matched to this analysis.
Our analysis: The retention measure has a defined window (7 days), and the contribution rate shows users do more than open the app.
Evidence and limitation: "Traffic returning" could mean sessions or users. Say which.
What a founder can adapt: Give your return rate a window: day 1, day 7 or day 30.
Supporting analysis
What the deck claims: "The MVP": 4,200 downloads in the last 60 days; 16% user growth month on month for six months; content in 49 of 50 states (802 areas). Engagement: 24% of app traffic returning within 7 days; 60% contributed some content; 75 brand ambassadors.
Presentation choice: The retention measure has a defined window (7 days), and the contribution rate shows users do more than open the app.
When it does not fit: "Traffic returning" could mean sessions or users. Say which.
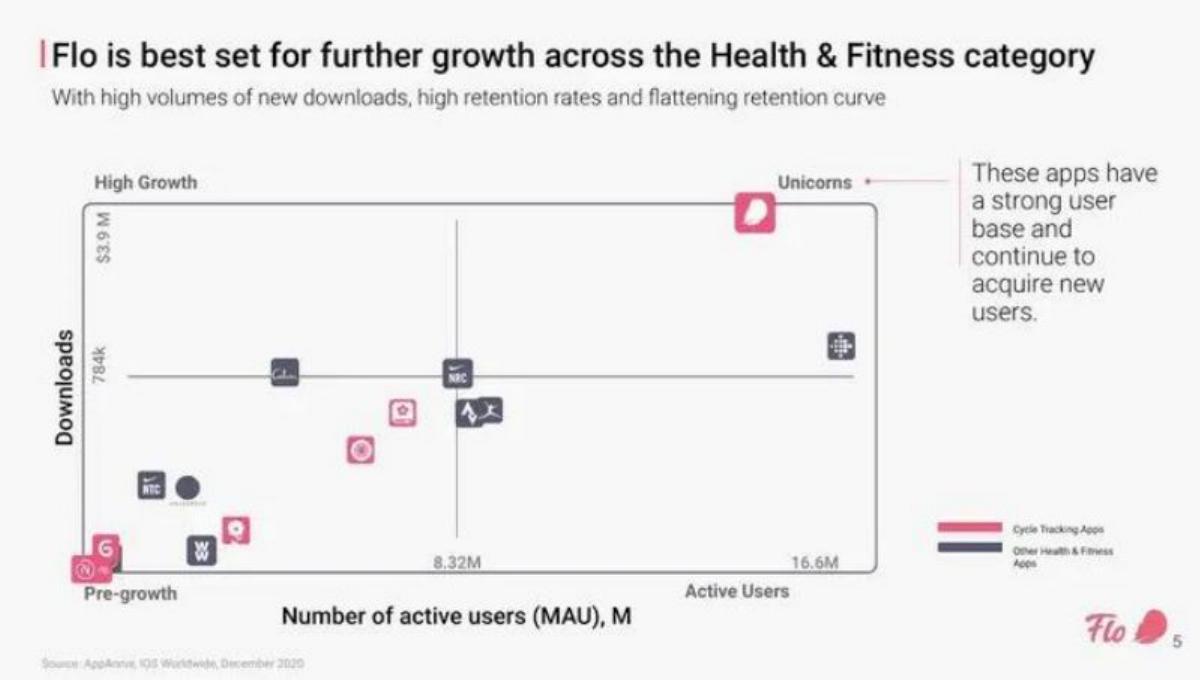
Women's health app. The chart cites App Annie, iOS worldwide, December 2020.
Flo deck, slide 5. Exact stored slide matched to this analysis.
Our analysis: Plotting downloads against active users shows both reach and use, and positions Flo against its category with a named, dated source.
Evidence and limitation: The subtitle claims high retention, but the chart doesn't show retention. Add the retention figure itself.
What a founder can adapt: At later stage, benchmark against category peers using a named third-party source.
Supporting analysis
What the deck claims: "Flo is best set for further growth across the Health & Fitness category": a scatter of downloads against monthly active users for health and fitness apps, with Flo in the top-right "Unicorns" corner (strong user base, still acquiring new users).
Presentation choice: Plotting downloads against active users shows both reach and use, and positions Flo against its category with a named, dated source.
When it does not fit: The subtitle claims high retention, but the chart doesn't show retention. Add the retention figure itself.
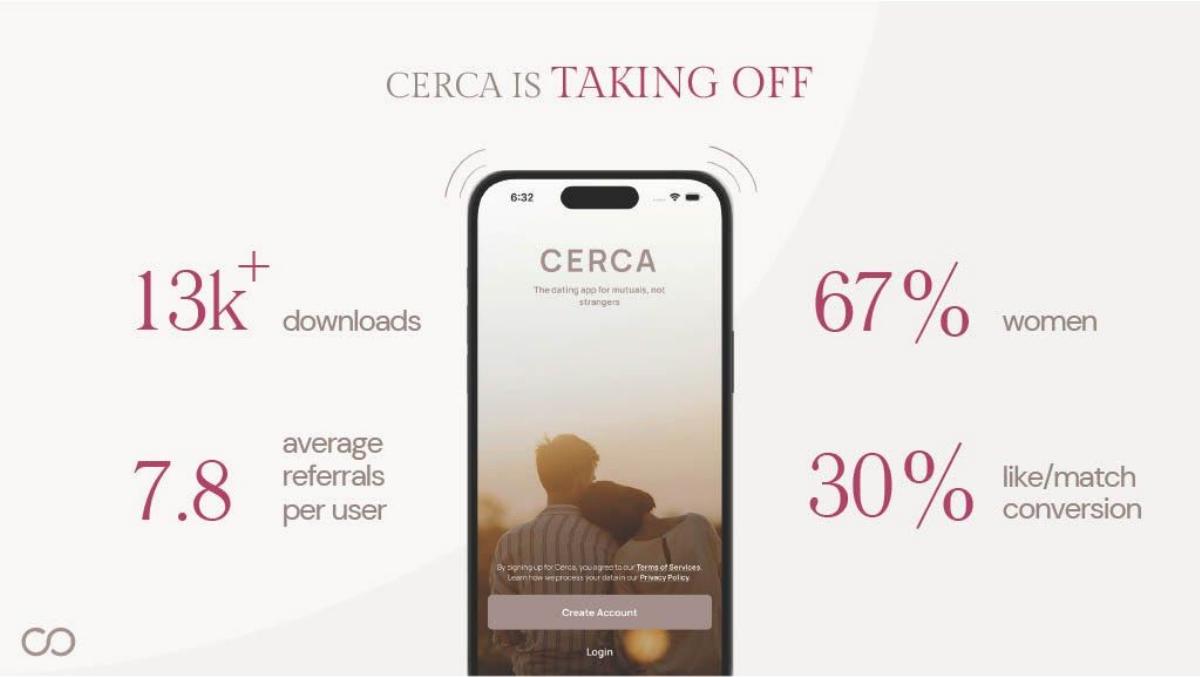
Dating app. Stage and year are not stated on the slide.
Cerca deck, slide 6. Exact stored slide matched to this analysis.
Our analysis: For a dating app, gender mix and match rate matter more than download count, and the referral figure suggests growth through users.
Evidence and limitation: No dates and no active users. "Taking off" needs a before and after.
What a founder can adapt: Treat this as a slide to improve on. Keep the category-specific metrics and add active users.
Supporting analysis
What the deck claims: "Cerca is taking off": 13k+ downloads, 67% women, 7.8 average referrals per user, 30% like/match conversion.
Presentation choice: For a dating app, gender mix and match rate matter more than download count, and the referral figure suggests growth through users.
When it does not fit: No dates and no active users. "Taking off" needs a before and after.
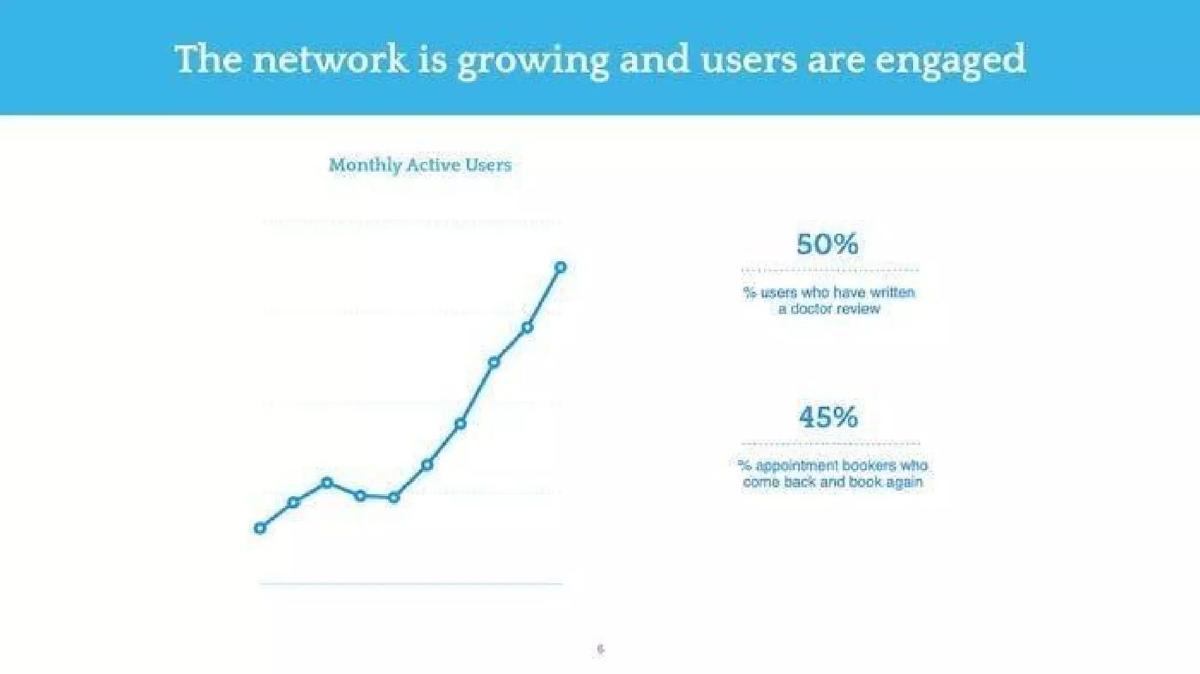
Doctor reviews and booking app. Stage and year are not stated on the slide.
Voro deck, slide 6. Exact stored slide matched to this analysis.
Our analysis: The repeat-booking rate is the right metric for a booking app.
Evidence and limitation: The MAU line has no axis values or dates, so its size and speed are unknown. Repeat booking needs a period.
What a founder can adapt: Treat this as a slide to improve on. Put values and dates on the chart.
Supporting analysis
What the deck claims: "The network is growing and users are engaged": a rising monthly active users line; 50% of users have written a doctor review; 45% of appointment bookers come back and book again.
Presentation choice: The repeat-booking rate is the right metric for a booking app.
When it does not fit: The MAU line has no axis values or dates, so its size and speed are unknown. Repeat booking needs a period.
Lead with active users, not downloads. Cerca's 13k+ downloads say little about use; its 30% like-to-match conversion says more.
Show daily and monthly actives together. Wunderlist shows both, and the ratio tells an investor how often people return.
Define retention. Pair's "61% retention rate" and Voro's 45% rebooking don't say over what period; Localeikki's "returning within 7 days" does.
Make growth figures reconcile with the chart. Pair's MAU rise from 774 to 10,451 over six months implies an average monthly rate above the 38% on the slide; say how the figure was calculated.
If you use third-party data, name it and date it. Flo cites App Annie, iOS worldwide, December 2020.
Build your consumer app traction slide
Answer each line with a number and a date.
Active users. Monthly actives at two dates. How do you define active?
Frequency. DAU/MAU, or sessions per user per week?
Return. What share returns on day 7 or day 30?
Core action. What share does the thing that matters (book, match, create)?
Growth. Growth rate, over what period, calculated how?
Copyable framework: [MAU] monthly actives ([date]), up from [x] ([date]); [y]% DAU/MAU; [z]% day-30 retention.
Illustrative example 1 — written by us
Before: 13k+ downloads. Cerca is taking off.
After: [x] monthly actives in [month], up from [y] in [month]; [z]% of new users active on day 30.
What improved: Our illustrative rewrite, not any company's text. Bracketed values are placeholders.
How this differs from the other traction guides
The main traction guide covers every kind of company. The SaaS guide covers recurring revenue; the marketplace guide covers transaction volume on two sides; the pre-revenue guide covers evidence before any customers. This guide covers consumer apps, where usage often comes before revenue and the question is whether people come back.
Common mistakes
Downloads as the headline. Installs show reach, not use.
Cumulative charts. They always rise. Show a monthly figure.
Retention without a period. Say day 7, day 30 or month 3.
Growth rates that don't match the chart. State the method.
Charts without values. Label axes and dates.
Diagnostic checklist
Active users at two dates.
"Active" is defined.
One frequency measure.
Retention with a stated period.
Growth rates match the chart.
Third-party data named and dated.
Frequently asked questions
How we chose these examples
Corpus: published pitch deck teardowns on StartupFundraising.com. Founder-uploaded private decks are excluded.
Selection (2026-09-24): we searched extracted text of slides 2–6 for downloads, daily or monthly active users, DAU/MAU and retention (about 90 slides) and inspected eight consumer app slides. Seven were selected. Lolli was left out because it already appears in the marketplace traction guide.
Overlap check: the main, SaaS, marketplace and pre-revenue traction guides use none of these slides and cover different metrics. Pages link to each other.
Arithmetic notes (Wunderlist multiple, Pair average monthly growth) are our calculations from the figures printed on the slides.
Review: all seven stored slide images were inspected on 2026-09-24 and matched to company, deck and slide number (editorial model review). No person has yet completed an editorial review of this page. Figures are the companies' own claims and have not been verified. We make no claim that any slide caused a fundraising outcome.