Freemium App Business Model Slides: 9 Real Examples
How consumer app decks show what stays free, what users pay for, the price and billing period, and how many free users pay.
Consumer App Business Model Slide: What Is Free, What Is Paid, and Who Pays
Most consumer apps give the product away and charge a minority of users, or sell the free users' attention to advertisers. This guide compares nine real consumer app business model slides on one question: does the slide say where the free line sits, what the paid offer costs and over what period, and what share of users is expected to pay?
TL;DR
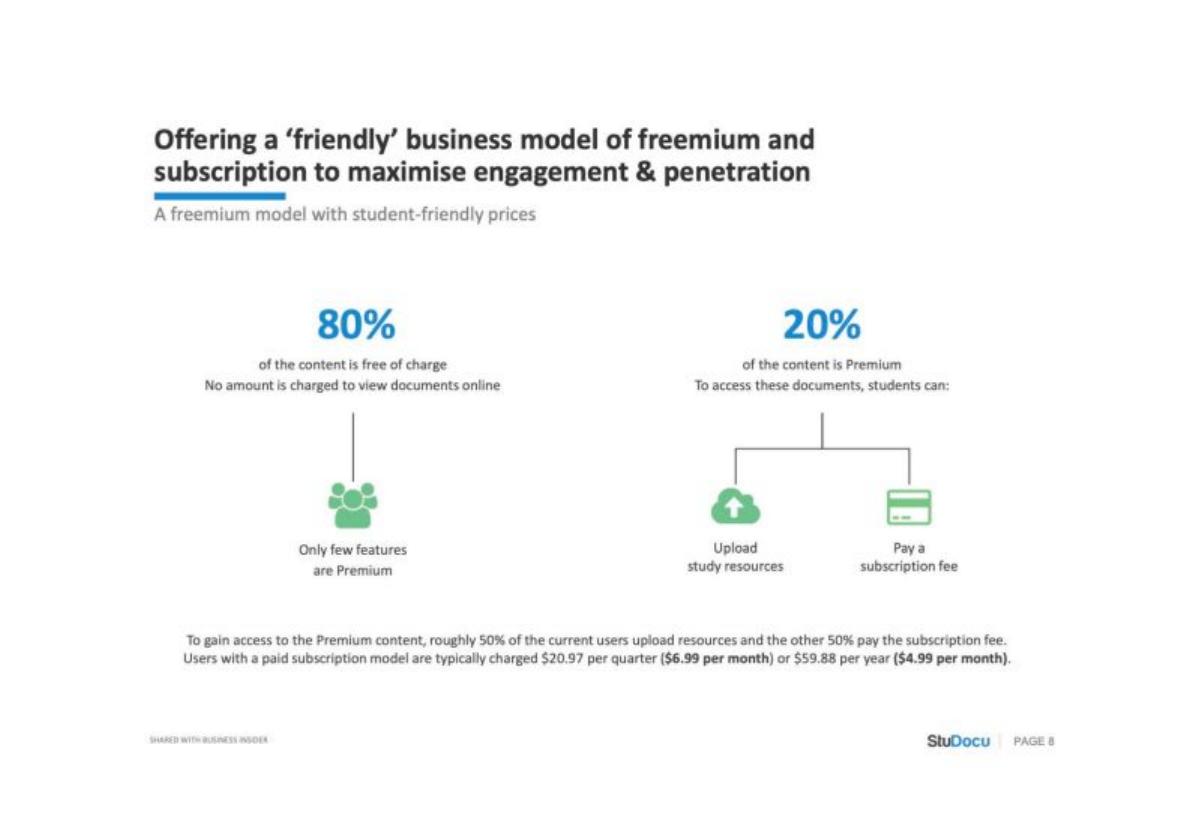
Show the line between free and paid, the price with its billing period, and the share of users who pay, labelled as measured or planned. StuDocu comes closest: 80% of its content is free, the rest is unlocked by uploading material or paying $20.97 a quarter or $59.88 a year, and it says roughly half of the users who unlock premium content pay while the other half upload. It doesn't say what share of all users that is. Meet5 and Wunderlist show prices with periods; LearnXYZ shows a clear free-versus-paid table but its $4.99 has no period. Naviself gives a paying share (30%) but as a forecast with prices whose period is not stated. BoxCryptor prices by platform. Connected2me, Irly and Choreosity list ways to earn money without prices or payer numbers.
Consumer app business model slides from real pitch decks
Each example shows the slide above its analysis and links to the full teardown. Slides that show the free line, a price with its period and a paying share come first. Claims are as shown on the slides; checks and comments are ours.
StuDocu business model slide — slide 8
Study-notes sharing platform for students. The footer reads "Shared with Business Insider".
StuDocu deck, slide 8. Exact stored slide matched to this analysis.
Our analysis: Uploading is a second way to pay: users give content instead of money, which feeds the free library. The slide makes the free line concrete (share of content) and prices both plans with periods.
Evidence and limitation: The monthly equivalents check out: $20.97 ÷ 3 = $6.99 and $59.88 ÷ 12 = $4.99. The 50/50 split describes users who gain premium access, not all users, so the share of all users who pay is not given. "Roughly" and "typically" leave the exact prices and split open, and the period the split was measured over isn't stated.
What a founder can adapt: Keep the structure and add the one missing figure: "[X]% of monthly active users paid in [month and year]", measured the same way as the 50/50 split.
Supporting analysis
What the deck claims: "Offering a 'friendly' business model of freemium and subscription to maximise engagement & penetration." "80% of the content is free of charge. No amount is charged to view documents online." "20% of the content is Premium. To access these documents, students can: Upload study resources / Pay a subscription fee." "To gain access to the Premium content, roughly 50% of the current users upload resources and the other 50% pay the subscription fee." "Users with a paid subscription model are typically charged $20.97 per quarter ($6.99 per month) or $59.88 per year ($4.99 per month)."
Presentation choice: An investor can see what is free, what is paid, what it costs and how premium users split between the two ways in.
When it does not fit: Don't let a split among premium users stand in for a conversion rate across all users.
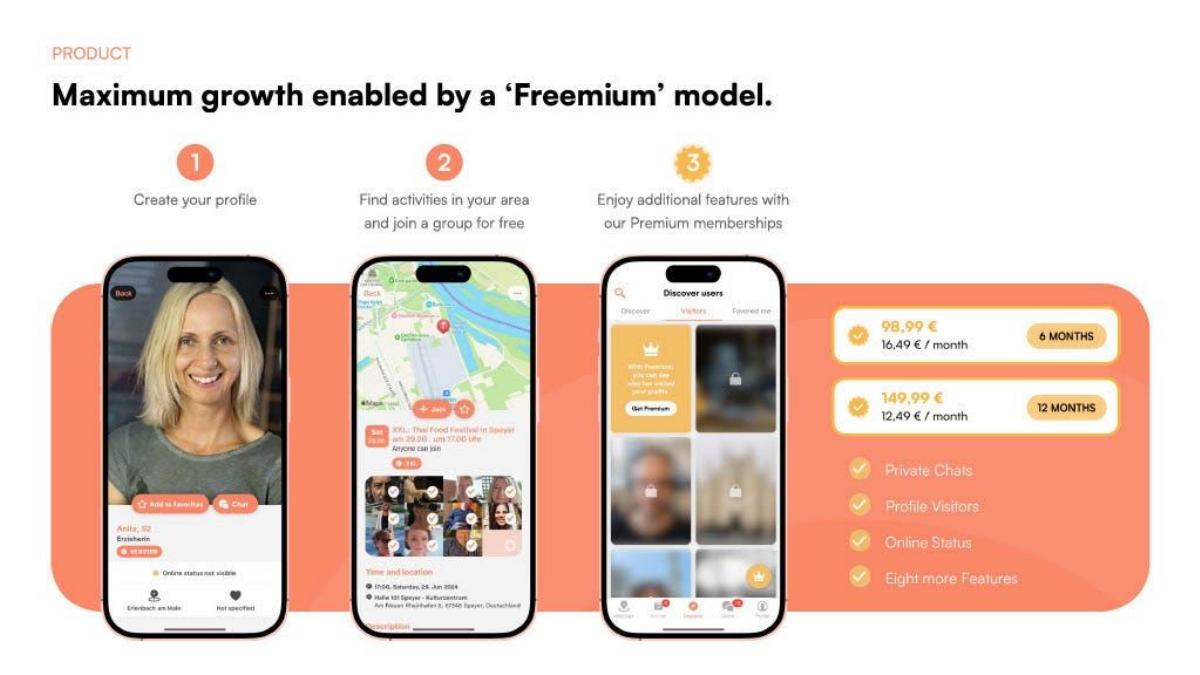
App for meeting people through local group activities. Headed "Product".
Meet5 deck, slide 6. Exact stored slide matched to this analysis.
Our analysis: The free line is clear from the phone screens: joining activities is free; seeing who visited you and private chat are paid. Pricing is shown in six- and twelve-month commitments only.
Evidence and limitation: The arithmetic holds: €98.99 ÷ 6 = €16.50 and €149.99 ÷ 12 = €12.50, so the monthly figures round down by a cent. The slide shows no share of users who pay and no monthly plan.
What a founder can adapt: Add the paying share and the plan mix: "[X]% of active users hold Premium; [Y]% choose 12 months ([period])".
Supporting analysis
What the deck claims: "Maximum growth enabled by a 'Freemium' model." Steps: "Create your profile"; "Find activities in your area and join a group for free"; "Enjoy additional features with our Premium memberships". Plans: "98,99 € / 16,49 € / month / 6 months"; "149,99 € / 12,49 € / month / 12 months". Premium features: "Private Chats, Profile Visitors, Online Status, Eight more Features".
Presentation choice: It ties the paid features to the product flow, which makes the upgrade reason easy to follow.
When it does not fit: "Maximum growth" is a claim about the model, not a result; pair it with a number.
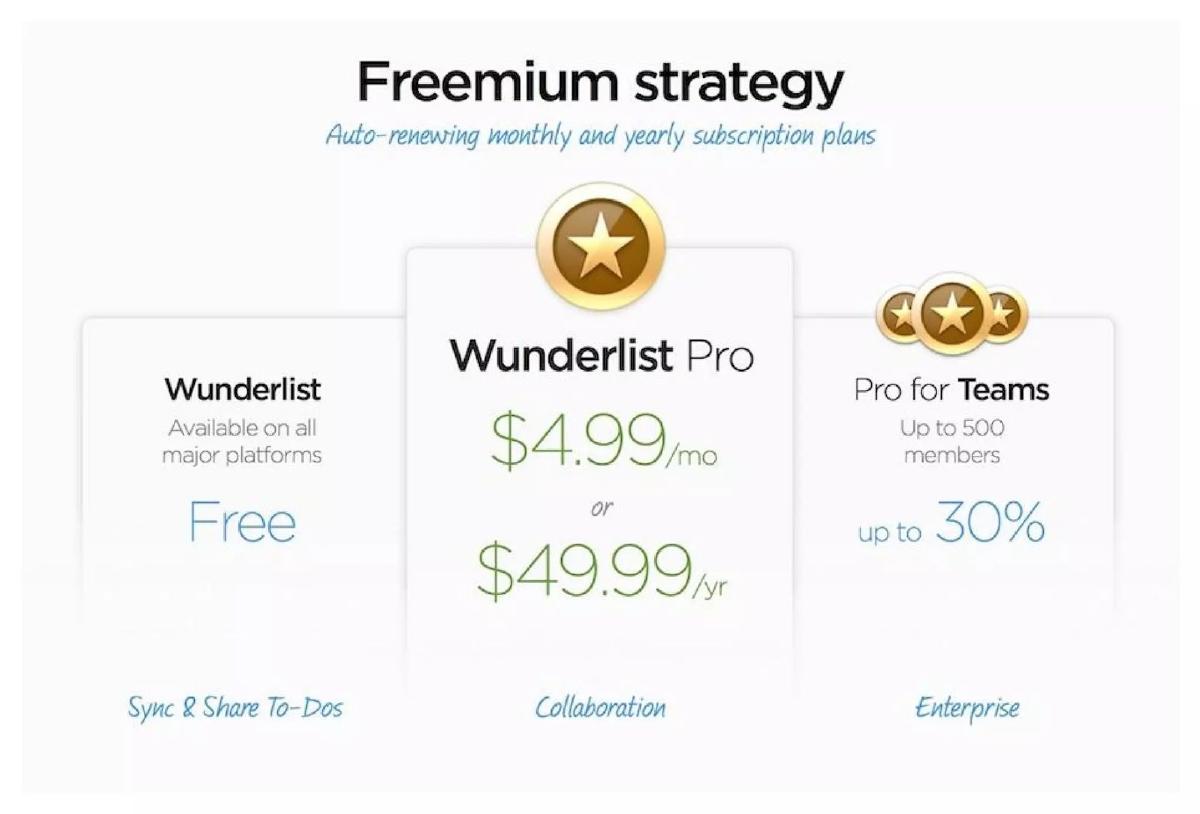
To-do list app. The same deck's traction slide appears in the consumer app traction guide.
Wunderlist deck, slide 9. Exact stored slide matched to this analysis.
Our analysis: Three tiers with a one-word reason to upgrade under each (sync, collaboration, enterprise). The free tier is described as a feature, not a limit.
Evidence and limitation: Pro prices have periods; the yearly plan is about 17% cheaper than twelve months at $4.99 ($59.88). "Up to 30%" under Pro for Teams is unexplained; it may be a discount, but the slide doesn't say. No paying share is shown.
What a founder can adapt: Label every number: "Teams: [X]% off Pro per seat, up to 500 members". Add "[X]% of active users on Pro ([period])".
Supporting analysis
What the deck claims: "Freemium strategy. Auto-renewing monthly and yearly subscription plans." "Wunderlist: Available on all major platforms. Free. Sync & Share To-Dos." "Wunderlist Pro: $4.99/mo or $49.99/yr. Collaboration." "Pro for Teams: Up to 500 members. up to 30%. Enterprise."
Presentation choice: A compact ladder where each step has a price or a label and a purpose.
When it does not fit: An unlabelled percentage invites the wrong reading.
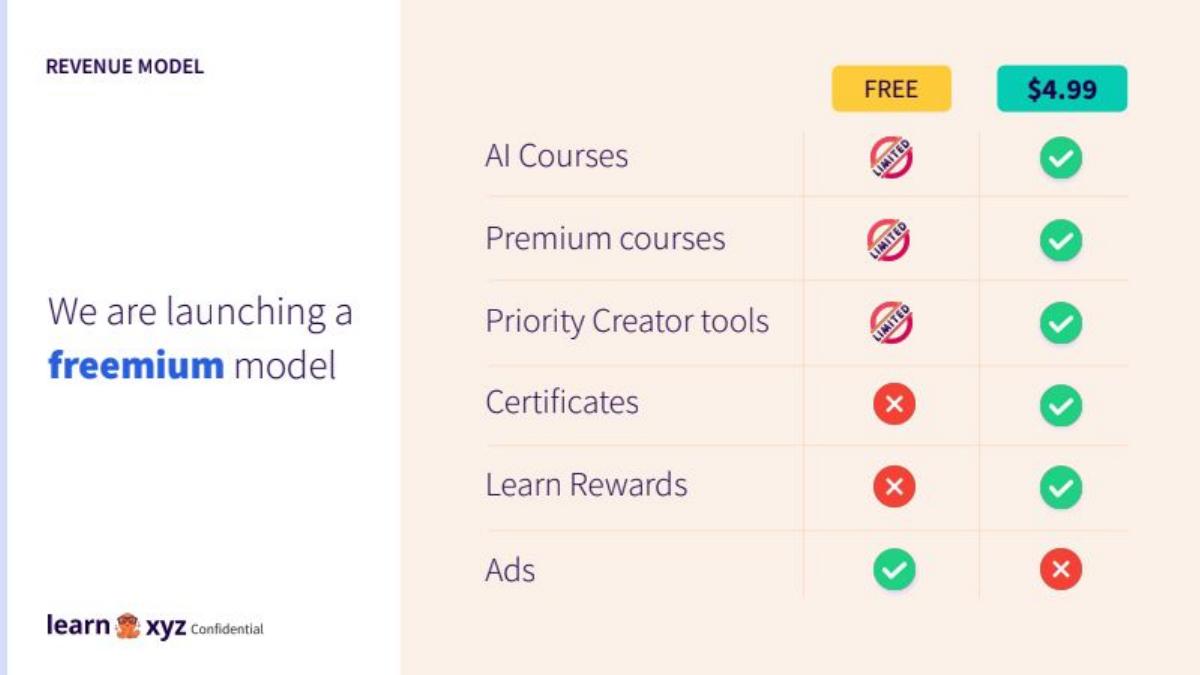
Learning app with AI-generated and creator courses. Headed "Revenue model".
LearnXYZ deck, slide 9. Exact stored slide matched to this analysis.
Our analysis: Two revenue lines: subscriptions from paying users and ads shown to free users.
Evidence and limitation: The free line is the clearest in the set. The price has no period, so $4.99 could be monthly, yearly or one-off. "Launching" marks the model as planned, and the slide gives no expected paying share or ad revenue basis.
What a founder can adapt: Add the period and the plan: "$4.99 per [month]; we expect [X]% of active users to pay, based on [test or comparable]".
Supporting analysis
What the deck claims: "We are launching a freemium model." A table with columns "Free" and "$4.99": AI Courses, Premium courses and Priority Creator tools are "limited" on free and included on paid; Certificates and Learn Rewards are paid only; Ads appear on free and not on paid.
Presentation choice: A reader sees at a glance what they give up by not paying, which is the whole argument of a freemium model.
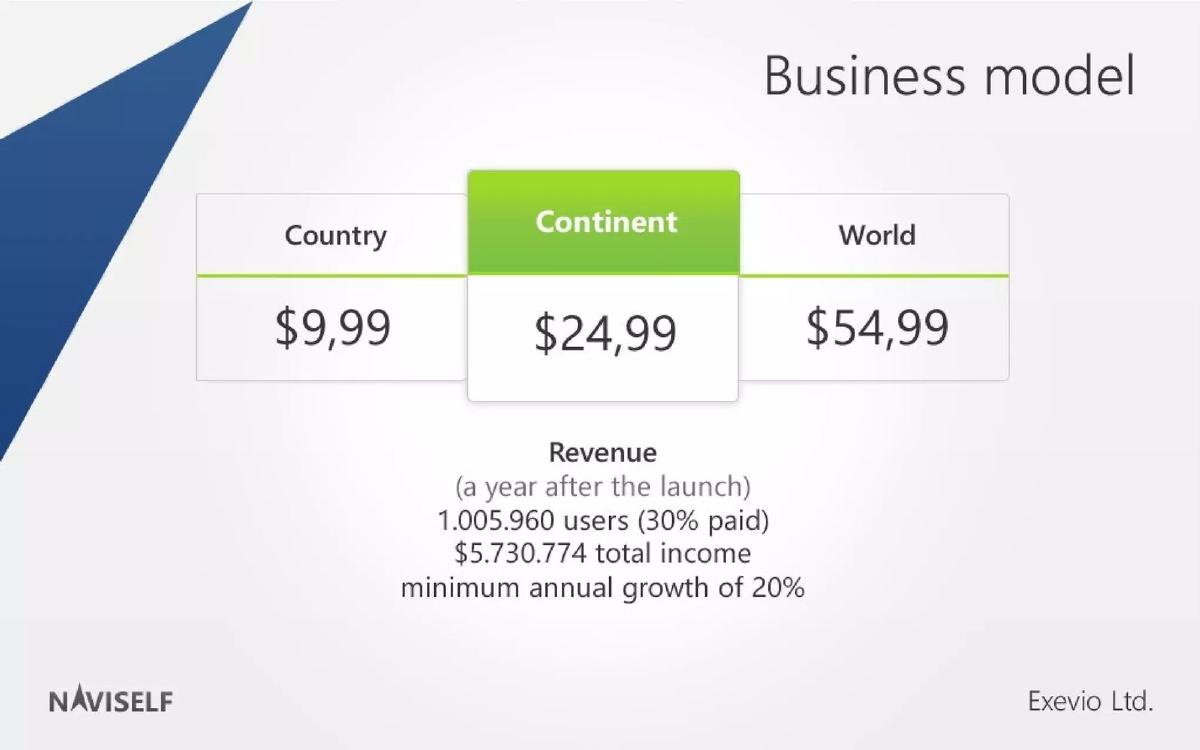
Naviself deck, slide 11. Exact stored slide matched to this analysis.
Our analysis: The only slide besides StuDocu to give a paying share; here it is an assumption, and a high one for a paid-upgrade app. The implied mix can be reconstructed but isn't shown.
Evidence and limitation: 30% of 1,005,960 is 301,788 paying users, and $5,730,774 ÷ 301,788 is about $18.99 each, between the Country and Continent prices. The slide doesn't say whether the prices are one-off or recurring, how buyers split across the three, or where 30% comes from. All the figures are a forecast for a year after launch.
What a founder can adapt: Show the build-up and its source: "[N] users × [X]% paying (based on [test or benchmark]) × average $[Y] ([Country/Continent/World mix]) = $[Z], forecast for [period]". State whether each price is one-off or yearly.
Supporting analysis
What the deck claims: Prices by coverage: "Country $9,99", "Continent $24,99", "World $54,99". "Revenue (a year after the launch): 1.005.960 users (30% paid), $5.730.774 total income, minimum annual growth of 20%."
Presentation choice: It connects price, users and revenue in one line, which lets an investor test the assumptions.
When it does not fit: Precise forecasts (1,005,960 users) without a basis read as certainty they don't have.
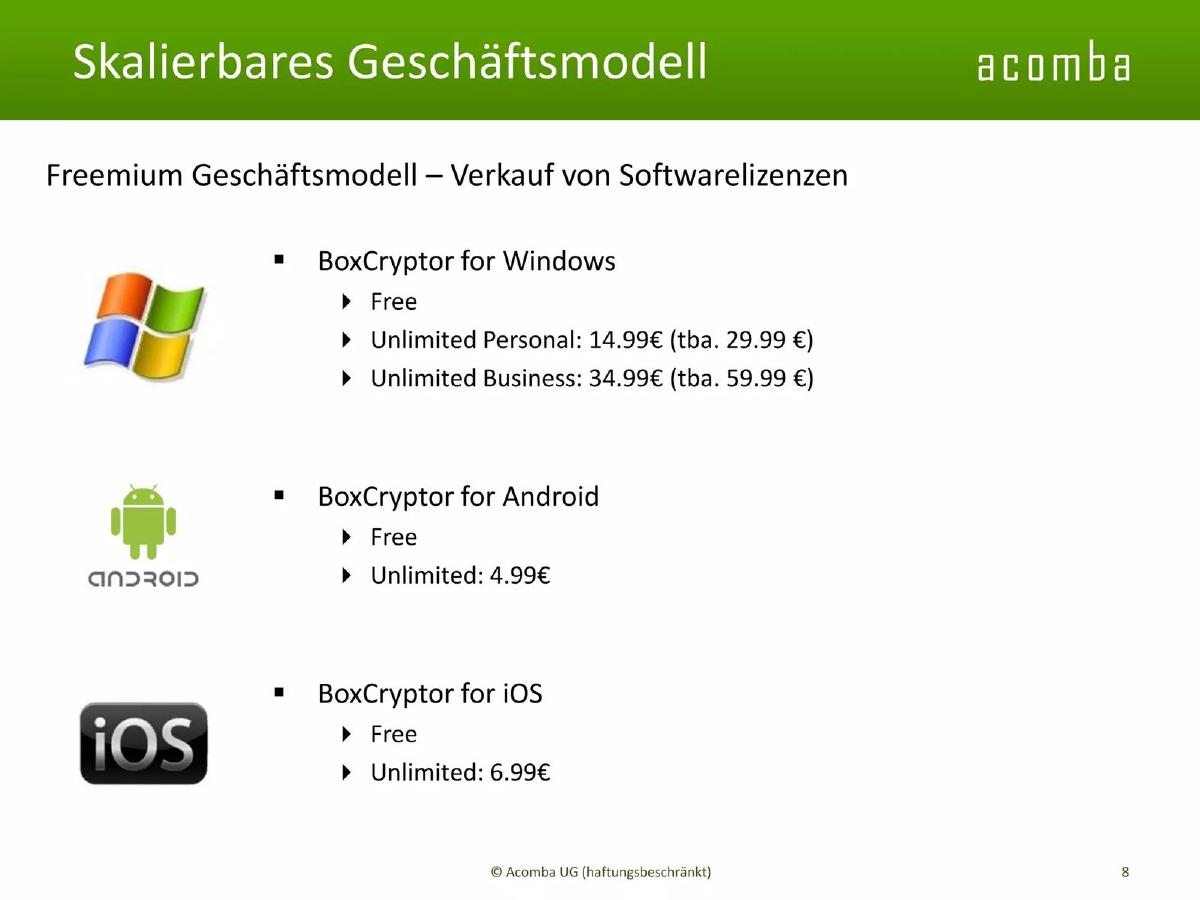
File encryption for cloud storage, from Acomba UG. German-language slide.
BoxCryptor deck, slide 8. Exact stored slide matched to this analysis.
Our analysis: Personal and business buyers are split on desktop only; mobile is a single upgrade.
Evidence and limitation: Prices differ by platform and Windows prices are marked to rise ("tba"). "Licences" suggests one-off purchases, but the slide doesn't state the term. "Unlimited" implies the free version has a limit; the limit isn't named.
What a founder can adapt: Name the free limit and the licence term: "Free up to [limit]; Unlimited [price], [one-off or per year]".
Supporting analysis
What the deck claims: "Skalierbares Geschäftsmodell" (scalable business model). "Freemium Geschäftsmodell – Verkauf von Softwarelizenzen" (freemium model, sale of software licences). Windows: Free; Unlimited Personal 14.99€ (tba. 29.99€); Unlimited Business 34.99€ (tba. 59.99€). Android: Free; Unlimited 4.99€. iOS: Free; Unlimited 6.99€.
Presentation choice: Planned price rises are shown separately from current prices, which is honest.
When it does not fit: "Scalable" needs a reason on the slide, such as low cost per extra user.
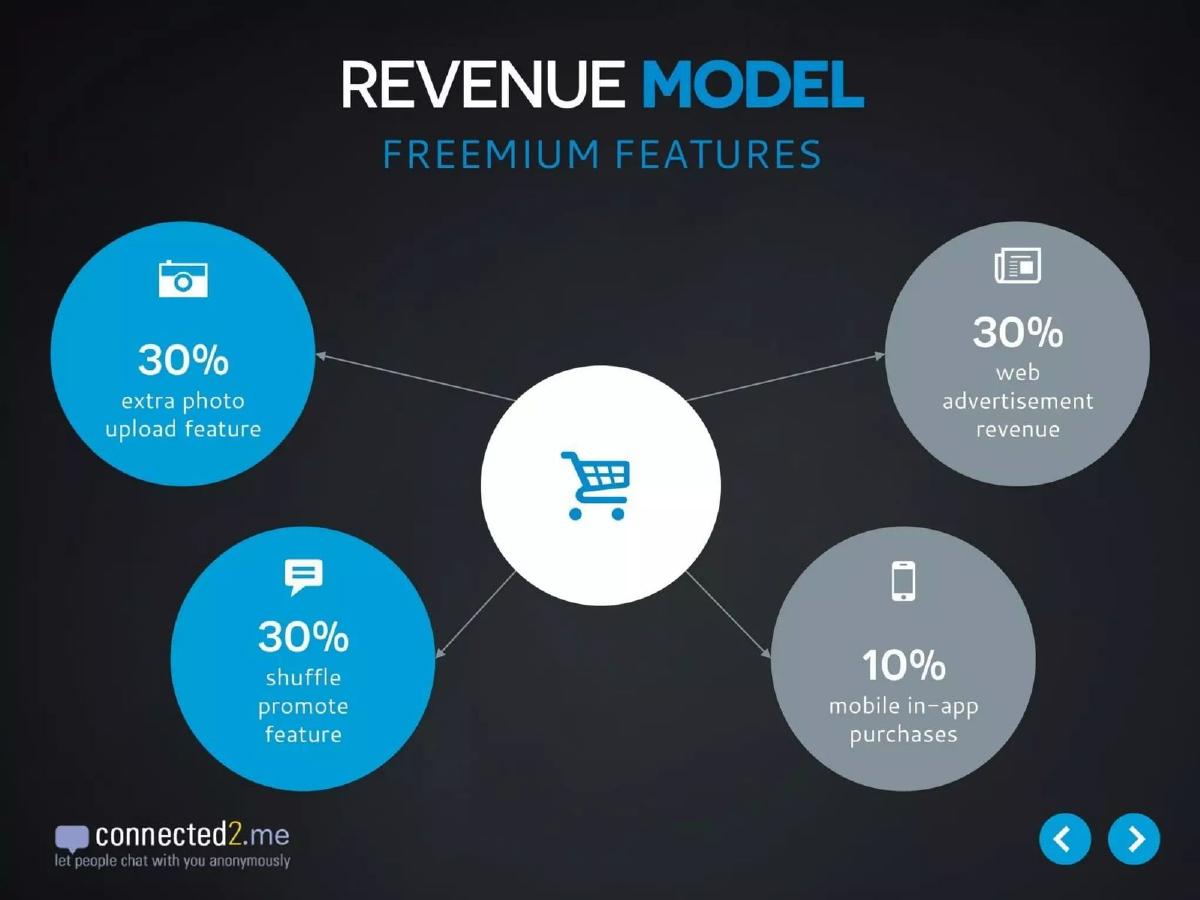
Connected2me deck, slide 9. Exact stored slide matched to this analysis.
Our analysis: Three of the four lines are paid features; one is advertising on the web.
Evidence and limitation: The four percentages add to 100%, which suggests a revenue mix, but the slide doesn't say whether it is actual or planned, or what they are shares of. No prices or paying share.
What a founder can adapt: "Share of revenue, [period, actual or forecast]: photo uploads [X]% at $[price] ..."
Supporting analysis
What the deck claims: "Revenue model. Freemium features." "30% extra photo upload feature"; "30% shuffle promote feature"; "30% web advertisement revenue"; "10% mobile in-app purchases".
Presentation choice: Included to show how an unlabelled mix leaves the reader guessing.
When it does not fit: Percentages with no label or period.
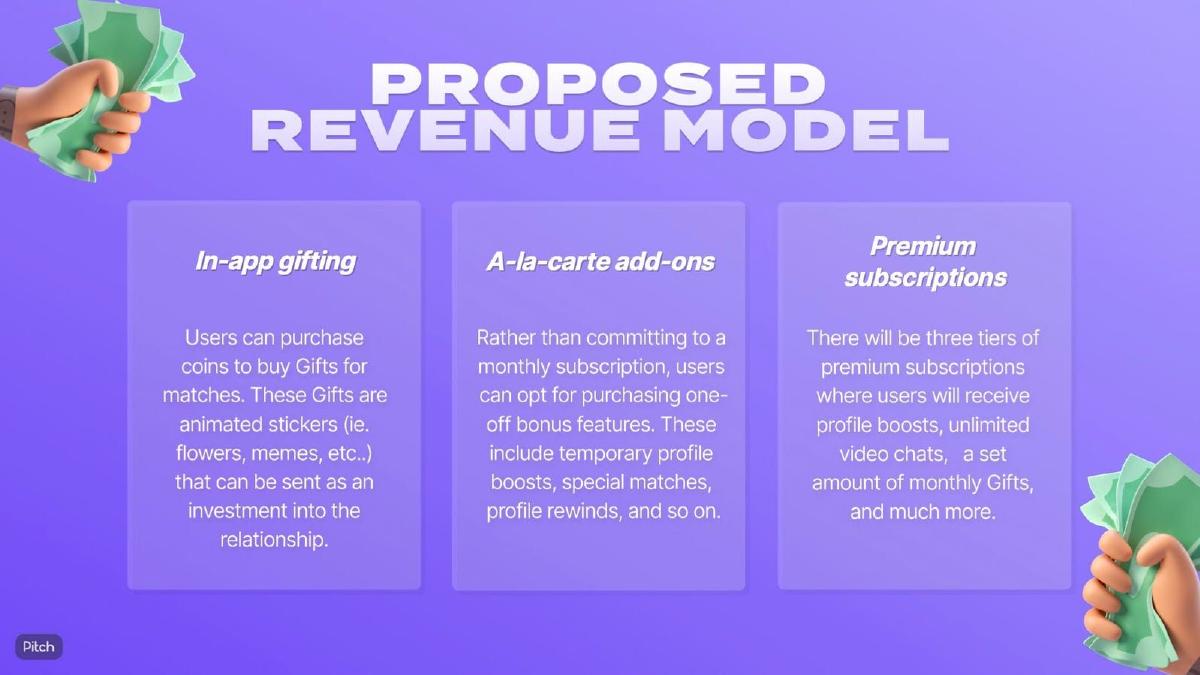
Dating app. Headed "Proposed revenue model". Included as a weaker example.
Irly deck, slide 12. Exact stored slide matched to this analysis.
Our analysis: Three ways to pay, from small one-off purchases to subscriptions, with gifts shared across them.
Evidence and limitation: "Proposed" and "will be" mark the model as planned, which is honest. The slide gives no prices, no tier names and no expected paying share.
What a founder can adapt: Price one of each: "Coins: [N] for $[X]; boost $[Y] one-off; Premium from $[Z]/month".
Supporting analysis
What the deck claims: "In-app gifting: Users can purchase coins to buy Gifts for matches ..." "A-la-carte add-ons: Rather than committing to a monthly subscription, users can opt for purchasing one-off bonus features ... temporary profile boosts, special matches, profile rewinds." "Premium subscriptions: There will be three tiers of premium subscriptions where users will receive profile boosts, unlimited video chats, a set amount of monthly Gifts, and much more."
Presentation choice: It explains the purpose of each stream clearly; what's missing is any number.
When it does not fit: Three planned streams without saying which comes first.
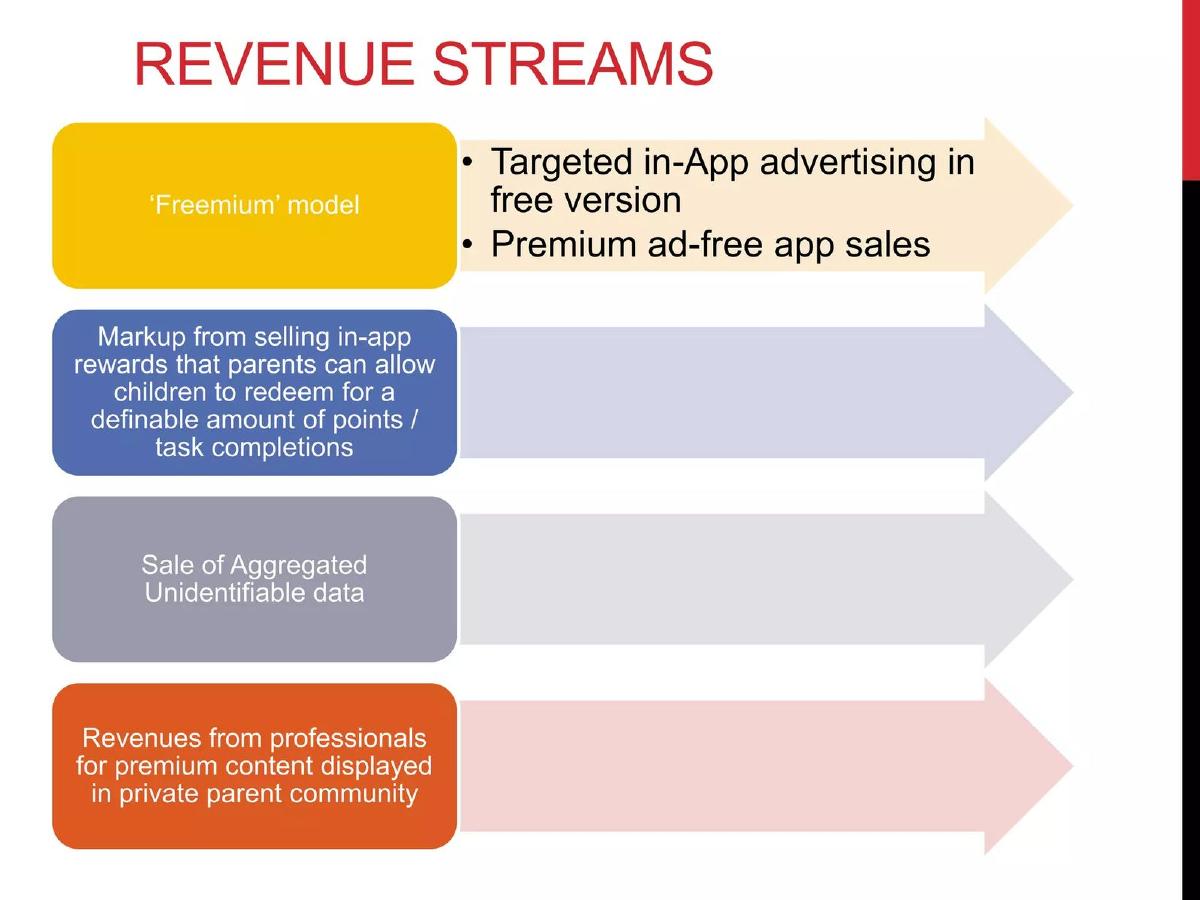
Chores and rewards app for families. Included as a weaker example.
Choreosity deck, slide 14. Exact stored slide matched to this analysis.
Our analysis: A list of options rather than a chosen model.
Evidence and limitation: Four streams with no prices, order or share of revenue. Targeted advertising and data sales in an app used by children raise questions (consent, privacy rules) the slide doesn't address.
What a founder can adapt: Lead with one stream and price it: "Premium: $[X] per [period], ad-free"; move the others to a "later" line.
Supporting analysis
What the deck claims: "Revenue streams": "'Freemium' model: Targeted in-app advertising in free version; Premium ad-free app sales"; "Markup from selling in-app rewards that parents can allow children to redeem for a definable amount of points / task completions"; "Sale of aggregated unidentifiable data"; "Revenues from professionals for premium content displayed in private parent community".
Presentation choice: Included to show the gap between naming revenue streams and choosing one.
When it does not fit: Advertising or data sales in a children's product without stating how you meet the privacy rules that apply.
Whether each slide shows the free line, a price with its period, and a share of users who pay.
Example
Free line
Price and period
Paying share
Status
StuDocu
80% of content free
Yes: quarterly and yearly
50/50 among premium users only
Current
Meet5
Shown in the product flow
Yes: 6 and 12 months
Not stated
Current
Wunderlist
Described as a feature
Yes: monthly and yearly
Not stated
Current
LearnXYZ
Clear table
$4.99, no period
Not stated
Planned
Naviself
Not stated
Three prices, no period
30% (forecast)
Forecast
BoxCryptor
"Unlimited" implies a limit
By platform, term not stated
Not stated
Current, rises planned
Connected2me
Not stated
None
Not stated; unlabelled mix
Not stated
Irly
Not stated
None
Not stated
Proposed
Choreosity
Ads in free version
None
Not stated
Not stated
Key Takeaways
Say exactly what free users get and what makes someone pay.
Every price needs its period: per month, per year, one-off.
State the share of users who pay, and mark it as measured or forecast.
If annual plans are discounted, show both, as Meet5 and StuDocu do; the monthly equivalent should match the arithmetic.
Advertising revenue needs a basis: impressions, a rate, or a partner.
A list of four revenue streams with no priority reads as not yet decided.
Build your consumer app business model slide
Start from what a free user can and can't do.
Free line. What exactly do free users get, and which feature, limit or content sits behind payment?
Price. Amount, currency and billing period for each plan. One-off or recurring?
Payer share. What share of active users pays, over which period? Measured or forecast, and based on what?
Other revenue. Ads, in-app purchases, data: what is the basis (impressions, rate, partner) and is it live?
Priority. Which stream comes first? Put the others on a "later" line.
Copyable framework: Free: [what free users get]. Paid: [feature or limit] for $[price] per [period]. [X]% of active users pay ([measured in period] or [forecast, based on ...]). Later: [other stream].
After: Free: [core feature]. Premium: [paid feature] for $[X] per month or $[Y] per year. [X]% of monthly active users paid in [month]. Advertising to free users is planned for [period].
What improved: Our illustrative rewrite; all bracketed figures are placeholders, not company facts. It picks one stream, prices it with a period and leaves room for a measured paying share.
What this guide adds
The general business model guide covers naming who pays and how. The SaaS, marketplace and fintech guides cover subscriptions sold to businesses, commissions and transaction fees. This guide covers apps sold to individuals, where most users pay nothing: the free line, consumer prices and the paying share.
The consumer app traction guide covers downloads, active users and retention, which is where a measured paying share belongs once you have one.
Three things a freemium slide should show
The free line: what free users can do and the specific feature, limit or content that sits behind payment. LearnXYZ's table does this well.
The price: amount, currency and billing period for each plan. A price without a period can't be compared or multiplied.
The payer share: what share of users pays, over what period, and whether it is measured or planned. Only StuDocu and Naviself give one, and they measure different things.
How we read each slide
We quote the text on the slide images and describe diagrams from what is drawn. We have not checked company claims. None of these pages was in our stored image set, so we rendered each from the original deck file in our library; the pages shown are the ones quoted. Where a slide gives both a total and a per-month price, we checked the division.
Common mistakes
Price without a period. Say per month, per year or one-off.
No free line. Name the feature or limit that makes someone pay.
Wrong denominator. A split among paying or premium users is not a share of all users.
Forecast shown as fact. Mark planned paying shares as forecasts and give their basis.
Unlabelled percentages. Say what each percentage is a share of.
Stream list without priority. Say which stream comes first.
Diagnostic checklist
Shows what free users get and what is paid.
Gives each price with its currency and period.
States the share of users who pay, with its period and denominator.
Marks each stream as live or planned.
Gives a basis for advertising or other revenue.
Frequently asked questions
How do I show a freemium model on a pitch deck slide?
Show what free users get, what is paid, the price with its period, and the share of users who pay. StuDocu's slide shows a free line, quarterly and yearly prices and how premium users split between paying and uploading.
What if I don't have a conversion rate yet?
Label the paying share as a forecast and give its basis, such as a test or a comparable app. Naviself gives a 30% share for a year after launch but no basis, so an investor can't judge it.
How we chose these examples
Corpus: published pitch deck teardowns on StartupFundraising.com. Founder-uploaded private decks are excluded.
Selection (2026-09-26): we searched teardown text for consumer app decks (app, iOS, Android) mentioning freemium, in-app purchases, premium tiers or ad revenue with a business model or monetisation slide. 55 decks matched; we rendered 22 candidate pages (one deck file, Filestory, was missing) and read each.
Kept nine. Excluded: AudioMob p9 (advertising sold to businesses, not a consumer payment), Curious Hat p9 (app store prices, overlapping LearnXYZ and BoxCryptor), Mailburn p6 (competitor prices, not its own model), Peupil p9 (a list of community ad formats), CalYoga p3, Task.ly p7, Tiny Stories p15, Vusay p5, WealthyLife p5, Sqoop p5 and Mine p20 (not business model content on the page read), Duelo p10 (betting commissions, a different question). Pickle is used in the general business model guide.
Other pages of the Wunderlist, StuDocu, BoxCryptor, Connected2me and Choreosity decks appear in other guides; the pages here are different.
None of the chosen pages was in our stored image set; we rendered them from the original deck PDFs in our library and stored them with the existing slide-image workflow.
Review: slide images were checked on 2026-09-26 and matched to company, deck and page (editorial model review). No person has yet completed an editorial review of this page. We make no claim that any slide caused a fundraising outcome.