How AI startups show traction: weeks-old revenue curves, usage counts, customer outcomes and retention.
AI Traction Slide: Fast Revenue, Usage and Customer Results
AI startups often raise on traction measured in weeks, not years. Investors have also seen many AI products get fast trial sign-ups that don't turn into lasting revenue. This guide compares eight real AI traction slides, from a weekly revenue chart that starts on launch day to a six-month revenue chart with no dates.
TL;DR
Show paid revenue with dates, then one sign that it lasts. Stilta charts weekly revenue from launch and says about 25% is committed annually. Scale AI shows customers spending more each quarter (631% average net revenue retention). Usage counts like Leonardo's 606 million images show demand, not revenue. Customer results like Zingage's need the source and period.
AI traction slides from real pitch decks
Each example shows the slide above its analysis and links to the full teardown. Slides with dated, paid revenue and a sign it lasts come first. Claims are as shown on the slides; comments are ours.
Stilta traction slide — slide 2
Agentic AI software for patents.
Stilta deck, slide 2. Exact stored slide matched to this analysis.
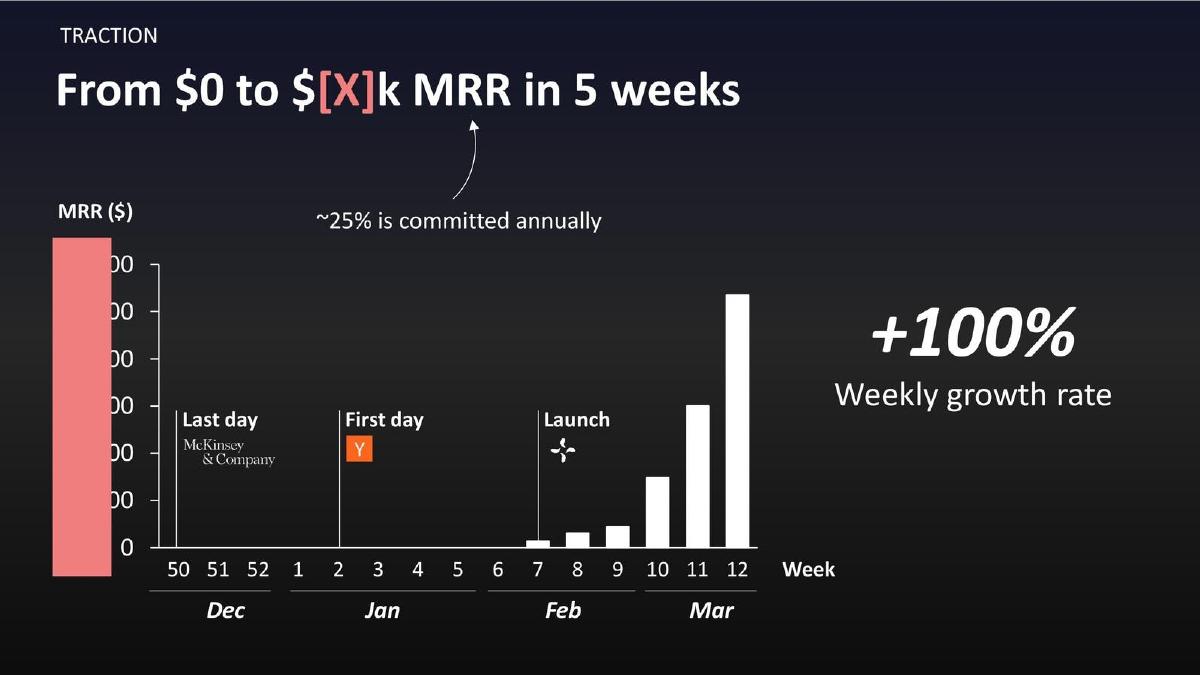
Our analysis: Dated revenue from launch, with commitment stated.
Evidence and limitation: Every bar sits on a dated week, the launch is marked, and it says how much revenue is committed annually. The dollar figures and axis labels are blanked in this version, and 'weekly growth rate' isn't defined (average over which weeks?).
What a founder can adapt: "$[X] MRR by [date], [N] weeks after launch; [Y]% on annual contracts."
Supporting analysis
What the deck claims: "From $0 to $[X]k MRR in 5 weeks." A weekly bar chart from week 50 (December) to week 12 (March), marking the founder's last day at McKinsey, first day at Y Combinator and launch. "~25% is committed annually." "+100% Weekly growth rate."
Presentation choice: Investors can see the curve starts at launch, not an arbitrary point.
When it does not fit: A growth rate without saying which weeks it averages.
Scale AI deck, slide 16. Exact stored slide matched to this analysis.
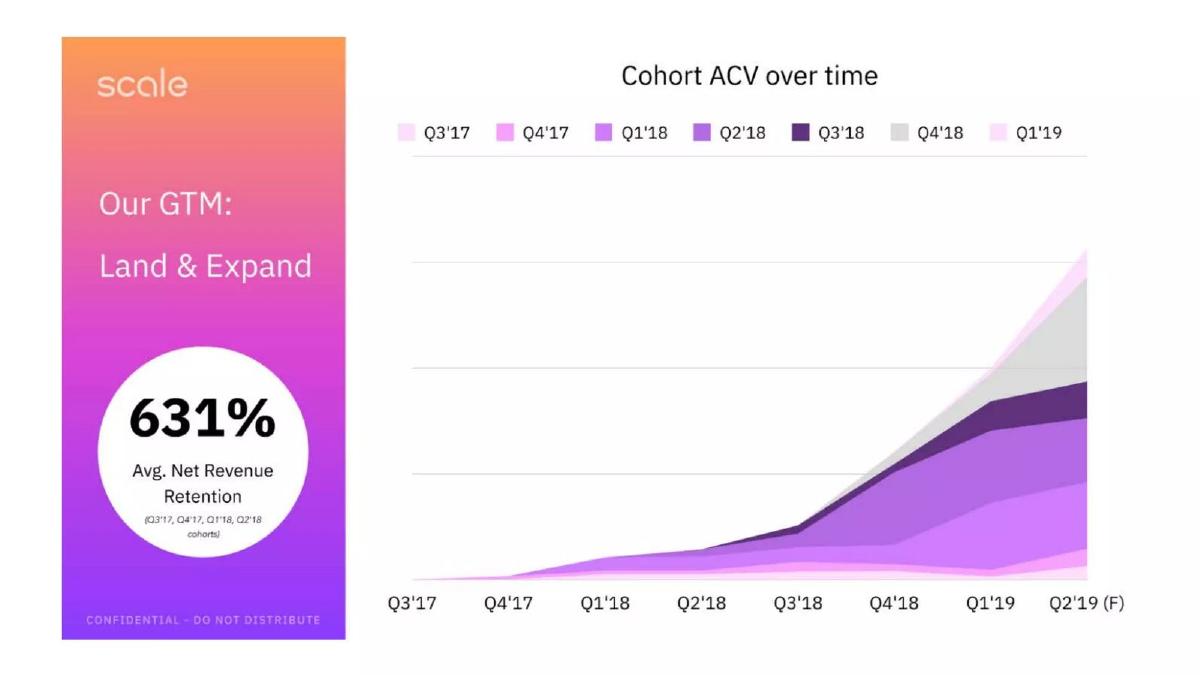
Our analysis: Expansion by named cohorts.
Evidence and limitation: It shows customers spending more over time, names which cohorts the average covers and labels the forecast quarter. The chart has no values on its axis, and it doesn't say how many customers are in each cohort.
What a founder can adapt: "[X]% net revenue retention for [cohorts], [N] customers."
Supporting analysis
What the deck claims: "Our GTM: Land & Expand." "631% Avg. Net Revenue Retention (Q3'17, Q4'17, Q1'18, Q2'18 cohorts)." A stacked "Cohort ACV over time" chart by quarterly cohort, Q3'17 to Q2'19, with the last quarter marked (F) for forecast.
Presentation choice: Answers "do AI customers stay and spend more?" directly.
When it does not fit: A retention average without the cohorts behind it.
Jeeva AI deck, slide 7. Exact stored slide matched to this analysis.
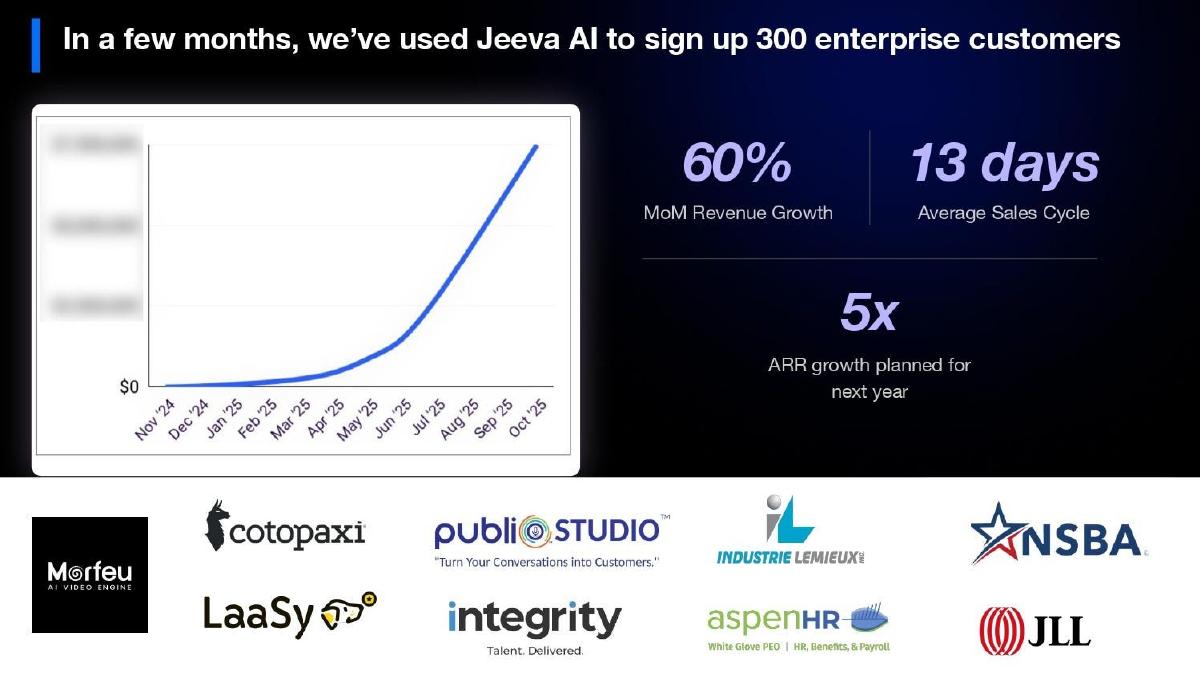
Our analysis: Dated curve plus sales speed.
Evidence and limitation: It dates the curve and adds a sales-cycle figure, which matters for AI tools sold to businesses. The revenue values are hidden, 'enterprise' isn't defined for 300 customers, and 5x is a plan, not a result.
What a founder can adapt: "[N] paying customers ([definition]); [X]% monthly growth, [period]; [Y]-day sales cycle."
Supporting analysis
What the deck claims: "In a few months, we've used Jeeva AI to sign up 300 enterprise customers." A revenue curve from Nov '24 to Oct '25 with the dollar axis blurred. "60% MoM Revenue Growth." "13 days Average Sales Cycle." "5x ARR growth planned for next year." Ten customer logos.
Presentation choice: A short sales cycle suggests buyers see value quickly.
When it does not fit: Mixing a plan (5x) into results without labelling it clearly.
Supernormal deck, slide 10. Exact stored slide matched to this analysis.
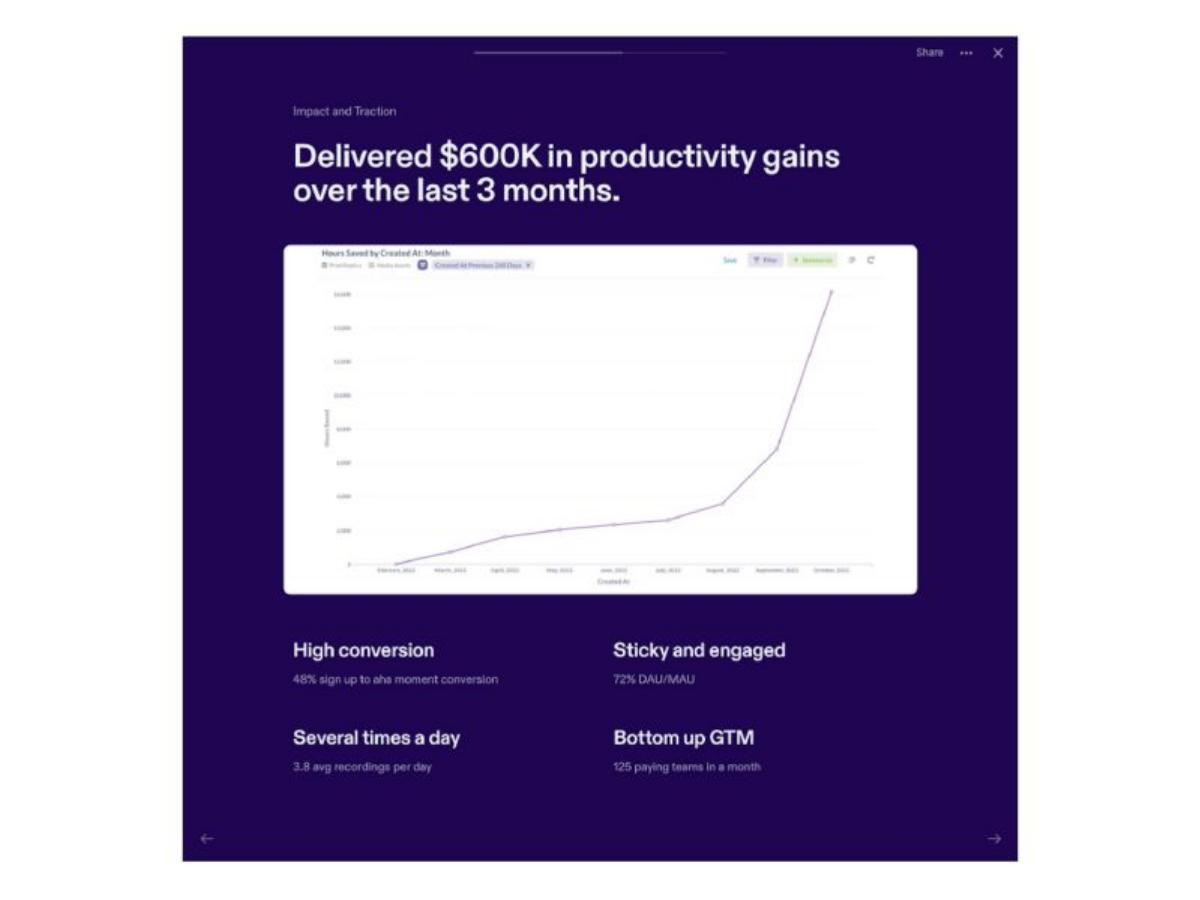
Our analysis: Usage depth plus an estimated value.
Evidence and limitation: It adds engagement measures (72% daily-to-monthly users, 3.8 recordings a day) that show people keep using it. The $600K headline is a value estimate, and the slide doesn't say how hours were turned into dollars.
What a founder can adapt: "[X]% DAU/MAU; [N] paying teams in [month]; value estimate: [method]."
Supporting analysis
What the deck claims: "Delivered $600K in productivity gains over the last 3 months." A chart of hours saved by month. "High conversion: 48% sign up to aha moment conversion." "Sticky and engaged: 72% DAU/MAU." "Several times a day: 3.8 avg recordings per day." "Bottom up GTM: 125 paying teams in a month."
Presentation choice: Daily use is the best early sign an AI tool isn't a novelty.
When it does not fit: A dollar value headline without the method.
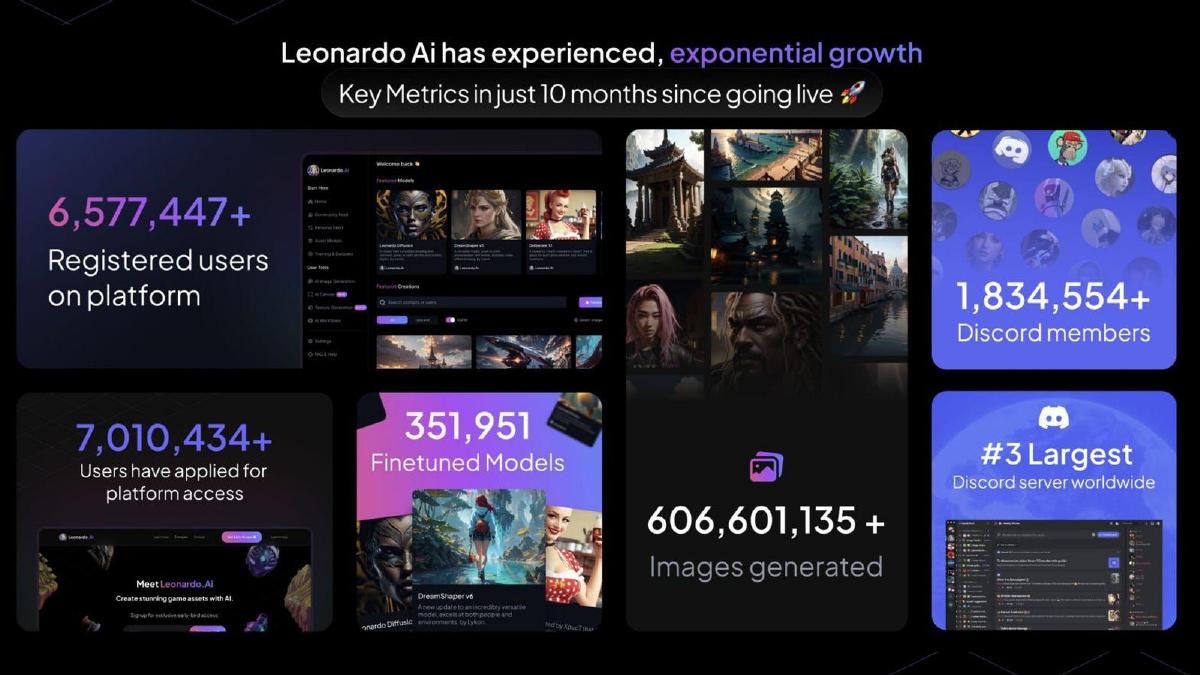
Leonardo.Ai deck, slide 2. Exact stored slide matched to this analysis.
Our analysis: Usage scale, no revenue.
Evidence and limitation: Exact counts over a stated 10 months show large demand. None is revenue or paying users, and registered users don't show how many stay active.
What a founder can adapt: "[N] registered, [M] monthly active, [P] paying, as of [date]."
Supporting analysis
What the deck claims: "Key Metrics in just 10 months since going live." "6,577,447+ Registered users on platform." "7,010,434+ Users have applied for platform access." "351,951 Finetuned Models." "606,601,135+ Images generated." "1,834,554+ Discord members." "#3 Largest Discord server worldwide."
Presentation choice: Strong for a consumer AI raise if revenue follows elsewhere in the deck.
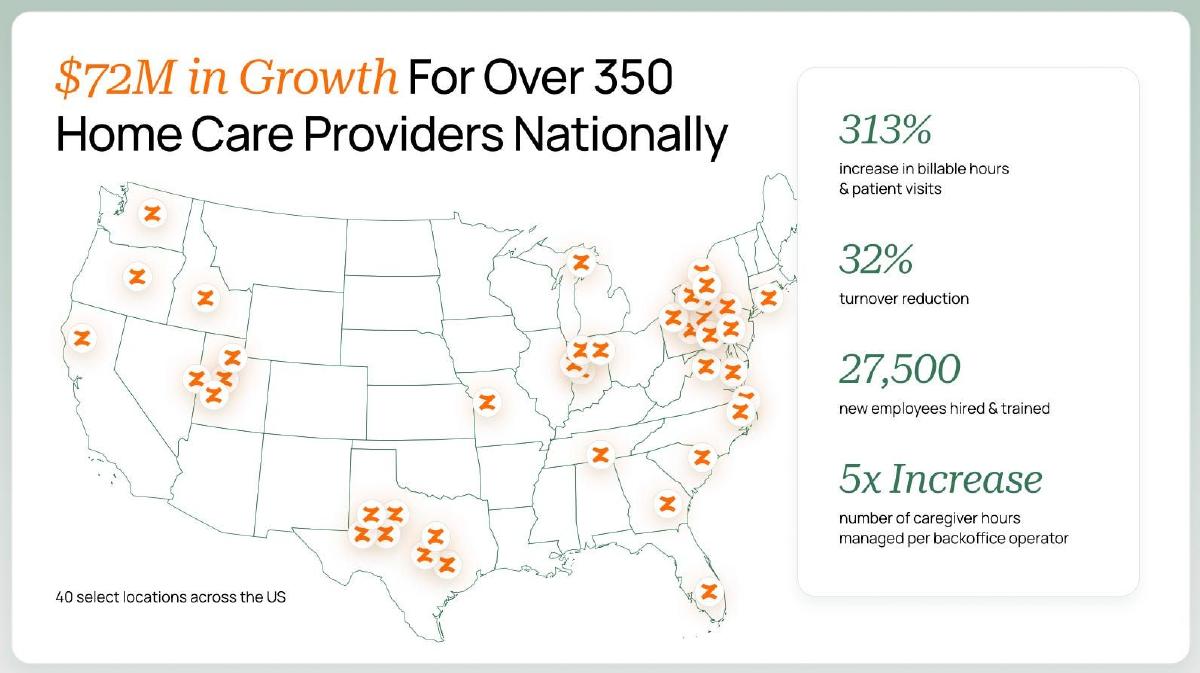
Zingage deck, slide 5. Exact stored slide matched to this analysis.
Our analysis: Customer results at scale.
Evidence and limitation: It counts customers (350+) and shows results in the buyer's terms. The slide doesn't say whose revenue the $72M is, over what period, or how the 313% and 32% were measured.
What a founder can adapt: "Customers' [metric] rose [X]% over [period] ([N] customers, measured by [source])."
Supporting analysis
What the deck claims: "$72M in Growth For Over 350 Home Care Providers Nationally." A US map with "40 select locations." "313% increase in billable hours & patient visits." "32% turnover reduction." "27,500 new employees hired & trained." "5x Increase number of caregiver hours managed per backoffice operator."
Presentation choice: Buyer outcomes are what AI tools for businesses are sold on.
When it does not fit: Outcome figures with no period or baseline.
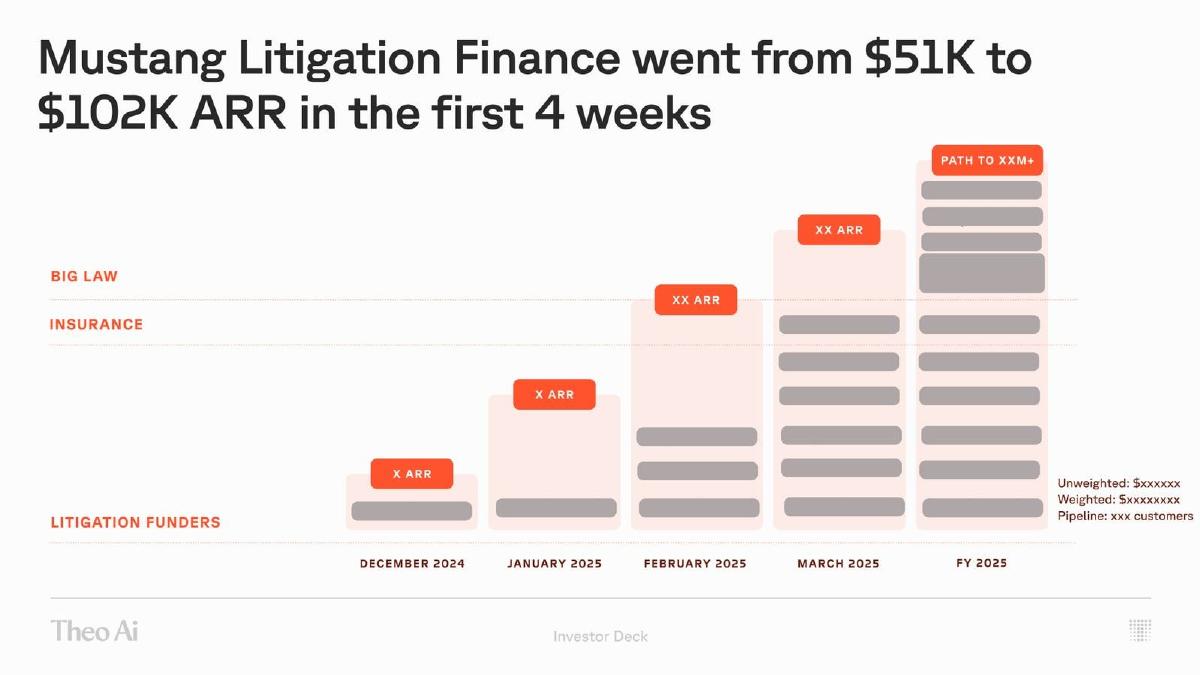
Theo Ai deck, slide 6. Exact stored slide matched to this analysis.
Our analysis: One named account; rest placeholders.
Evidence and limitation: It gives one named customer account with two figures. The headline doesn't make clear whether $51K–$102K is Theo's revenue from Mustang, and every other figure is blanked.
What a founder can adapt: "Our ARR from [customer] grew from $[X] to $[Y] in [period]."
Supporting analysis
What the deck claims: "Mustang Litigation Finance went from $51K to $102K ARR in the first 4 weeks." A monthly chart from December 2024 to FY 2025 with bars labelled "X ARR" and "XX ARR," rows for litigation funders, insurance and Big Law, "Path to XXM+," and "Unweighted: $xxxxxx, Weighted: $xxxxxxx, Pipeline: xxx customers."
Presentation choice: A real account helps, but the headline needs to say whose ARR.
When it does not fit: Ambiguous headlines and placeholder bars.
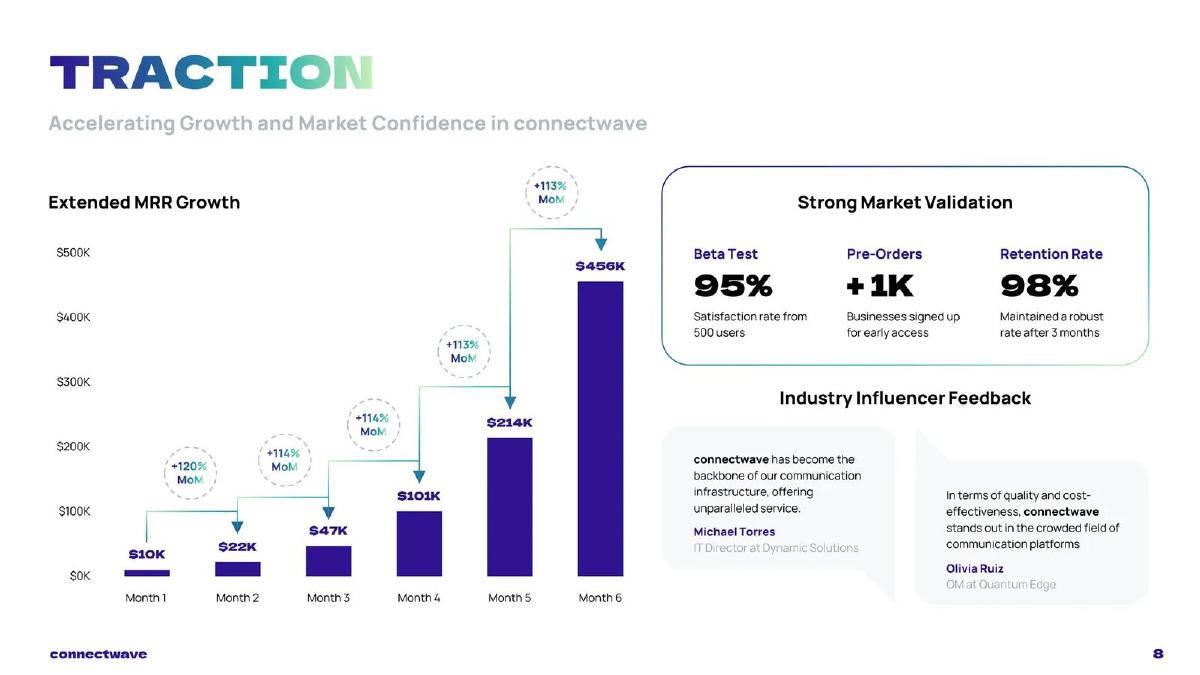
Connectwave deck, slide 8. Exact stored slide matched to this analysis.
Our analysis: Undated, undefined.
Evidence and limitation: Weaker example. Months have no dates, 'Extended MRR' isn't defined, and the slide doesn't say whether the figures are actual or projected. Early-access sign-ups are listed as pre-orders.
What a founder can adapt: "Actual MRR: $[X] ([month, year]) to $[Y] ([month, year])."
Supporting analysis
What the deck claims: "Extended MRR Growth": $10K, $22K, $47K, $101K, $214K, $456K across Month 1 to Month 6, each step labelled +113% to +120% MoM. "Beta Test 95% satisfaction rate from 500 users." "Pre-Orders +1K businesses signed up for early access." "Retention Rate 98% maintained a robust rate after 3 months." Two testimonials.
Presentation choice: Without dates and definitions investors can't tell results from plans.
When it does not fit: 'Month 1' labels and undefined revenue terms.
After: "Actual MRR: $[X] ([month, year]) to $[Y] ([month, year]); [Z]% on annual plans."
What improved: Our illustrative rewrite of Connectwave's chart; bracketed text is a placeholder, not company fact.
What's different about AI traction
AI products can reach revenue very quickly, so a short, steep chart is common. Investors then ask whether customers stay once the novelty wears off, and whether the revenue is committed or month-to-month trial spend. The strongest slides pair a fast curve with evidence it lasts: annual contracts, retention or customers expanding.
What investors check
Dates on the chart and whether the axis is readable. Whether 'users' means paying customers or sign-ups. Whether growth rates are measured over enough periods to mean something. Whether claimed customer gains say who measured them and over what time.
How we read each slide
We quote the text on the slide images. We have not checked any revenue, user count or customer result. None of these pages was in our stored image set, so we rendered each from the original deck file in our library.
Common mistakes
Undated months. Put the real month and year on every point.
Sign-ups as traction. Separate registered, active and paying.
Growth rate without period. Say which weeks or months it averages.
Plans mixed with results. Label forecasts clearly.
Unsourced outcomes. Give period, baseline and who measured.
Diagnostic checklist
Paid revenue with dates.
Committed share stated.
One retention, expansion or daily-use signal.
Every metric defined.
Frequently asked questions
What traction should an AI startup show?
Dated paid revenue, plus a sign it lasts. Stilta charts weekly revenue from launch and says about 25% is committed annually; Scale AI shows 631% average net revenue retention for named cohorts.
Are usage numbers enough for an AI startup?
They show demand but not revenue. Leonardo.Ai lists 606 million images generated and 6.5 million registered users in 10 months; pair counts like these with active and paying users.
How we chose these examples
Corpus: published pitch deck teardowns on StartupFundraising.com. Founder-uploaded private decks are excluded.
Selection (2026-09-26): we searched AI teardowns for traction, revenue and growth headings, rendered ten candidate decks with neighbouring pages, and kept eight.
Excluded: Daydream (used in the redacted-numbers guide) and Moritz (its chart showed no readable dollar values in our render).
None of the chosen pages was in our stored image set; we rendered them from the original deck PDFs and stored them with the existing slide-image workflow. All eight decks were confirmed as published teardowns on 2026-09-26.
Revenue, user counts and customer results are quoted from the slides and not independently verified.
Review: slide images were checked on 2026-09-26 and matched to company, deck and page (editorial model review). No person has yet completed an editorial review of this page. We make no claim that any slide caused a fundraising outcome.