Amplitude's abridged Series C deck from August 2017 is a concise exercise in market repositioning. With only 8 slides, the deck successfully moves the narrative away from legacy business intelligence and marketing tools toward a dedicated 'Product' analytics category. The deck relies heavily on a 'then vs. now' framework, illustrating how digital products have evolved from simple acquisition channels to the core of the business. While significant portions of the financial data and customer logos are redacted in this public version, the structural logic remains intact: identifying a $17B gap i…
Key takeaways
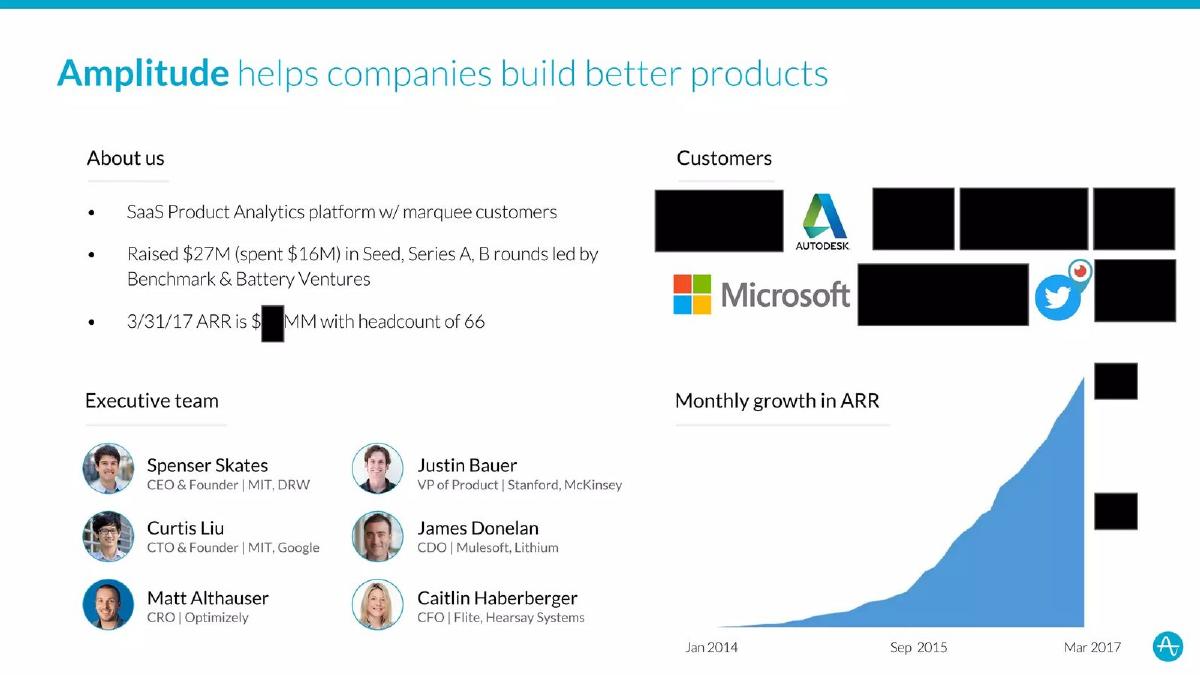
- The deck uses a 'Summary Slide' (Slide 2) early on to establish immediate credibility with team pedigree and high-level growth trends.
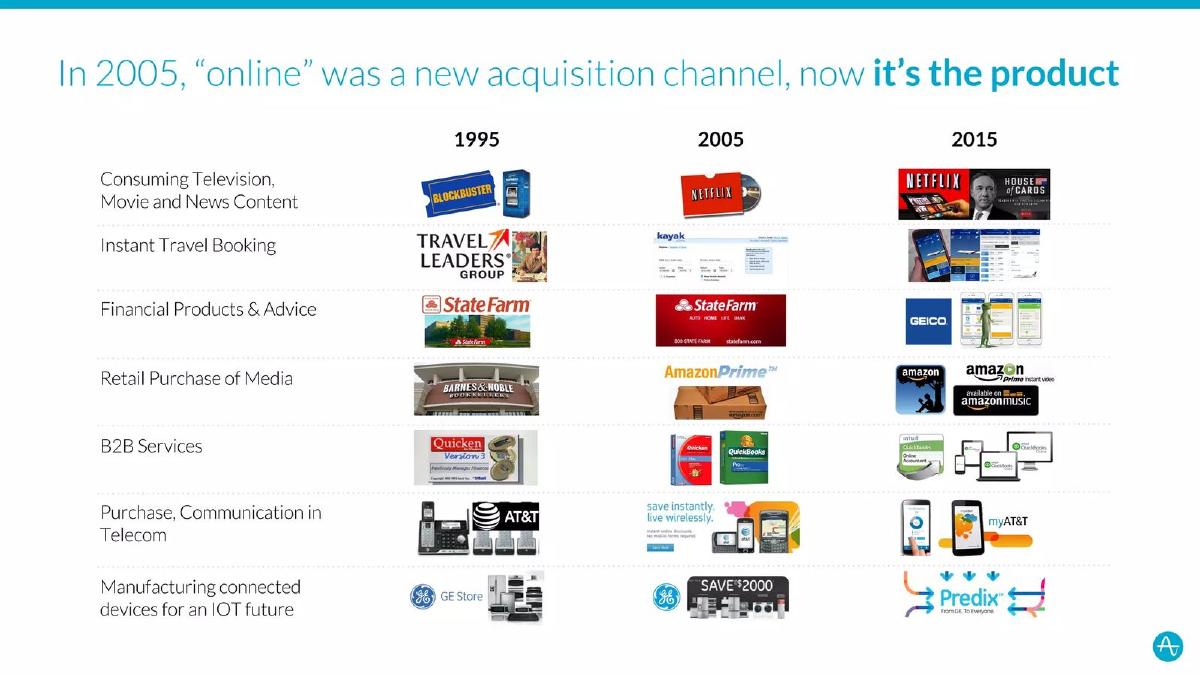
- Amplitude frames the market shift by showing how 'online' moved from an acquisition channel to the product itself between 1995 and 2015 (Slide 4).
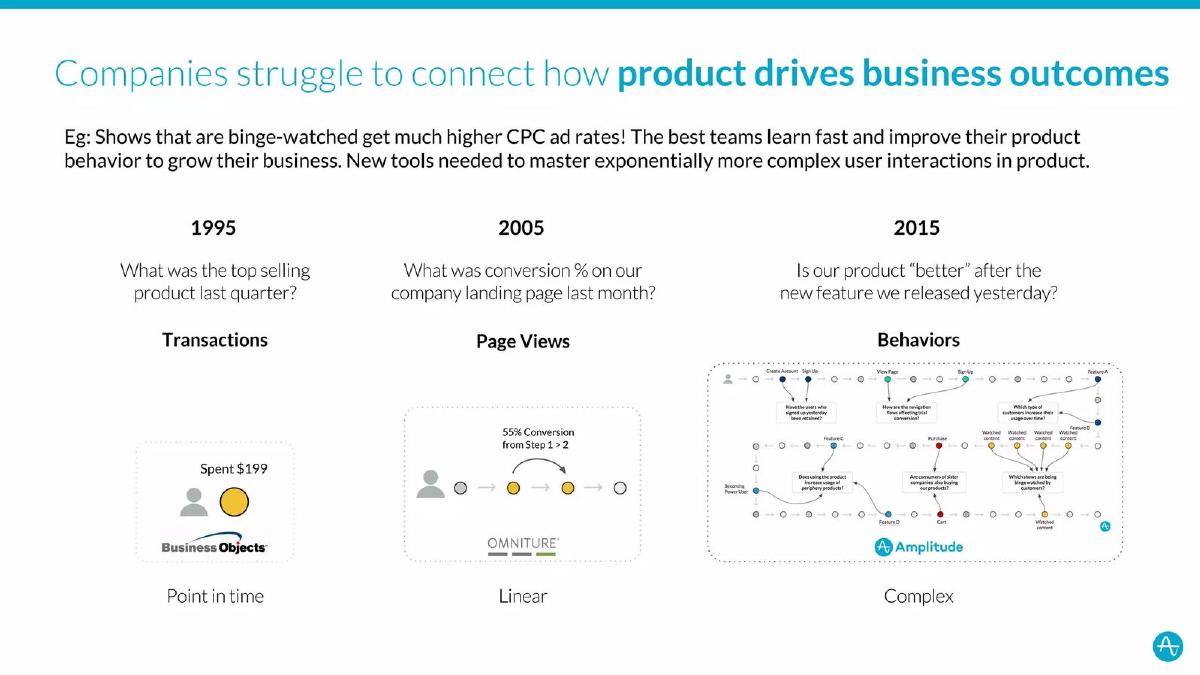
- The narrative categorizes the evolution of data from 'Transactions' to 'Page Views' to 'Behaviors,' positioning Amplitude as the leader of the third wave (Slide 5).
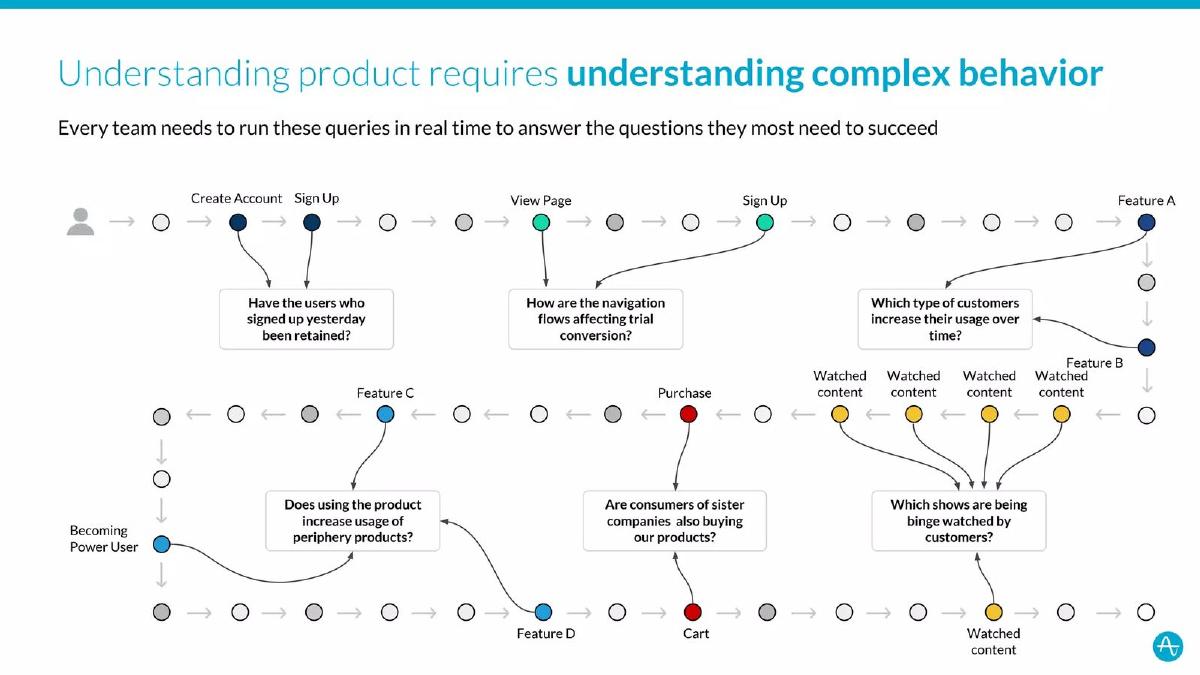
- A complex user journey map is used to visualize the specific questions legacy tools cannot answer, such as binge-watching correlations (Slide 6).
- The deck explicitly identifies a $17B analytics industry that fails to address product-specific needs (Slide 7).
- Market mapping (Slide 7) creates a 'Product' vacuum by showing crowded landscapes in BI, Marketing, and Engineering Infra, but an empty space for Product.
- Scale is proven through a single metric: 17.6 billion events processed in the last month as of May 2017 (Slide 8).
- The deck omits a specific 'Ask' or use of funds slide, likely due to its abridged nature for public viewing.
The Strategic Narrative of a Category Leader
The Amplitude Series C abridged deck from August 2017 is a masterclass in category creation. At this stage in a company's lifecycle, the goal is no longer just to prove that the product works, but to prove that the market is shifting in a way that makes the product inevitable. Amplitude does this by framing the 'digital product' as the new center of the corporate universe.
Slide 1: Title and Mission
The cover slide is minimalist, featuring the logo and the tagline: "Build Better Products." The date, August 2017, places this at a time when SaaS was maturing and the 'Product-Led Growth' movement was beginning to gain significant steam. The simplicity of the tagline suggests a broad, horizontal utility.
Slide 2: The Executive Summary and Momentum
Slide 2 serves as a 'traction at a glance' page. It lists the company as a "SaaS Product Analytics platform w/ marquee customers." Key financial history is disclosed: "Raised $27M (spent $16M) in Seed, Series A, B rounds led by Benchmark & Battery Ventures." This is a strong signal to Series C investors—it shows capital efficiency (only spending 60% of raised capital to reach this stage). The slide also notes a headcount of 66 as of 3/31/17. While the ARR figure is redacted, the "Monthly growth in ARR" chart shows a classic 'J-curve' starting from Jan 2014 and accelerating sharply through Mar 2017. The executive team section highlights pedigree from MIT, Google, Stanford, McKinsey, and Optimizely , establishing immediate professional credibility.
Slide 3: The Macro Thesis
Slide 3 is a single-sentence transition: "All companies are turning into digital product businesses." This is the 'Big Relevant Change' in the world. By underlining "All," Amplitude is signaling that their Total Addressable Market (TAM) is not just tech startups, but every legacy enterprise undergoing digital transformation.
Slide 4: The Historical Context
To prove the thesis of Slide 3, Slide 4 provides a visual timeline from 1995 to 2015 across various industries (Television, Travel, Finance, Retail, B2B, Telecom, and IOT). It illustrates the shift from physical or 'online-as-channel' to 'online-as-product.' For example, it shows Blockbuster (1995) moving to Netflix DVDs (2005) and finally to Netflix Streaming/Original Content (2015) . The takeaway is stated in the header: "In 2005, 'online' was a new acquisition channel, now it's the product."
Slide 5: The Analytics Gap
Slide 5 identifies the problem: "Companies struggle to connect how product drives business outcomes." It maps the evolution of data needs. In 1995, the focus was "Transactions" (Point in time). In 2005, it was "Page Views" (Linear). By 2015, the need shifted to "Behaviors" (Complex). It explicitly names legacy competitors like Business Objects (for transactions) and Omniture (for linear page views), positioning Amplitude as the only solution for the 'Complex' behavioral era.
Slide 6: Visualizing Complexity
Slide 6 dives deeper into what 'Complex Behavior' looks like. It features a sophisticated user journey map with various nodes representing actions like "Create Account," "View Page," "Feature A," and "Cart." The slide poses the questions that modern teams need to answer, such as: "Which shows are being binge watched by customers?" and "Does using the product increase usage of periphery products?" This slide moves the conversation from 'what happened' to 'why it happened' and 'what will happen next.'
Slide 7: The $17B Market Opportunity
This is the 'Competitive Landscape' slide, but it is framed as a market deficiency slide. It claims the "$17B analytics industry can't address these product needs." It shows three massive, crowded logos-capes for Business Intelligence, Marketing, and Engineering Infra . In the center, under the "Product" heading, there is a gap. The text argues that legacy tools are "slow," "can't do distributed realtime joins," or are "not user friendly." A small chart shows that the number of job postings for "Data Scientists" is skyrocketing, implying that companies are desperate for these insights but lack the tools to empower non-data scientists.
Slide 8: The Solution and Scale
The final slide in this abridged deck summarizes how Amplitude helps enterprise teams. It lists four pillars: Behavioral Layer, Rapid Collaboration, Massive Scalability, and Product Playbook . The scale is quantified with a specific metric: "Events last Month: 17.6 Billion" as of May 2, 2017. This number is intended to prove that the platform is enterprise-ready and can handle the 'massive problem' mentioned in the previous slide. The mention of a "Product Playbook" (a physical or digital book) suggests that Amplitude isn't just selling software, but a methodology for growth.
What Works in this Deck
The 'Then vs. Now' Framework: By anchoring the pitch in a 20-year historical shift, Amplitude makes their product feel like an inevitable evolution rather than a niche tool. · Capital Efficiency: Disclosing that they only spent $16M of $27M raised while showing an accelerating growth curve is a powerful signal of a healthy business model. · Category Positioning: Instead of fighting for a piece of the 'Marketing Analytics' pie, they created a new 'Product' pie and showed why the other pies were insufficient. · Visualizing the Problem: The user journey map on Slide 6 is excellent because it makes the abstract concept of 'complex behavior' tangible and shows exactly what a user would be missing without the tool.
What is Missing
Unit Economics: There is no mention of LTV (Lifetime Value), CAC (Customer Acquisition Cost), or Churn rates. For a Series C, these are usually mandatory. · The 'Ask': Being an abridged version, the specific funding goal and the plan for that capital are absent. · Detailed Roadmap: The deck focuses heavily on what the product does now and why the market needs it, but it doesn't show where the product is going in the next 3-5 years. · Customer Case Studies: While logos are mentioned (and some redacted), there are no specific 'before and after' success stories showing how a customer increased a specific business outcome using Amplitude.
Founder Takeaways
1. Sell the Shift, Not the Feature: Amplitude spends more time talking about how the world has changed (Slides 3, 4, and 5) than they do talking about their specific features. Founders should ensure they are solving a problem that is growing in importance due to macro trends.
2. Use 'White Space' to Define Competition: If you are in a crowded market, don't just list your competitors. Group them into categories and show the 'hole' in the market that you fill. Slide 7 is a perfect example of how to make a crowded market look like an opportunity for a new entrant.
3. Quantify Scale Early: Even if you can't share revenue, share 'system volume.' Amplitude's '17.6 Billion events' metric provides a sense of gravity and technical prowess that revenue alone might not convey.
4. Pedigree and Efficiency: If you have a strong team and have been smart with your cash, put that front and center. Investors at the later stages are looking for teams they can trust with large checks; showing that you haven't wasted your previous rounds is a great way to build that trust.
Frequently asked questions
- What is the primary narrative hook used in the Amplitude deck?
- The primary hook is the transition of companies into 'digital product businesses.' Amplitude argues that while companies used to use the internet just to sell things (transactions), the digital experience is now the product itself. This shift requires a new type of analytics—behavioral analytics—that legacy tools designed for page views or sales records cannot provide.
- How does Amplitude handle the competitive landscape?
- Instead of a standard feature-comparison grid, Amplitude uses a category map on Slide 7. They show three crowded boxes: Business Intelligence, Marketing, and Engineering Infrastructure. They then place a 'Product' category in the center with a visual of a team, implying that while other sectors are over-served, the most critical part of the modern business is currently a vacuum.
- What specific metrics are highlighted despite the redactions?
- Slide 2 notes that the company had raised $27M and spent $16M across its Seed, Series A, and Series B rounds. It also mentions a headcount of 66 as of March 2017. Slide 8 highlights their processing scale, citing '17.6 Billion' events handled in the month of May 2017.
- Why is the 'Behavioral Layer' emphasized over features?
- Amplitude focuses on the 'Behavioral Layer' to differentiate from 'Linear' analytics. By showing a complex web of user actions (Slide 6), they demonstrate that product success isn't about a single click, but about how different features (like binge-watching) correlate to long-term business outcomes like retention and cross-buying.
- What is missing from this abridged version of the deck?
- This version lacks a detailed financial breakdown, a specific 'Ask' (amount being raised), a roadmap, and a deep dive into unit economics (CAC/LTV). It also redacts several major customer logos and the specific ARR figures, focusing instead on the 'shape' of the growth curve and the strategic narrative.