Optimity’s 12-slide deck is a masterclass in brevity and metric-led storytelling for the B2B wellness space. By identifying a specific market gap—the 'middle majority' who are neither super-fit nor chronically ill—Optimity positions itself as a high-engagement alternative to traditional programs. The deck highlights a 77% participation rate across 3,000+ users, dwarfing the 10% industry average. Financial traction is demonstrated through a growth chart showing a rise from $13,846 in Q2 2016 to $342K ARR by Q2 2017. While the deck lacks a formal 'Ask' slide or detailed unit economics, it compe…
Key takeaways
- The deck identifies a $1.1 trillion problem for employers regarding health costs on slide 3.
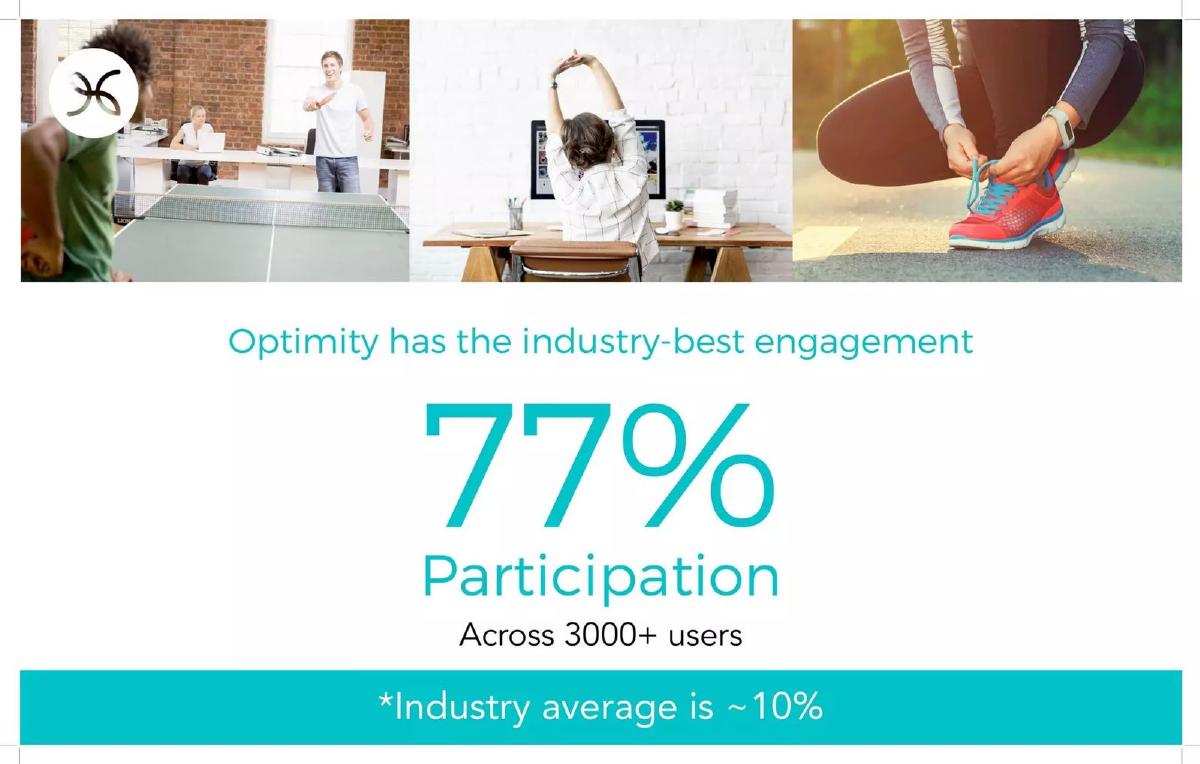
- Optimity claims a 77% participation rate across 3,000+ users, significantly higher than the 10% industry average cited on slide 5.
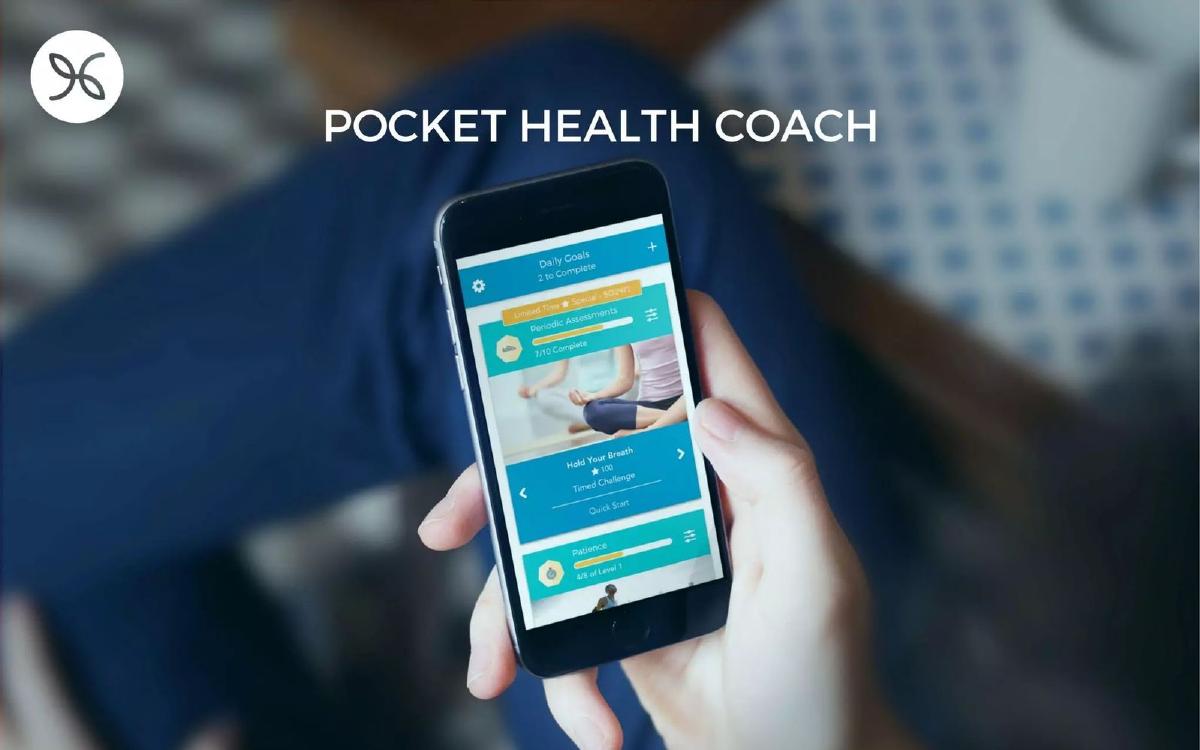
- The product is positioned as a 'Pocket Health Coach' using micro-activities to reduce medication usage as shown on slides 6 and 7.
- Revenue grew from $13,846 in Q2 2016 to a projected $342K ARR by mid-2017, according to slide 10.
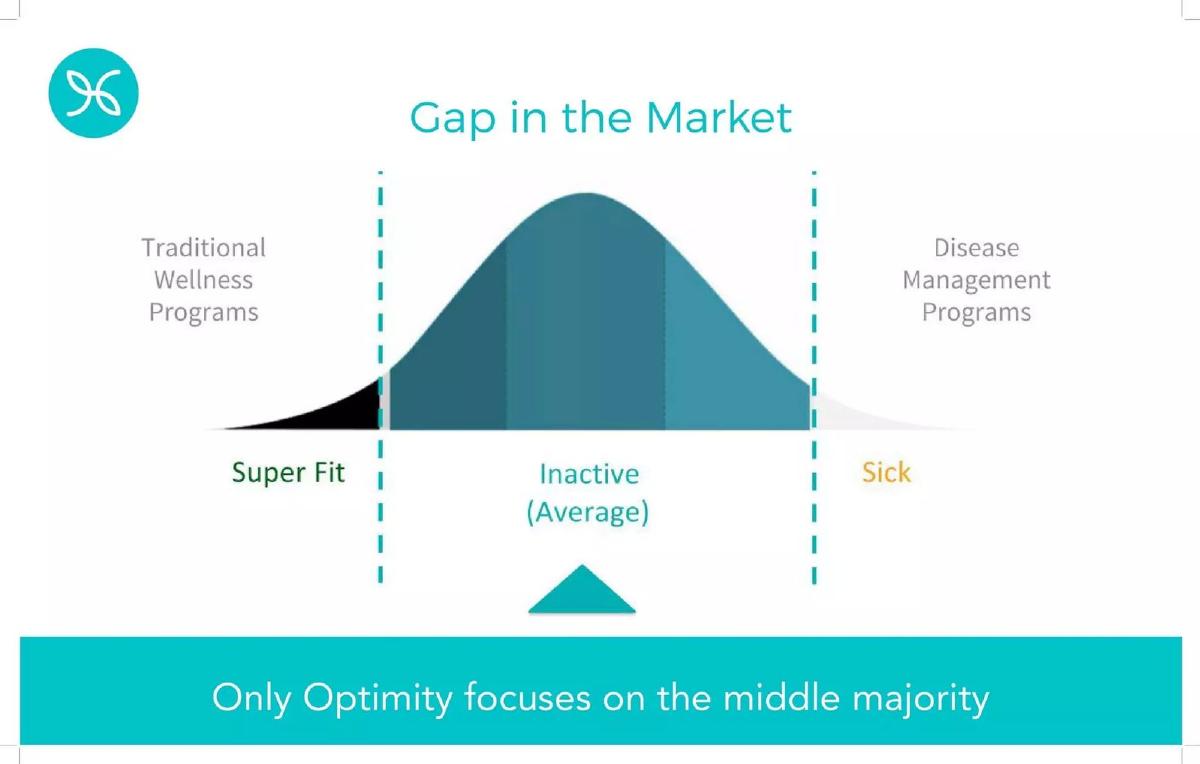
- The company targets the 'middle majority' of employees, avoiding the extremes of 'Super Fit' or 'Sick' populations on slide 4.
- Social proof is established through logos of major clients including PwC, Microsoft, and KPMG on slide 10.
- ROI claims are backed by Sun Life Financial and Insurance Research Labs on slide 9.
- The team slide (11) showcases experience from IMS Health, TD Bank, and AMD.
The Optimity Pitch Deck: Engaging the Middle Majority
Optimity’s Series A pitch deck, used in 2014 to raise $5,000,000, is a lean 12-slide presentation that focuses heavily on user engagement and enterprise validation. In a crowded corporate wellness market, Optimity attempts to differentiate itself by moving away from 'all-or-nothing' health programs and focusing on incremental, data-driven behavior changes. The deck relies on a clean aesthetic and high-level metrics to build a case for scalability within the B2B insurtech and HR tech sectors.
Slides 1-2: The Hook and Product Overview
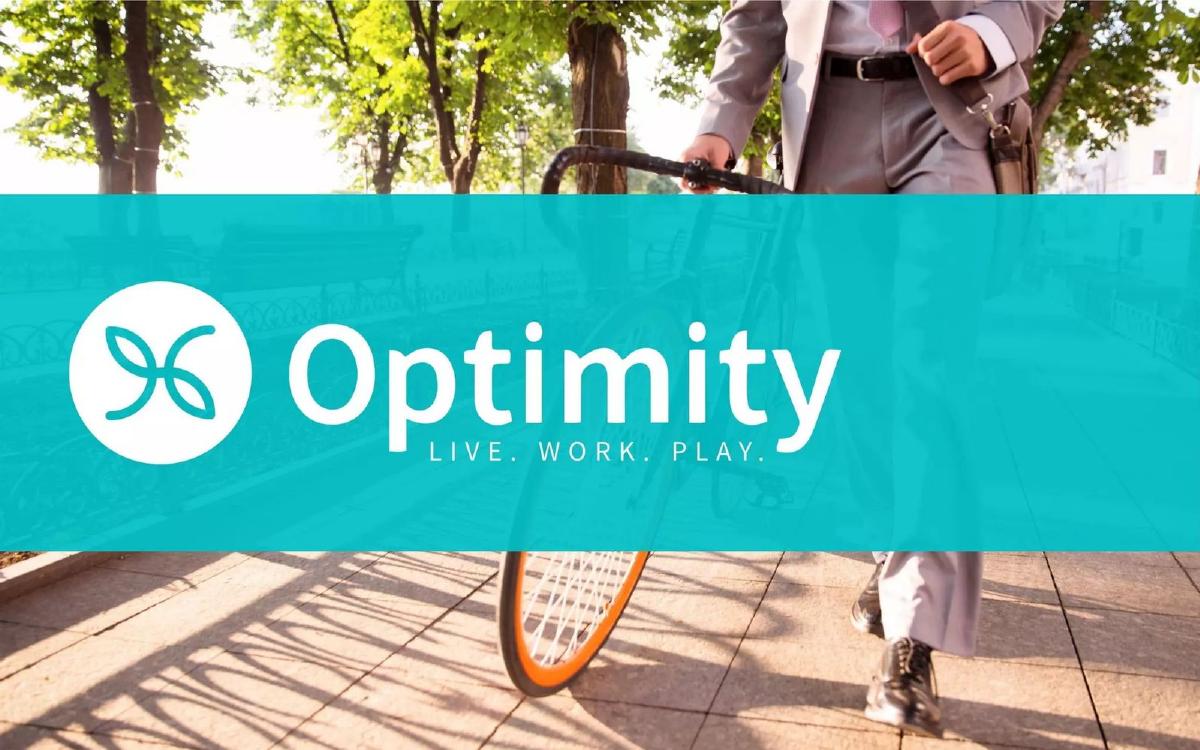
Slide 1 serves as the title card, featuring the company logo and the tagline "LIVE. WORK. PLAY." against a lifestyle image of a professional with a bicycle. This immediately sets a tone of active, modern living rather than clinical healthcare.
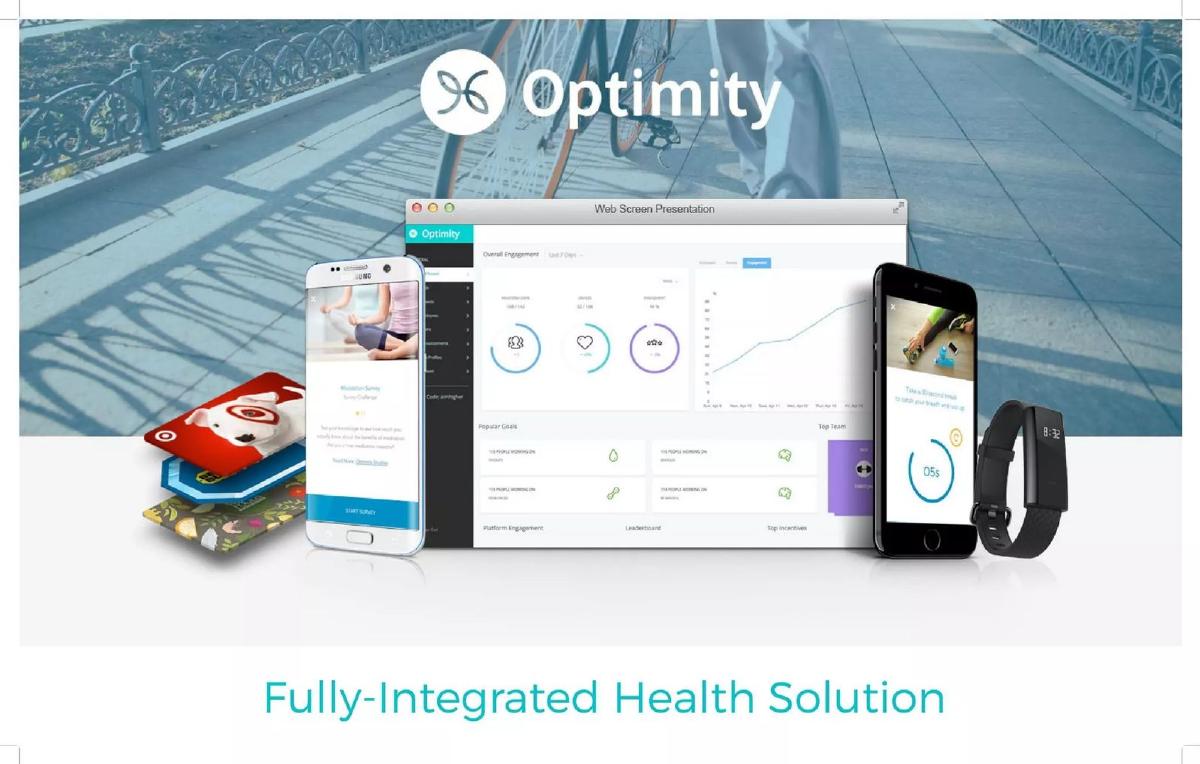
Slide 2 provides a visual summary of the "Fully-Integrated Health Solution." It displays the product ecosystem: a mobile app showing a meditation survey, a web-based admin dashboard with engagement analytics, and integrations with wearable devices and rewards (represented by a Target gift card). This slide effectively communicates that Optimity is a multi-platform SaaS tool designed for both the end-user (employee) and the administrator (employer).
Slides 3-5: The Problem and Market Gap
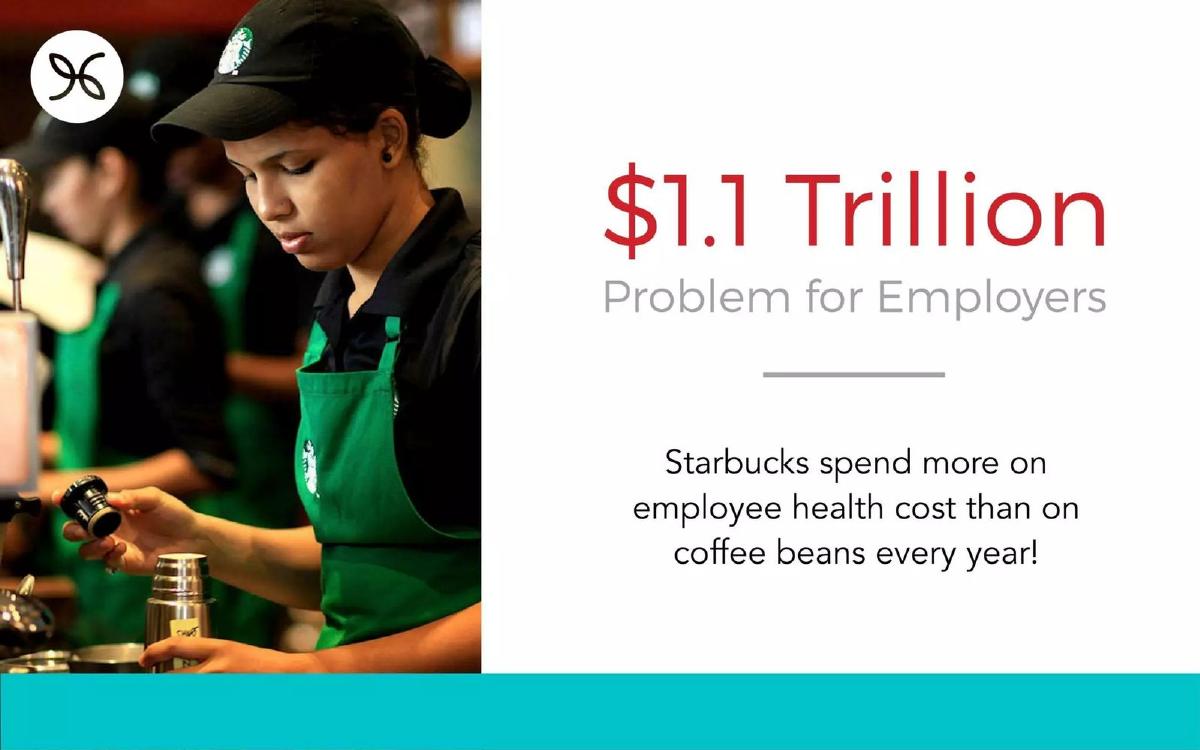
Slide 3 introduces the macro problem: a "$1.1 Trillion Problem for Employers." To make this number relatable, the slide includes a specific anecdote: "Starbucks spend more on employee health cost than on coffee beans every year!" This is a classic pitch deck technique—using a well-known brand to illustrate the scale of a pain point.
Slide 4 identifies the "Gap in the Market." Using a bell curve, Optimity argues that traditional wellness programs only serve the "Super Fit," while disease management programs only serve the "Sick." Optimity claims to be the only solution focusing on the "middle majority"—the inactive, average employees who represent the bulk of an employer's workforce and potential cost savings. This is the deck's strongest strategic positioning.
Slide 5 backs up this positioning with a standout metric: "77% Participation Across 3000+ users." By contrasting this against a "~10%" industry average, Optimity positions its engagement rate as its primary competitive advantage. The slide uses large, bold typography to ensure this number is the focal point of the presentation.
Slides 6-7: The Solution and Data Personalization
Slide 6 describes the app as a "POCKET HEALTH COACH," showing a mobile interface with daily goals, periodic assessments, and timed challenges. The UI suggests a gamified experience, which aligns with the high engagement claims made previously.
Slide 7 delves into "Data-Driven Personalization." It introduces the concept of "Microactivities"—adaptive, personalized tasks designed to reduce medication usage. By linking behavioral nudges to clinical outcomes (medication reduction), Optimity moves the conversation from 'perk' to 'healthcare intervention.'
Slides 8-9: Proof of ROI
Slide 8 is a simple transition slide titled "PROVEN COST SAVINGS," leading into the evidence of financial impact.
Slide 9 focuses on "ROI Insurer Backed." It explicitly states that their claims analysis is supported by "Insurance Research Labs" and features the Sun Life Financial logo. For a Series A startup, having a major insurer validate the return on investment is a critical piece of social proof that de-risks the investment for VCs.
Slide 10: Traction and Client Logos
Slide 10 presents the financial growth of the company. It shows a quarterly revenue bar chart from Q2 2016 to Q2 2017. The figures are exact: $13,846 in Q2 2016, growing to $150,984 "so far" in Q2 2017. The slide concludes with a headline figure of "$342K ARR." To the right of the chart, the deck displays logos for PwC, Microsoft, and KPMG, indicating that Optimity has successfully penetrated the enterprise market with blue-chip professional services firms.
Slides 11-12: Team and Contact
Slide 11 introduces the leadership team. CEO Jane Wang is highlighted with experience from IMS Health and Biogen Idec. Nicholas Raditsis (VP Client Success) is linked to TD Bank and CPS Management Partners. Stephan Massin (CTO) is shown with logos for AMD and ATI. The team is presented as a mix of healthcare industry expertise and enterprise technology experience.
Slide 12 is the closing slide, providing contact information for Jane Wang and a link to the company's AngelList profile. It repeats the tagline "Live. Work. Play. Better with Optimity."
What Works in the Optimity Deck
The Engagement Delta: The most compelling part of this deck is the direct comparison between Optimity's 77% participation rate and the 10% industry average on slide 5. In the HR tech space, low adoption is the primary reason for churn. By proving they have solved the engagement problem, Optimity makes a strong case for its product's stickiness.
Relatable Problem Scaling: Using the Starbucks coffee bean anecdote on slide 3 is an excellent way to frame a trillion-dollar problem. It takes an abstract, massive number and turns it into a concrete business reality that any executive or investor can understand.
Third-Party Validation: Slide 9 is crucial. Startups often claim ROI, but having that ROI "Insurer Backed" by a name like Sun Life Financial provides a level of credibility that internal metrics cannot match. This is particularly important for a Series A raise where the business model is being tested for institutional scalability.
What is Missing from the Optimity Deck
The Funding Ask: The most glaring omission is a slide detailing the fundraise. There is no mention of how much capital is being sought, what the valuation expectations are, or how the $5 million will be allocated across hiring, marketing, or R&D. This information is standard for a Series A pitch.
Competitive Landscape: While slide 4 identifies a gap in the market, the deck does not name or analyze direct competitors. Investors would likely want to see how Optimity stacks up against other digital health platforms or incumbent wellness providers beyond just a general bell curve.
Unit Economics: The deck shows revenue growth but omits unit economics. There is no data on Customer Acquisition Cost (CAC), Lifetime Value (LTV), or the length of the sales cycle for these large enterprise clients. Given the high-profile nature of their clients (Microsoft, KPMG), understanding the cost to close these deals is vital for assessing the company's path to profitability.
What a Founder Should Copy
The 'Middle Majority' Strategy: Founders should look at slide 4 as a template for market positioning. Instead of trying to be everything to everyone, Optimity identifies a specific segment of the population (the 60-70% in the middle of the health spectrum) that is being ignored by existing solutions. This makes their market entry feel surgical rather than speculative.
Metric-First Design: The deck does not bury its best numbers in paragraphs of text. The 77% engagement rate and the $342K ARR are the largest elements on their respective slides. Founders should ensure their 'hero metrics' are impossible to miss during a quick flip-through.
Logo Placement for Social Proof: Optimity places its most impressive client logos (Microsoft, PwC) directly next to its revenue growth chart. This creates a psychological link between the financial traction and the quality of the customer base, suggesting that the revenue is high-quality and recurring.
Final Analysis
Optimity’s deck is a highly focused document that prioritizes proof of concept over comprehensive business planning. It succeeds in proving that the product works (engagement) and that the market wants it (enterprise clients). However, it leaves significant questions regarding the mechanics of the business—specifically how it will use new capital to maintain its growth trajectory. For a Series A, this deck acts more as a high-level teaser to secure a meeting rather than a standalone investment memorandum.
Frequently asked questions
- What is Optimity's core value proposition for employers?
- Optimity addresses the $1.1 trillion health cost burden by engaging the 'middle majority' of employees who are typically underserved by traditional wellness or disease management programs. By using a 'Pocket Health Coach' and data-driven micro-activities, they aim to reduce medication usage and improve overall population health, leading to proven cost savings for the employer.
- How does Optimity's engagement compare to the rest of the industry?
- According to slide 5, Optimity achieves a 77% participation rate across its user base of over 3,000 people. The deck contrasts this directly with an industry average of approximately 10%. This high engagement is the primary differentiator used to justify their 'industry-best' status and the effectiveness of their gamified approach.
- What evidence of financial traction does the deck provide?
- Slide 10 displays a quarterly growth chart starting in Q2 2016 with $13,846 in revenue. By Q2 2017, the company reported $150,984 'so far' for the quarter, culminating in a stated $342K ARR. This trajectory is supported by a list of high-profile enterprise clients including Microsoft, PwC, and KPMG.
- Who are the key members of the Optimity leadership team?
- The team is led by CEO Jane Wang, who has a background at IMS Health and Biogen Idec. Nicholas Raditsis serves as VP of Client Success with experience from TD Bank and CPS Management Partners. The technical side is led by CTO Stephan Massin, who brings experience from AMD and ATI.
- What critical information is missing from this pitch deck?
- The deck is missing several standard Series A components. There is no 'Ask' slide detailing how much capital is being raised or how it will be spent. It also lacks a competitive landscape analysis, a detailed breakdown of unit economics (LTV/CAC), and a long-term product roadmap or vision beyond the current mobile app.