Amperity’s 5-slide deck from their 2021 Series D round is a study in brevity and high-level enterprise positioning. Rather than a traditional narrative arc, this deck functions as a data-heavy validation of the Customer Data Platform (CDP) market. It highlights a massive leap in managed data—from 1 TB in 2016 to 5,000 TB in 2021—and positions the company at the center of the 'Cookiepocalypse.' By focusing on the complexity of the customer journey and the inefficiency of current enterprise data usage (only 11% of enterprises use unified profiles effectively), Amperity builds a case for a missi…
Key takeaways
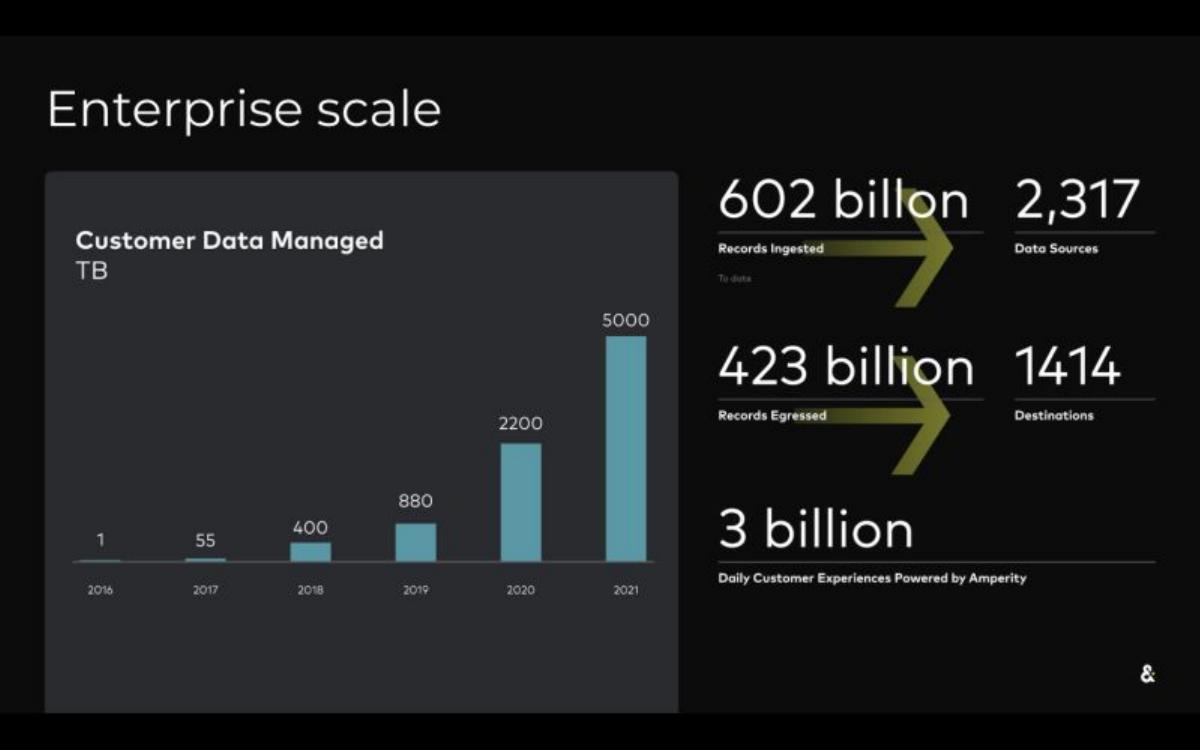
- The deck demonstrates exponential growth in data management, scaling from 1 TB in 2016 to 5,000 TB in 2021 (Slide 3).
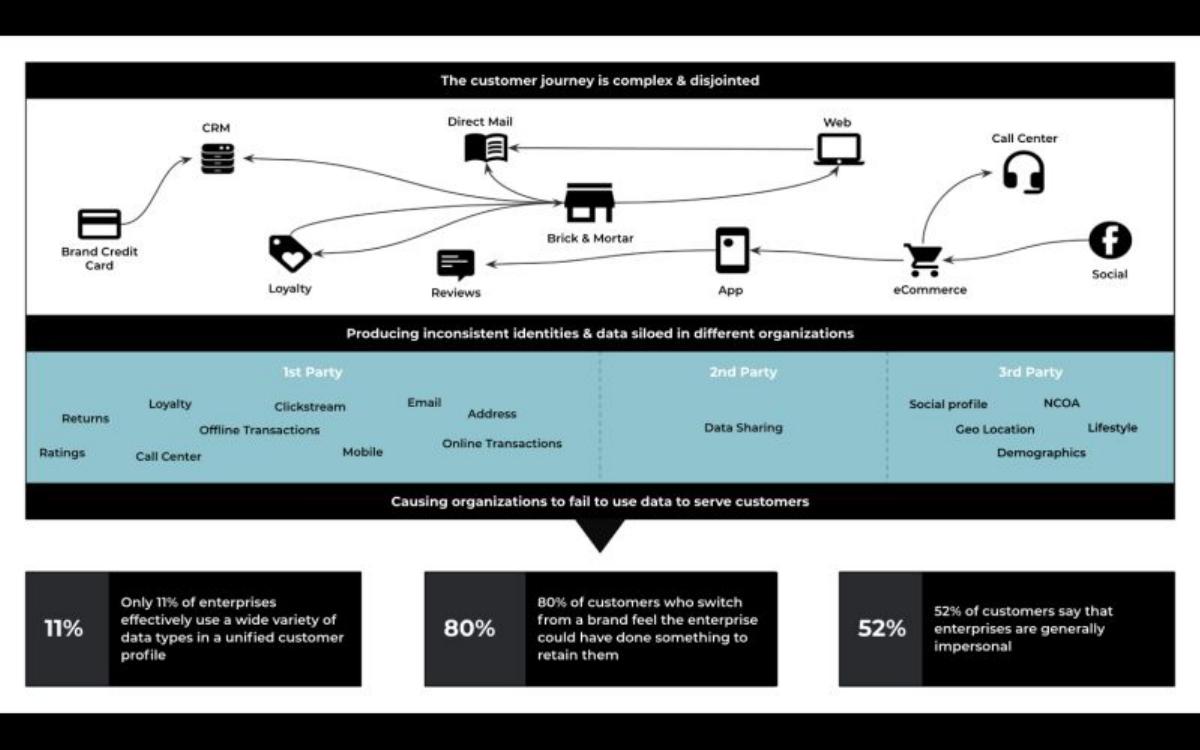
- Amperity identifies a massive execution gap, noting that only 11% of enterprises effectively use unified customer profiles (Slide 2).
- The platform's scale is validated by the ingestion of 602 billion records and 423 billion records egressed to date (Slide 3).
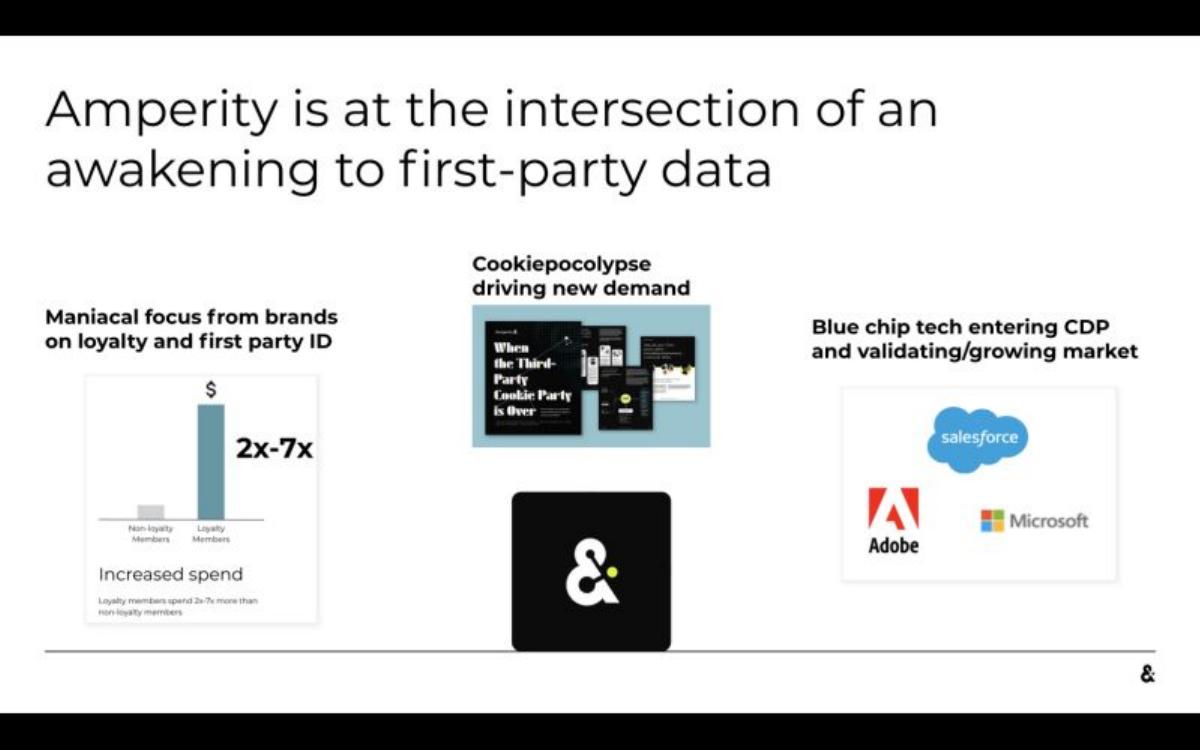
- Market tailwinds are anchored in the 'Cookiepocalypse' and the resulting shift toward first-party data (Slide 5).
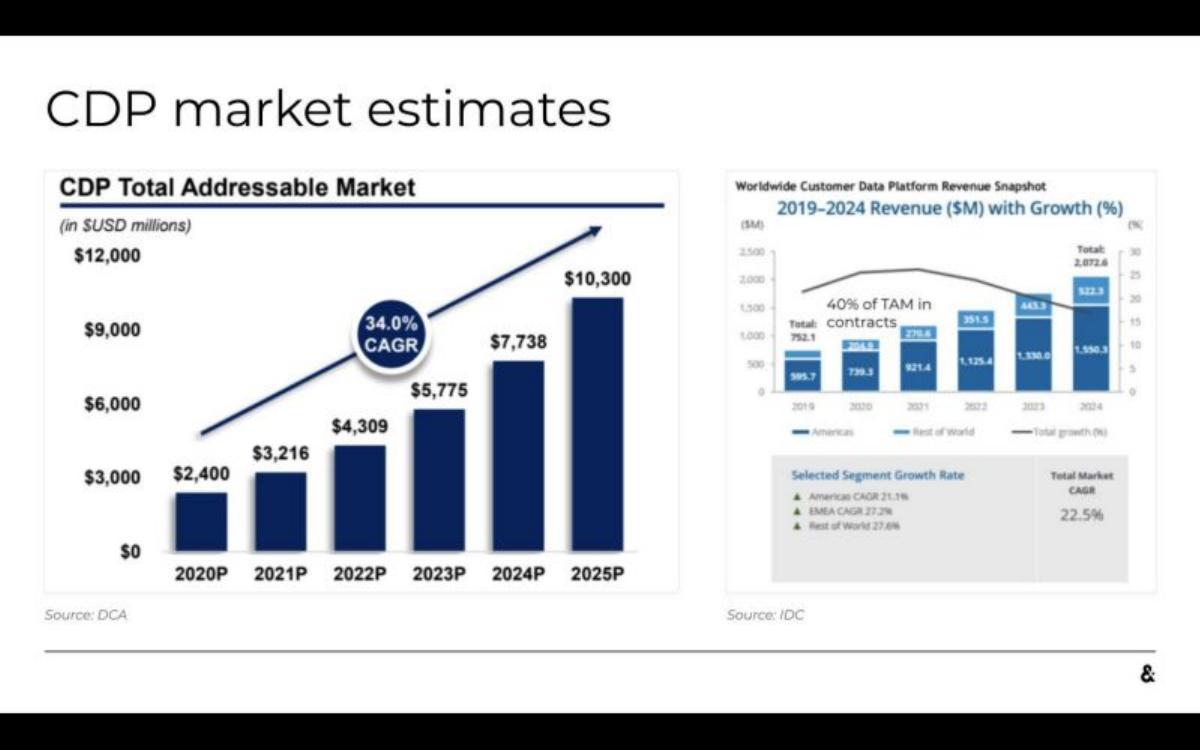
- The CDP market is projected to reach $10.3 billion by 2025 with a 34.0% CAGR, providing a strong macro-economic backdrop (Slide 4).
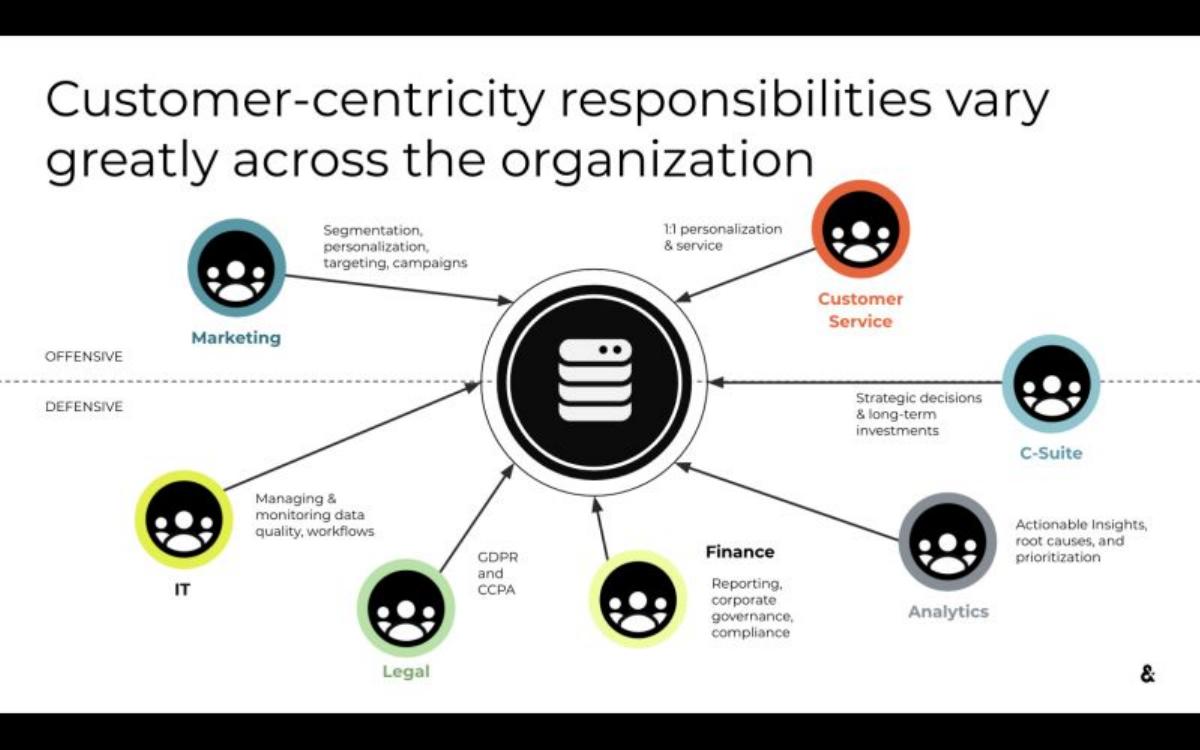
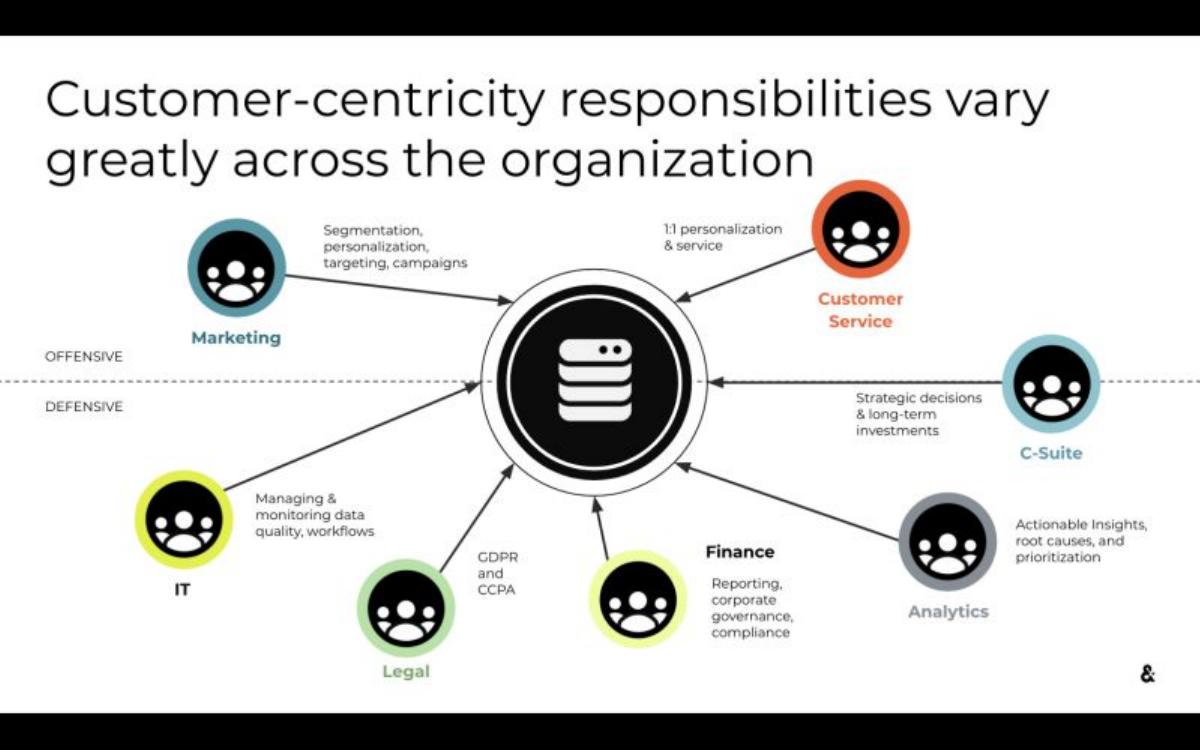
- The deck highlights the internal friction of data management, dividing responsibilities into 'Offensive' (Marketing, Service) and 'Defensive' (IT, Legal, Finance) categories (Slide 1).
- Customer experience is the primary driver, with 80% of customers feeling brands could have done more to retain them (Slide 2).
- Competitive validation is framed through 'Blue chip tech' like Salesforce, Adobe, and Microsoft entering the space (Slide 5).
The High-Level Strategy of a Series D Teaser
Amperity’s 2021 Series D deck is not a traditional pitch. At five slides, it functions as a high-velocity validation tool designed to confirm a lead investor's thesis rather than introduce the company from scratch. By the time a company reaches a $100M Series D, the 'how' of the product is often less important than the 'scale' of the impact. Amperity leans heavily into the latter, using massive numbers to dwarf any concerns about technical execution.
Slide 1: The Organizational Friction of Data
The deck opens with a slide titled "Customer-centricity responsibilities vary greatly across the organization." This slide is a sophisticated take on the 'Problem' slide. Instead of saying 'data is hard,' it maps out the internal politics of data. It divides the organization into two hemispheres: Offensive and Defensive .
On the Offensive side, we see Marketing (focused on segmentation and campaigns) and Customer Service (1:1 personalization). On the Defensive side, the deck lists IT (monitoring quality), Legal (GDPR and CCPA), and Finance (reporting and compliance). The C-Suite and Analytics sit in the middle, bridging strategic decisions with actionable insights. By positioning their data engine at the center of this web, Amperity suggests they are the 'single source of truth' that satisfies both the growth-hungry marketers and the risk-averse legal teams.
Slide 2: The Silo Problem and the Experience Gap
Slide 2 visualizes the "complex & disjointed" customer journey. It shows a chaotic map of touchpoints: Brand Credit Cards, CRM, Loyalty, Reviews, Brick & Mortar, App, Web, eCommerce, and Social. The core message is that these touchpoints produce "inconsistent identities & data siloed in different organizations."
The bottom of the slide provides the 'so what' through three jarring statistics:
11%: Only 11% of enterprises effectively use a wide variety of data types in a unified customer profile. · 80%: 80% of customers who switch from a brand feel the enterprise could have done something to retain them. · 52%: 52% of customers say that enterprises are generally impersonal.
This slide successfully connects technical failure (siloed data) to business failure (customer churn).
Slide 3: Enterprise Scale and Exponential Growth
This is the 'traction' slide, and it is the most impressive in the deck. Titled "Enterprise scale," it features a bar chart showing "Customer Data Managed" in Terabytes (TB). The growth is staggering:
2016: 1 TB · 2017: 55 TB · 2018: 400 TB · 2019: 880 TB · 2020: 2,200 TB · 2021: 5,000 TB
Beyond storage, the slide lists massive cumulative figures: 602 billion records ingested from 2,317 data sources, and 423 billion records egressed to 1,414 destinations. The final punchline is "3 billion Daily Customer Experiences Powered by Amperity." For a Series D investor, these numbers signal that the software is not just 'working'—it is foundational to the global economy's digital interactions.
Slide 4: The CDP Market Opportunity
Slide 4, "CDP market estimates," uses third-party validation from DCA and IDC to prove the size of the prize. The first chart shows the CDP Total Addressable Market growing from $2,400 million in 2020 to $10,300 million in 2025, representing a 34.0% CAGR . The second chart breaks down revenue by region, noting that the Americas make up a significant portion but that growth is global. By citing external sources, Amperity avoids the 'founder optimism' trap and grounds their valuation in market reality.
Slide 5: The First-Party Data Awakening
The final slide, "Amperity is at the intersection of an awakening to first-party data," explains why now is the time to double down. It highlights three catalysts:
Loyalty Focus: A chart shows that loyalty members spend 2x-7x more than non-loyalty members, making first-party ID resolution a high-ROI activity. · Cookiepocalypse: A reference to the end of third-party cookies, which forces brands to own their own data or lose their ability to target customers. · Market Validation: The entry of Salesforce, Adobe, and Microsoft into the CDP space. Usually, competitors are seen as a threat; here, Amperity uses them as proof that the category is 'blue chip' and essential.
What Works in the Amperity Deck
The Scale of Data: In the enterprise SaaS world, volume is a proxy for trust. By showing 602 billion records ingested, Amperity proves that they can handle the largest companies on earth. This de-risks the investment for a Series D firm looking to deploy $100M.
The 'Offensive vs. Defensive' Framework: This is a brilliant way to explain a complex product. It shows the investor that Amperity isn't just a marketing tool; it's a compliance tool and a financial reporting tool. This broadens the potential budget holders within a client organization.
Macro Alignment: The deck perfectly captures the 'Cookiepocalypse' zeitgeist. It frames Amperity not as a 'nice-to-have' analytics tool, but as a 'must-have' survival tool for a world without third-party tracking.
What is Missing from the Amperity Deck
The Team: There is no mention of the founders or the executive team. At Series D, the team is usually established, but investors still want to see the bench strength of the people managing a billion-dollar valuation.
Unit Economics: There is zero mention of CAC, LTV, Churn, or Net Revenue Retention (NRR). While the data volume is growing, we don't know if the revenue is growing at the same rate or if the company is profitable.
The Product UI: We see icons and charts, but we never see the actual Amperity interface. This suggests the deck is aimed at financial buyers rather than technical evaluators.
The Ask: The deck ends abruptly without a slide detailing how the $100M will be spent. This confirms its status as a 'teaser' or a supplementary document to a larger data room.
What Founders Should Copy
The 'So What' Stats: Slide 2 is a masterclass in using statistics to create urgency. Don't just say 'customers want personalization'; say '52% of customers think you are impersonal.' Negative stats often drive more action than positive ones.
Third-Party Validation: If you are in a hot market, use IDC or Gartner charts to prove it. It’s much more credible than a hand-drawn 'up and to the right' arrow with no source.
Volume as Traction: If your revenue is still early but your usage is high, find a 'volume' metric (records, API calls, messages sent) that shows exponential growth. It proves that users find value in the platform even before you've fully optimized the monetization.
Frequently asked questions
- What is the primary problem Amperity solves according to the deck?
- Amperity addresses the 'complex & disjointed' customer journey where data is siloed across various touchpoints like CRM, loyalty programs, and web interactions. Slide 2 explicitly states that these silos produce inconsistent identities, leading to a failure in using data to serve customers. This results in 52% of customers feeling that enterprise interactions are generally impersonal.
- How does Amperity demonstrate its technical scale?
- The company uses massive volume metrics on Slide 3 to prove enterprise-grade capability. They report ingesting 602 billion records from 2,317 data sources and egressing 423 billion records to 1,414 destinations. Most notably, they power 3 billion daily customer experiences, positioning themselves as a high-frequency infrastructure layer.
- What market trends are driving Amperity's growth?
- Slide 5 identifies three key trends: a 'maniacal focus' on loyalty and first-party IDs (where loyalty members spend 2x-7x more), the 'Cookiepocalypse' (the phase-out of third-party cookies), and the entry of major tech players like Salesforce and Adobe into the CDP market, which validates the category.
- How does the deck categorize internal organizational data needs?
- Slide 1 maps out how different departments interact with customer data. It distinguishes between 'Offensive' roles—Marketing (segmentation) and Customer Service (1:1 personalization)—and 'Defensive' roles—IT (data quality), Legal (GDPR/CCPA), and Finance (compliance). This shows Amperity's utility across the entire C-suite.
- What is missing from this Series D pitch deck?
- This is a highly abbreviated deck. It lacks a team slide, a formal business model or pricing slide, detailed financial projections (revenue/ARR), a competitive matrix, and a specific 'ask' or use of funds. It appears to be a 'market and momentum' teaser rather than a full operational overview.