Phybbit’s Series A deck for SpiderAF is a masterclass in using localized market data to justify a global expansion. Targeting the Japanese digital advertising market, the deck highlights a shift toward mobile—which reached over 1 trillion Yen in 2018 (Slide 13)—to position itself against legacy competitors focused on PC ads. The company demonstrates significant traction, citing the analysis of 5.7 trillion impressions and 27.7 billion clicks in 2018 alone (Slide 10). Most impressive is the transparency regarding unit economics, reporting a LTV/CAC ratio of 17 based on a ¥686,059 CAC and a ¥12…
Key takeaways
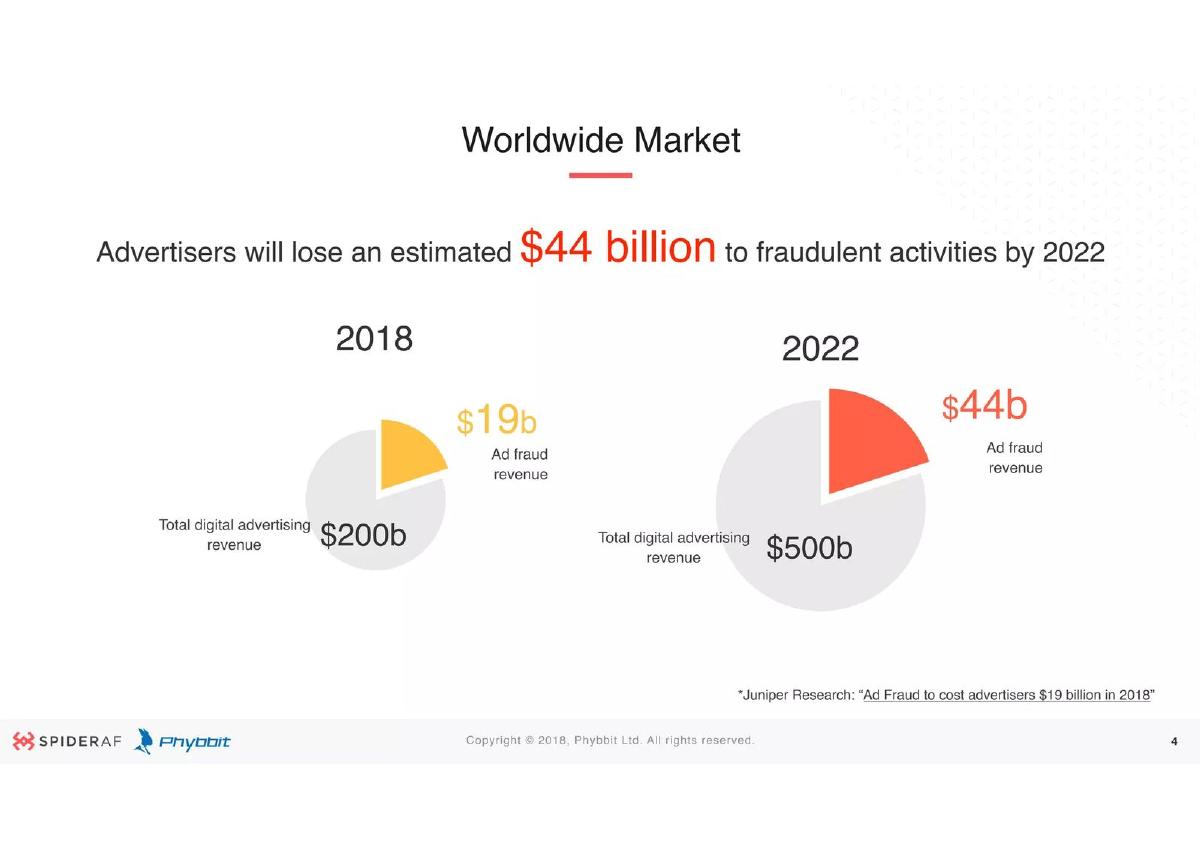
- The worldwide market for ad fraud is projected to reach $44 billion by 2022, up from $19 billion in 2018 (Slide 4).
- SpiderAF utilizes a 'Shared Blacklist' and AI-driven scoring to automate data cleansing and content monitoring (Slide 7).
- In 2018, the company analyzed 5.7 trillion impressions and 27.7 billion clicks, identifying 20.7% as fraud (Slide 10).
- Phybbit claims to have saved customers ¥2.6 billion through its fraud detection services in 2018 (Slide 10).
- The Japanese mobile ad market grew to over 1 trillion Yen in 2018, representing 70.3% of the total market (Slide 13).
- SpiderAF reports exceptionally high unit economics with a ratio of 17, supported by a yearly average LTV of ¥12,045,637 (Slide 16).
- The company planned to double its headcount from 23 in 2019 to 46 in 2020, coinciding with the opening of its first global office (Slide 19).
- Phybbit received industry validation as the 'Get In The Ring 2019 Osaka Winner' and a '2019 TiE50 Winner' (Slide 22).
Introduction and Market Context
Slide 1: Title Slide
The deck opens with a clean, professional title slide identifying the product as SpiderAF , an "AI-Driven Anti-Fraud Tool." The parent company, Phybbit , is noted in the bottom left. The deck is labeled as "Series A Deck ver.3" and is dated September 2019. The imagery features a modern illustration of a technician monitoring a server, establishing the technical nature of the product immediately.
Slide 4: Worldwide Market
Phybbit uses Slide 4 to establish the scale of the problem. Citing Juniper Research, the slide states that advertisers will lose an estimated $44 billion to fraudulent activities by 2022. It provides a comparison to 2018, where ad fraud revenue was $19 billion out of a $200 billion total digital advertising market. By 2022, the total market is projected to be $500 billion, meaning fraud is growing both in absolute terms and as a percentage of total spend.
The SpiderAF Solution
Slide 7: Solution
This slide outlines the four pillars of the SpiderAF solution: Automation for data cleansing and analytics, Content monitoring for publisher websites and apps, a Shared Blacklist , and AI to classify and score fraud levels. Notably, the slide includes a "Shared Blacklist Members" seal and a "Patent Pending" disclaimer, suggesting a proprietary and community-driven approach to security.
Slide 10: Customer Impact
Slide 10 quantifies the company's impact in 2018. Phybbit analyzed 5.7 Trillion impressions , 27.7 Billion clicks , and 59.5 Million conversions . From this data, they determined that 20.7% was ad fraud . The headline metric is the result: "So we saved ¥2.6 Billion!" for their customers. This is a powerful way to demonstrate ROI by showing the direct financial loss prevented by the software.
Market Dynamics and Competition
Slide 13: Domestic Digital Advertising Market
This slide focuses on the Japanese market, providing a strategic justification for SpiderAF's mobile-first approach. In 2018, the Japanese mobile ad market grew to more than 1 trillion Yen, accounting for 70.3% of the entire market . The slide features a line graph showing the divergence between Mobile (growing rapidly to ¥12,493B projected) and PC (stagnating at ¥4,288B). Phybbit explicitly calls out a competitor (name redacted in this version) that targets PC ads, arguing that SpiderAF's mobile focus will lead to a valuation "even bigger than IAS."
Financials and Unit Economics
Slide 16: Unit Economics (CAC & LTV)
Slide 16 is one of the most transparent in the deck. It lists a Yearly Average CAC of ¥686,059 and a Yearly Average LTV of ¥12,045,637 . This results in a Unit Economics ratio of 17 , which is exceptionally high for a SaaS business (where a ratio of 3 or 4 is often considered healthy). The slide also includes 3-year and 5-year LTV projections (¥61,975,218 and ¥55,760,456 respectively), though the 5-year figure being lower than the 3-year figure is an unusual data point that might require clarification on churn assumptions. Monthly burn and unit prices are redacted in this version.
Slide 19: Projections (Next Year)
This slide provides a visual representation of projected expenses and revenues from July 2019 to July 2021. The expense stack is dominated by payroll for business and engineering staff, followed by marketing. A significant milestone is highlighted: "Start 1st Global office" around March 2020. The slide also projects a doubling of headcount from 23 in 2019 to 46 in 2020 . While the specific ARR (Annual Recurring Revenue) figures are redacted, the MRR line shows a consistent upward trajectory that eventually crosses the expense threshold.
Validation and Recognition
Slide 22: Awards
The final slide in this selection showcases industry validation. It features photos and logos for two major wins: Get In The Ring 2019 Osaka Winner and 2019 TiE50 Winner . This serves to build investor confidence by showing that the company's technology and business model have been vetted by external panels and industry experts.
What Works in this Deck
Specific ROI: The claim of saving customers ¥2.6 billion (Slide 10) is a concrete value proposition that is hard for investors to ignore. It moves the conversation from "we have cool AI" to "we save billions of Yen."
Market Segmentation: By highlighting the 70.3% market share of mobile ads in Japan (Slide 13), Phybbit successfully frames the competition as legacy players who are missing the most important growth sector.
Unit Economics Transparency: Providing a specific LTV/CAC ratio of 17 (Slide 16) demonstrates a highly efficient sales engine and a product that customers value enough to stay with long-term.
What is Missing from this Deck
Team Biographies: In the provided slides, there is no team slide. For a Series A, investors need to see the pedigree of the founders and the technical expertise of the engineering team, especially in a field as complex as AI-driven fraud detection.
The Ask: There is no slide detailing how much capital is being raised or how specifically that capital will be allocated beyond general "payroll" and "marketing" categories.
Detailed Product Mechanics: While the deck mentions AI and Shared Blacklists, it doesn't explain how the AI detects fraud differently than existing solutions. Technical investors would likely want a deeper dive into the data science behind the 20.7% fraud detection rate.
Founder Takeaways
Lead with the 'Saved' Metric: If your product prevents loss (security, insurance, fraud), don't just talk about features. Talk about the total dollar amount you have saved your current user base. It is the ultimate proof of utility.
Use Local Trends for Global Context: Phybbit used the specific growth of the Japanese mobile market to justify why they are better positioned than global incumbents. If you are in a specific geographic market, find the one metric where that market is leading the world and lean into it.
Visualize the Burn vs. Growth: Slide 19 is an excellent way to show how hiring (expenses) precedes revenue growth. It helps investors visualize the 'J-curve' and understand why the capital is needed now to reach the next revenue inflection point.
Frequently asked questions
- What is Phybbit's primary product and value proposition?
- Phybbit's primary product is SpiderAF, an AI-driven anti-fraud tool. Its value proposition centers on protecting advertisers from the growing cost of ad fraud, which is estimated to reach $44 billion globally by 2022. It offers automation for data cleansing, content monitoring for publishers, and a shared blacklist to classify and score fraud levels across a wide network.
- How does Phybbit differentiate itself from competitors?
- Phybbit differentiates itself by focusing specifically on the mobile advertising market. Slide 13 notes that while competitors target PC ads, SpiderAF targets mobile ads, which accounted for 70.3% of the Japanese market in 2018. The deck suggests this focus leads to a higher valuation potential compared to legacy firms like IAS.
- What are the key financial metrics disclosed in the deck?
- The deck discloses a yearly average Customer Acquisition Cost (CAC) of ¥686,059 and a yearly average Lifetime Value (LTV) of ¥12,045,637. This results in a unit economics ratio of 17. The company also claims to have saved its customers ¥2.6 billion in 2018 by identifying that 20.7% of analyzed traffic was fraudulent.
- What was Phybbit's growth strategy at the time of this Series A?
- The growth strategy focused on international expansion and aggressive hiring. Slide 19 indicates a plan to open the first global office in early 2020 and double the headcount from 23 to 46. The revenue projections show a steady increase in Monthly Recurring Revenue (MRR) alongside rising payroll expenses for both engineers and business staff.
- What evidence of market validation does the deck provide?
- Beyond its processing volume (5.7 trillion impressions), the deck highlights two major awards from 2019: winning the 'Get In The Ring' competition in Osaka and being named a 'TiE50 Winner' at TiEcon 2019. These awards serve as external social proof of the company's technology and business model viability.