The PetroMagdalena investor presentation from June 2012 serves as a highly technical operational update for a publicly traded energy company (TSX-V: PMD). Rather than selling a vision, the deck sells math: specifically, the 'Operating Netback' of $63.01 per barrel (Slide 10) and a 43% increase in 2P oil reserves (Slide 7). The deck is structured around geographical basins—Llanos, Catatumbo, Magdalena, and Putumayo—detailing specific working interests and operator partnerships. While it lacks a traditional 'problem/solution' startup narrative, it excels at providing the granular financial and…
Key takeaways
- The company highlights a $145 million increase in 2P Net Present Value (NPV) between 2010 and 2011 on Slide 7.
- Operational efficiency is quantified through a detailed netback table showing a May 2012 operating netback of $63.01 per barrel on Slide 10.
- PetroMagdalena projected a significant production jump from 2,761 boed in 2011 to an estimated 4,300-4,700 boed in 2012 (Slide 13).
- The deck leans heavily on geopolitical stability, citing Colombia as the 'most secure country in Latin America' for business on Slide 4.
- Exploration success is a core theme, with the company reporting a 50% success rate in exploration activity on Slide 4.
- Asset diversification is shown across four major basins, with the Cubiro block identified as the core asset on Slide 28.
- The management team is listed by name and title on Slide 25, though it lacks the biographical 'pedigree' descriptions common in modern decks.
- Financial transparency is high, including specific line items for debt service ($24M estimated for 2012) and G&A ($18M estimated for 2012) on Slide 13.
PetroMagdalena Investor Presentation: The Data-Heavy Energy Play
The PetroMagdalena deck from June 2012 is a quintessential example of an oil and gas investor presentation. It eschews the flashy storytelling of Silicon Valley for hard geological data, regulatory context, and unit economics. At 30 slides (10 of which are analyzed here), it provides a comprehensive look at a company transitioning from exploration to significant production.
Slide 1: Title and Branding
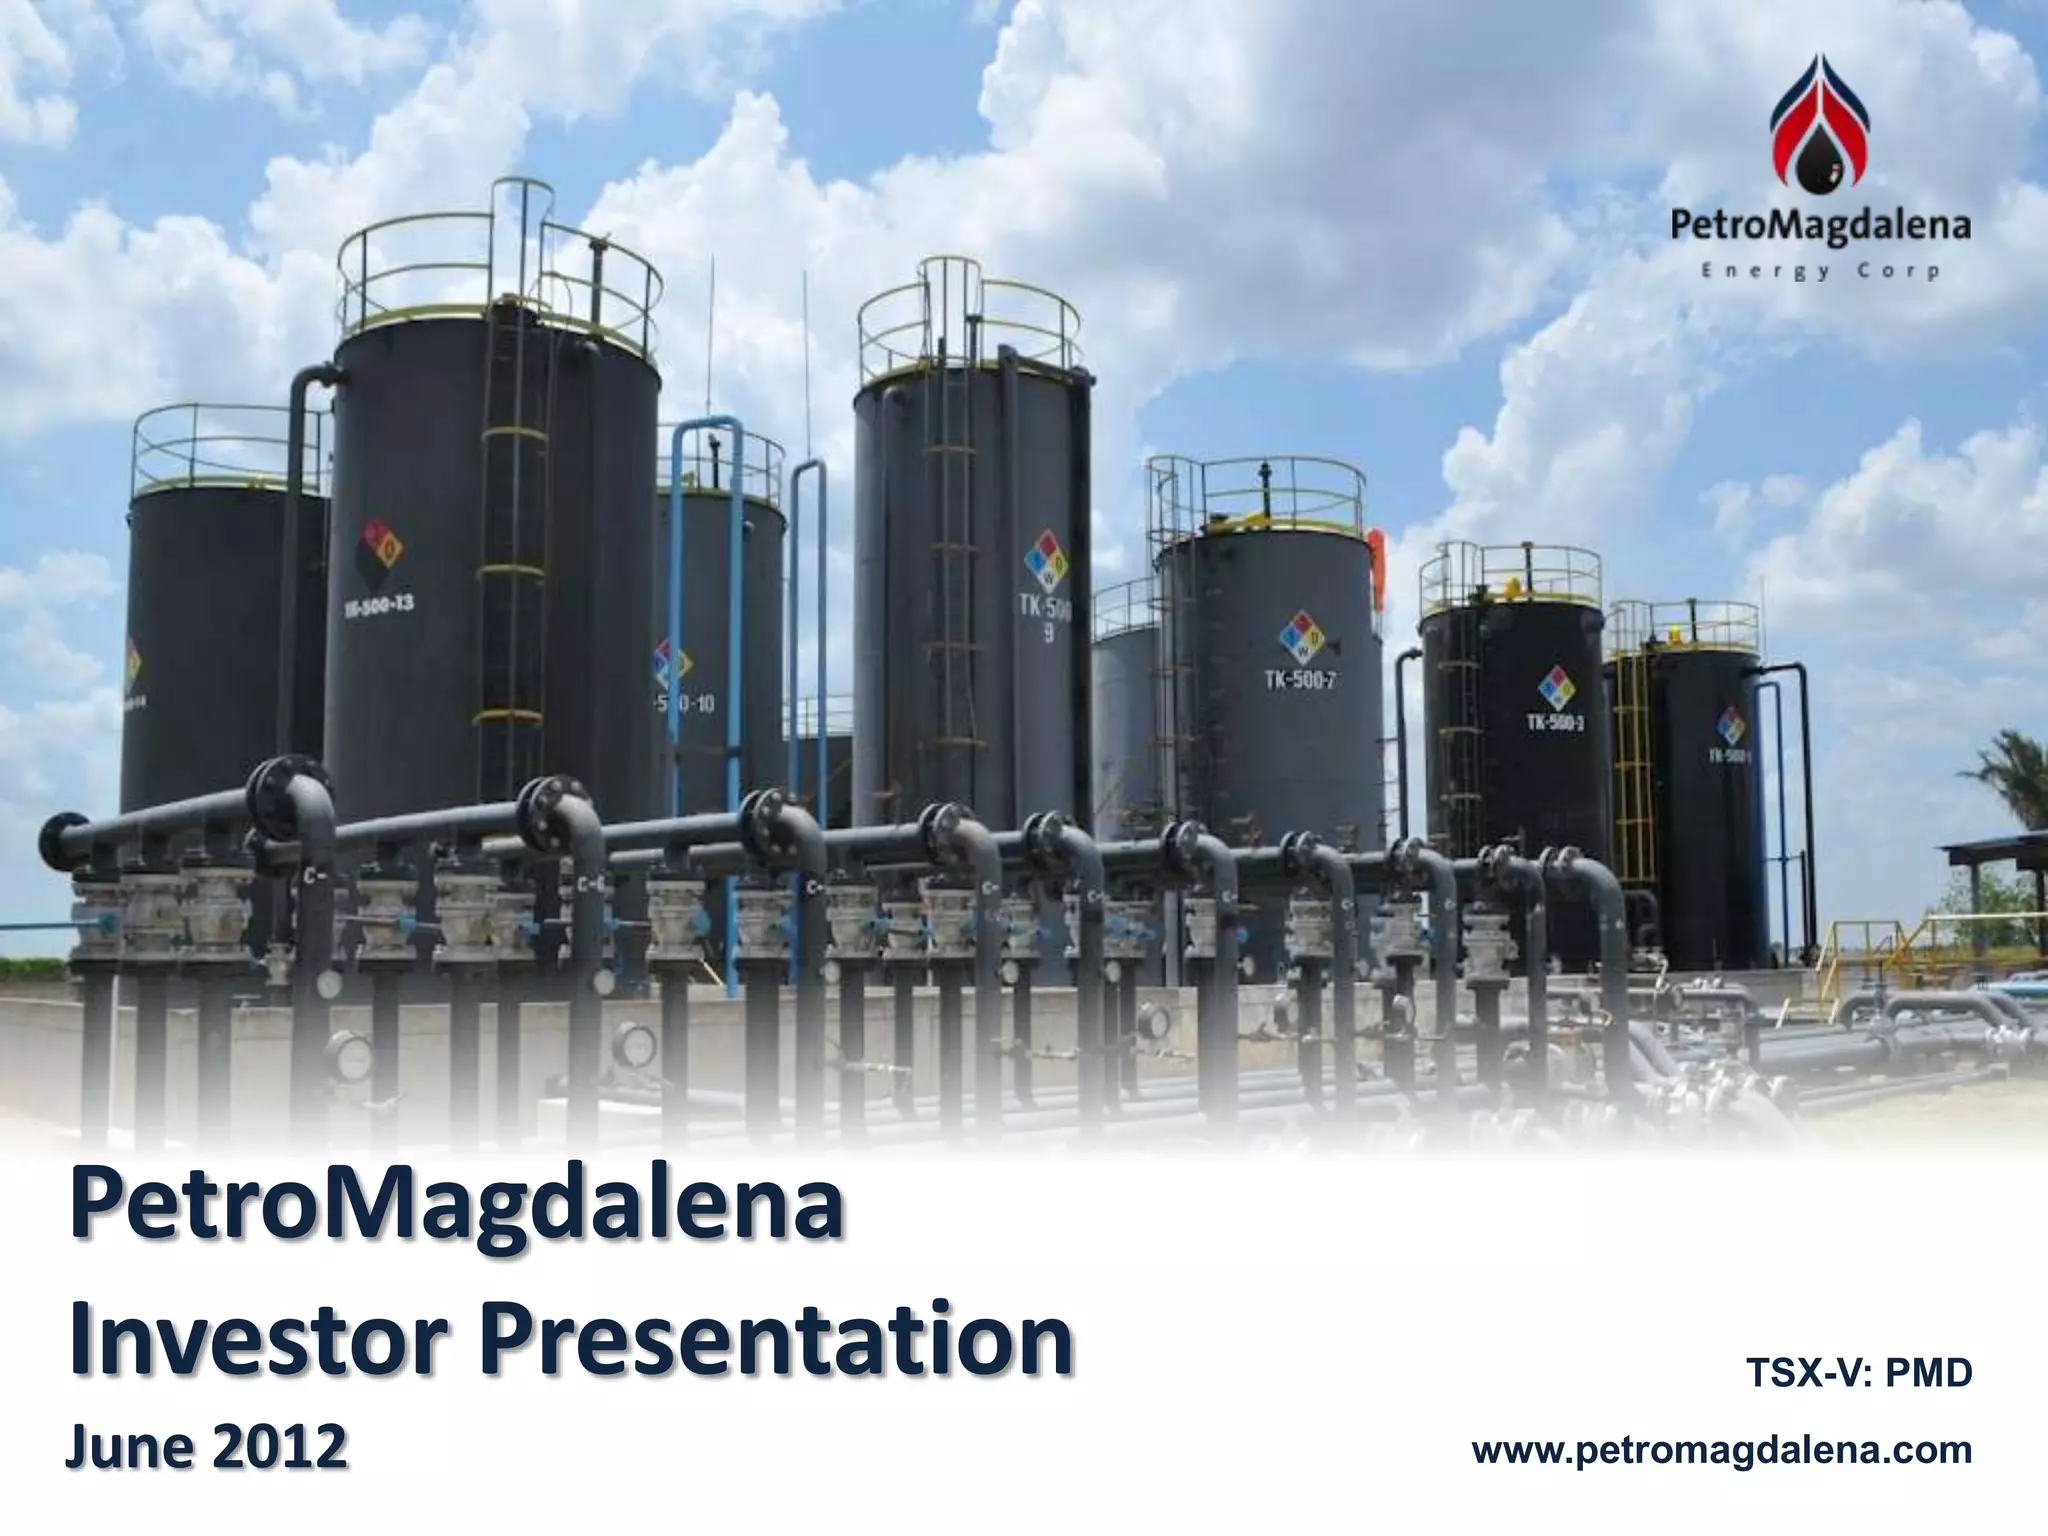
The cover slide establishes the company's identity as PetroMagdalena Energy Corp. It includes the ticker symbol (TSX-V: PMD), indicating its status as a publicly traded company on the TSX Venture Exchange. The background image of oil storage tanks and piping serves as a literal representation of their industrial operations. The date, June 2012, sets the temporal context for the data that follows.
Slide 4: The Macro Case for Colombia
PetroMagdalena opens its narrative by selling the geography before the company. Titled "PetroMagdalena is in the right country, focused in the right basin," this slide uses a TIME magazine cover to provide social proof of Colombia's economic recovery. Key metrics include:
Proven reserves of over 2 billion barrels in the region. · A 500% increase in exploration activity. · A 50% exploration success rate. · A claim from the World Bank that Colombia is the most secure country in Latin America for business.
A bar chart at the bottom tracks the number of wells drilled from 2004 to 2011, showing a steady climb in activity alongside a success factor that remains consistently above 40%.
Slide 7: Reserve Growth and NPV
This slide focuses on value creation through asset appreciation. The headline highlights a 43% increase in 2P oil reserves and a $145 million increase in 2P NPV . The slide uses two bar charts:
Before Tax Net Present Value: Shows a jump from $358,884 in 2009 to $538,985 in 2011 (figures in thousands, discounted at 10%). · 2P Reserves (MM boe): A stacked bar chart showing the composition of reserves between Oil, Gas, and Natural Gas Liquids. Notably, while total boe (barrels of oil equivalent) decreased slightly, the high-value 'Oil' component (represented in dark blue) grew significantly from 6.6 to 13.3 MM boe.
Slide 10: Cubiro's Netback Analysis
Slide 10 provides the most critical piece of unit economics in the deck: the Operating Netback for their core asset, Cubiro. This is a transparent breakdown of how much profit is retained per barrel after all variable costs. The table compares Q4 2011, Q1 2012, and May 2012. As of May 2012:
WTI Average: $92.21 · Net Revenue: $96.01 (after quality adjustments) · Royalties: -$7.00 · Production Costs: -$12.00 · Transportation & Pipeline: -$21.00 · Operating Netback: $63.01
The slide also notes a marketing agreement with Pacific Rubiales and a purchase agreement with Ecopetrol, providing certainty for their off-take.
Slide 13: Annual Cash Flow Projections
This slide functions as the company's financial roadmap. It compares 2011 actuals (2011A) with 2012 estimates (2012E). Key projections for 2012 include:
Average daily production: 4,300-4,700 boed (up from 2,761 in 2011). · Cash flow from operating netbacks: $102 million. · Net cash flow from operations: $58 million. · Annual Work Program Expenditures: $75 - $80 million.
This slide is essential for investors to understand the company's liquidity and its ability to fund its own exploration and development through cash flow.
Slide 16: Petirrojo & Yopo Fields
Moving into specific field data, Slide 16 details the development and exploration plans for the Petirrojo and Yopo fields. It includes a topographical heat map of the area and a table of 2P Reserves: 1,569 Mbbls for Petirrojo and 1,415 Mbbls for Yopo. The slide notes that a plan is in place to replace rented facilities to reduce Opex, showing a focus on long-term margin improvement.
Slide 19: Llanos Basin – Arrendajo
This slide focuses on the Arrendajo block within the Llanos Basin. It highlights that the block is operated by Pacific Rubiales Energy Corp and that PetroMagdalena acquired a 32.5% additional working interest in November 2011 for $10 million. The map shows the proximity to the core Cubiro block, and the text notes that 3D seismic interpretation shows 6 light oil prospects on trend with producing fields.
Slide 22: Catatumbo Basin
Slide 22 covers the Catatumbo Basin in northwest Colombia. It highlights a Memorandum of Understanding (MOU) signed with YPF to farm out 60% of the Carbonera block and 70% of the Catguas block. This 'farm-out' strategy is a common way for smaller energy companies to mitigate exploration risk and capital requirements by bringing in larger partners.
Slide 25: Leadership Team
The team slide is functional but brief. It lists the Head Office in Toronto and the Colombia Office in Bogota. The management section lists:
Luciano Biondi: CEO · Gregg K. Vernon: COO · Michael Davies: CFO · Francisco Bustillos: Colombian Finance & Admin Manager · Jesus Aboud: Exploration Manager · Peter Volk: General Counsel
A list of seven directors is also provided, though no individual bios or past successes are detailed on this specific slide.
Slide 28: Comprehensive Asset Table
The deck concludes its data section with a massive summary table of all assets across four basins (Llanos, Catatumbo, Magdalena, and Putumayo). For each area, it lists the Operator, Gross Acres, Working Interest (WI), Contract type (ANH or ECP), Stage (Exploration or Production), Product (Light Oil, Gas, etc.), and Status. This slide is the 'source of truth' for the entire portfolio, identifying Cubiro as the 'Core Asset' and others as 'Under Review' or 'Near Cubiro.'
What PetroMagdalena Does Well
The PetroMagdalena deck is a masterclass in operational transparency . For an institutional investor, the most important slides are 10 (Netbacks) and 13 (Cash Flow). By showing exactly how much it costs to get a barrel of oil out of the ground and to the market ($63.01 profit on a $92.21 WTI price), the company removes the guesswork from its valuation. The use of third-party reports (NI 51-101 Technical Reports) to verify reserves adds a layer of necessary credibility in a high-risk sector.
What is Missing from the Deck
While the deck is technically proficient, it lacks a few elements that could help a broader range of investors:
Competitive Landscape: There is no mention of other independent E&P (Exploration and Production) companies in Colombia. Investors have to do their own benchmarking. · Team Pedigree: While names are listed, there are no bios. In the energy sector, knowing that a CEO has previously exited a company or discovered a major field is a significant selling point. · Risk Factors: While the deck mentions Colombia is 'secure,' it omits the standard 'Risk Factors' slide common in public filings, which would address commodity price volatility or local security issues.
Founder Takeaways: Copy the Math, Not the Style
Founders in asset-heavy industries (Energy, Manufacturing, Infrastructure) should emulate PetroMagdalena's unit economics breakdown . If you are selling a physical product, your 'Netback' equivalent—the margin after shipping, duties, and production—is the most important number in your deck. However, modern founders should avoid the dense, text-heavy layout of these slides. Using a 30-slide deck to convey this much information is standard for 2012, but today's investors prefer a 'leaner' main deck with these technical details moved to a data room or appendix.
Frequently asked questions
- What is the primary financial metric used in this deck?
- The deck focuses on 'Operating Netback' per barrel. On Slide 10, PetroMagdalena breaks this down by subtracting royalties, production costs, and transportation/pipeline costs from the net revenue. As of May 2012, their operating netback was $63.01 per barrel, which is a critical efficiency metric for oil and gas investors to understand the profitability of each unit produced.
- How does the company justify its focus on Colombia?
- Slide 4 uses a 'TIME' magazine cover featuring the Colombian president to signal a 'Colombian Comeback.' It backs this up with World Bank data claiming Colombia is the most secure country in Latin America for business and highlights a 500% increase in exploration activity in the region, suggesting a favorable regulatory and geological environment.
- What are the company's reserve growth figures?
- On Slide 7, the company reports a 43% increase in 2P (Proven + Probable) oil reserves. Specifically, 2P Light Oil reserves increased by 4 million barrels (MM Bbls) in 2011. This growth contributed to a 37% increase in the Net Present Value of those reserves, reaching a total of $538,985,000 (discounted at 10%).
- Who are PetroMagdalena's key partners?
- The deck lists several major industry partners on Slide 28. These include Pacific Stratus (operator for Arrendajo), Gran Tierra (operator for Catguas and Rio Magdalena), and Mompos (operator for Santa Cruz). These partnerships indicate that PetroMagdalena often takes a non-operating working interest (WI) in various blocks to spread risk.
- What is the company's projected capital expenditure?
- According to the Annual Cash Flow slide (Slide 13), the company planned an 'Annual Work Program Expenditure' of $75 to $80 million for 2012. This was to be funded by $87 million in total available cash, which included $58 million from operations and $15 million in new cash financing.