Parsec’s 15-slide deck is an outlier in the Series B landscape, favoring bold, single-metric slides over dense technical explanations. The company, which provides high-performance remote desktop technology for creative professionals and gamers, used this presentation to secure $33 million in 2016. The narrative is built on three pillars: extreme capital efficiency (bootstrapped to $1.1M ARR), rapid geographic proof of concept (expanding from 97 to 368 cities in two years), and superior unit economics (LTV of $6,300 against a $1,500 CAC). While the deck lacks a traditional competitive matrix o…
Key takeaways
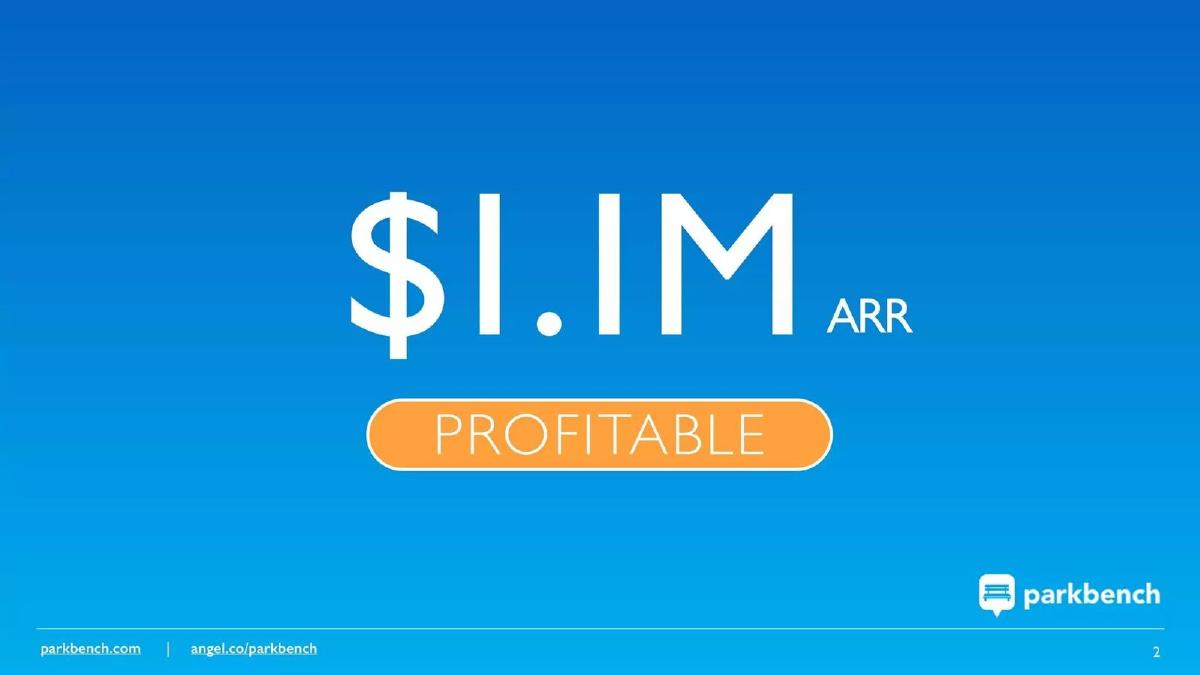
- The company demonstrated immediate product-market fit by reaching $1.1M ARR while remaining bootstrapped (Slide 2, Slide 14).
- Parsec identifies a massive $27B real estate advertising market as its primary hunting ground (Slide 5).
- The sales process is hyper-efficient, boasting a 45-minute sales cycle to close customers (Slide 8).
- Geographic expansion was aggressive, growing from 97 cities in 2014 to 368 cities by 2016 (Slides 9, 10, 12).
- Unit economics are healthy with a Customer Acquisition Cost (CAC) of $1,500 and a Lifetime Value (LTV) of $6,300 (Slide 11).
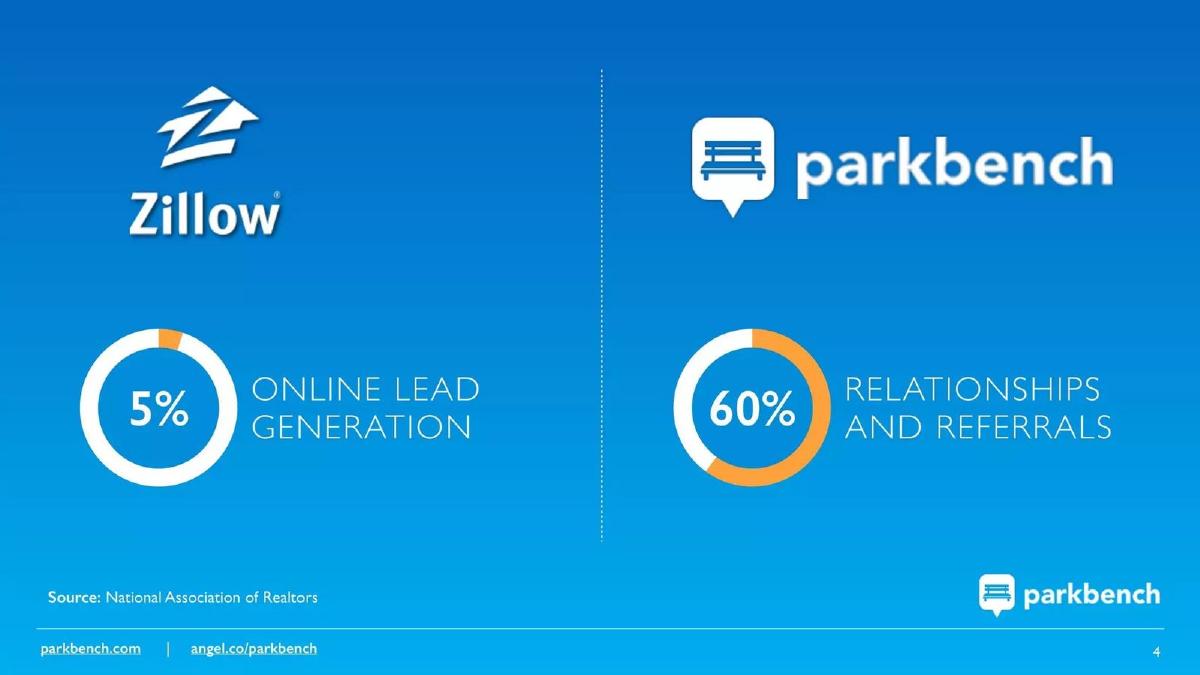
- The deck highlights a specific value proposition: moving realtors from 5% online lead gen to 60% relationship-based referrals (Slide 4).
- Revenue growth is shown as a consistent upward trajectory from CA$275k in 2014 to over CA$1.1M in 2016 (Slide 13).
- The team slide is unconventional, featuring only the CEO and CMO in a personal hiking photo rather than a list of credentials (Slide 7).
The Narrative: From Bootstrapped Niche to Scalable Engine
The Parsec (Parkbench) deck is a masterclass in quantitative storytelling. It doesn't waste time on philosophical musings about the future of work. Instead, it presents a business that is already working, already profitable, and ready for a massive injection of capital to accelerate an existing trajectory. The deck uses a clean, high-contrast design that forces the eye toward the most important numbers: revenue, sales speed, and geographic footprint.
Slides 1-3: The Hook and the Traction
Slide 1 introduces the brand 'parkbench.com' with the tagline 'Get to know your neighborhood.' This immediately grounds the technology in a local, human context. Slide 2 is the ultimate 'mic drop' for a Series B pitch: '$1.1M ARR' and 'PROFITABLE' in large, bold text. Starting with profitability effectively de-risks the entire investment for a VC; it proves the founders aren't just burning cash to find a product-market fit.
Slide 3 uses a collage of photos to humanize the data. The headline 'We get REALTORS® Face to Face Meetings' defines the core value proposition. It’s not about the software; it’s about the outcome. This slide bridges the gap between the abstract $1.1M ARR and the real-world activity generating that money.
Slides 4-6: Market Opportunity and the 'Big' Gap
Slide 4 provides a brilliant competitive comparison. It pits Zillow (the industry giant) against Parkbench. It claims Zillow represents only '5% Online Lead Generation' while Parkbench captures the '60% Relationships and Referrals' segment. This reframes the competition: they aren't fighting Zillow for the 5%; they are owning the 60% that Zillow can't touch. Slide 5 quantifies the prize: a '$27B Real Estate Advertising' market. Slide 6 reinforces this by labeling 'Relationship Building' as 'the BIG opportunity.'
Slides 7-8: The Team and the Velocity
Slide 7 is a departure from standard corporate decks. Instead of headshots and logos of former employers (Google, Facebook, etc.), it shows founders Amanda Newman (CMO) and Grant Findlay-Shirras (CEO) on a mountain hike. The text 'We built Parkbench to solve our problem' establishes founder-market fit. Slide 8 returns to the data with a startling metric: '45 mins SALES CYCLE.' In the world of B2B sales, where cycles usually last 3-6 months, a 45-minute close is a signal of extreme efficiency and product demand.
Slides 9-12: Geographic Dominance and Unit Economics
This section of the deck focuses on the 'Scale' part of the Series B. Slide 9 shows 97 cities in 2014. Slide 10 shows 205 cities in 2015. Slide 12 completes the trilogy with 368 cities in 2016. This visual progression of orange-shaded maps provides a literal map of the company's growth. Slide 11 provides the financial justification for this expansion: a CAC of $1,500 against an LTV of $6,300. This 4.2x LTV/CAC ratio is the 'Golden Ratio' for SaaS companies, indicating that for every dollar spent on marketing, the company generates over four dollars in value.
Slides 13-15: The Financial Trajectory and the Close
Slide 13 shows a linear revenue growth chart from 2014 to 2016, specifically noting figures in Canadian Dollars (CA$275k to CA$1,100k). Slide 14 reinforces the 'BOOTSTRAPPED' status with a piggy bank graphic, emphasizing that this growth was achieved without prior institutional funding. Finally, Slide 15 ends with a call to action: 'Come build a relationship with us!' and an info@parkbench.com contact address.
What Works in This Deck
The 'One Big Number' Approach: Almost every slide focuses on a single, powerful metric. This prevents 'cognitive overload' and ensures that the investor remembers the key takeaways: $1.1M ARR, 45-minute sales cycle, and 368 cities. The Contrast Strategy: By positioning themselves against Zillow’s 5% market share, they make a $27B market feel accessible. They aren't a small player in a big pond; they are the leader of a different, larger pond. Proof of Capital Efficiency: Being bootstrapped to $1.1M ARR is a massive signal of discipline. It tells investors that their money will be used for growth, not for figuring out the business model.
What Is Missing
No Product Deep-Dive: For a technology company, there is surprisingly little information on how the platform actually works. There are no screenshots of the dashboard, no explanation of the '60FPS' tech mentioned in their self-description, and no technical roadmap. No Detailed Team Pedigree: While the hiking photo is charming, the deck omits the professional backgrounds of the founders and key hires. Most Series B investors want to see a 'bench' of experienced VPs. No Explicit 'Ask': The deck never states exactly how much they are raising or how they plan to spend the $33M. While this information is often handled in the verbal pitch, its absence from the slides is notable.
What a Founder Should Copy
The Geographic Growth Visualization: If you are a marketplace or a localized service, the 'Year-over-Year Map' (Slides 9, 10, 12) is the most effective way to show expansion. It is intuitive and visually satisfying. The Unit Economics Slide: Slide 11 is perfect. It shows CAC, LTV, and the payback period ( The Outcome-Based Headline: Instead of saying 'Our Features,' use 'We get [Customer] [Result]' as seen on Slide 3. It shifts the focus from the tool to the value.
Frequently asked questions
- Why does the deck focus so heavily on real estate if Parsec is a tech tool?
- At the time of this raise, Parsec (operating under the Parkbench brand for this specific vertical) was laser-focused on the real estate niche. By dominating a $27B advertising sector first, they proved the technology's commercial viability. Investors often prefer a 'inch wide, mile deep' strategy in early rounds over a broad, unfocused horizontal approach.
- Is a 15-slide deck enough for a Series B round?
- While Series B decks are often 20-30 slides with deep data rooms, Parsec’s 15 slides work because the metrics are undeniable. When you show $1.1M ARR from bootstrapping and a 4x LTV/CAC ratio, the 'how' becomes secondary to the 'more.' The brevity suggests a high level of confidence in the core business engine.
- What is the significance of the 45-minute sales cycle?
- A 45-minute sales cycle (Slide 8) is incredibly rare in B2B SaaS. It signals to investors that the product is an 'impulse buy' for professionals or that the sales script is perfected. This implies that scaling is simply a matter of hiring more reps to run that 45-minute playbook, reducing execution risk.
- Why are the revenue figures in Canadian Dollars (CA$)?
- Slide 13 lists revenue in CA$, indicating the company’s initial operations and headquarters were likely in Canada. However, the geographic expansion slides (9, 10, 12) show a clear move into the United States, which is a critical milestone for any non-US startup looking to raise a large Series B.
- Does the lack of a technical slide hurt the pitch?
- For a company known for 'silky smooth 60FPS' tech, the absence of a technical architecture slide is surprising. However, by focusing on the 'Face to Face Meetings' outcome (Slide 3), they sell the benefit rather than the feature. Investors can audit the tech in due diligence; the deck's job is to sell the business opportunity.