The November 2015 investor deck for Diplomat Pharmacy (Diplomat) presents a company in a high-growth phase, reporting a 59% year-over-year revenue increase to $947 million in Q3 2015. The presentation focuses heavily on the 'Diplomat Difference,' positioning the firm as a high-touch, specialty-focused alternative to large PBMs and fragmented local pharmacies. Key metrics include a 212% growth in Adjusted EBITDA and a significant expansion in gross profit per script, rising from $185 to $301. The deck effectively addresses market concerns regarding drug price inflation by demonstrating that in…
Key takeaways
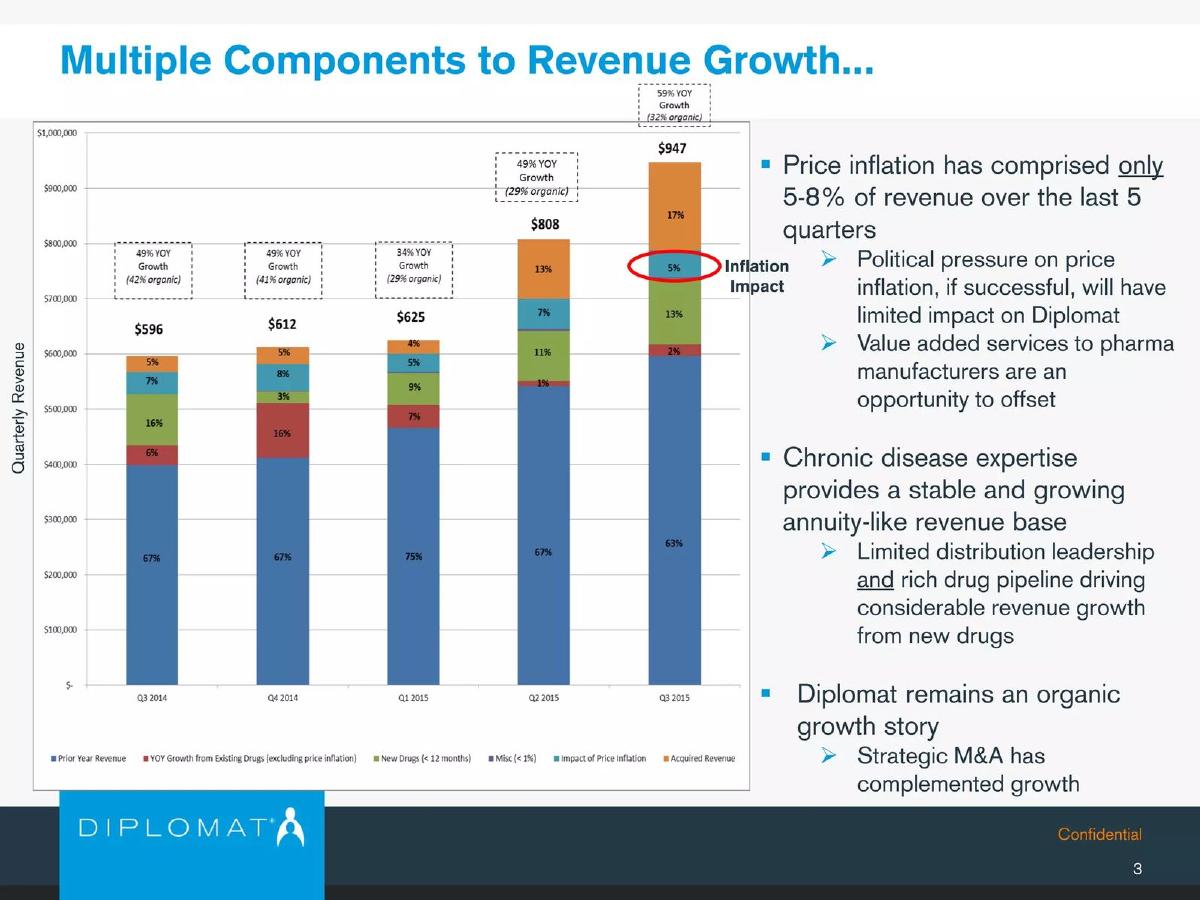
- Revenue reached $947 million in Q3 2015, representing 59% year-over-year growth, with 32% of that growth being organic (Slide 3).
- Adjusted EBITDA grew 212% year-over-year, reaching $33.0 million in Q3 2015 compared to $10.6 million in Q3 2014 (Slide 6).
- Gross profit per script increased by 63% to $301 in Q3 2015, driven by a mix shift toward higher-priced drugs and favorable pricing trends (Slide 6, 18).
- Oncology is the dominant therapeutic category, accounting for 48% of the revenue mix as of FY 2014A (Slide 21).
- The company positions itself as a 'high-touch' middle ground between large, inflexible PBMs and small, limited-scale pharmacies (Slide 12).
- Price inflation impact is isolated as a minor revenue driver, comprising only 5% of revenue in Q3 2015 (Slide 3).
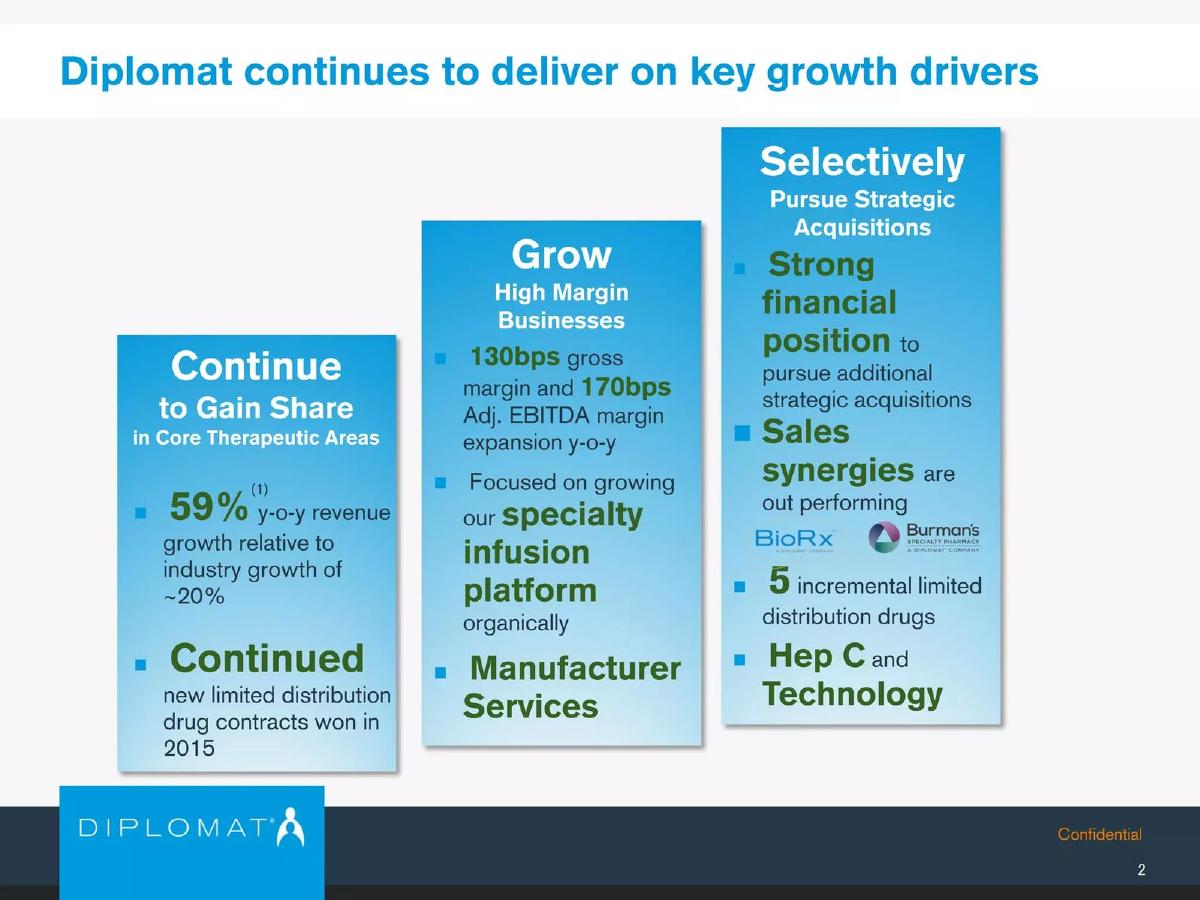
- The deck highlights a 170 basis point expansion in EBITDA margin, moving from 1.8% to 3.5% between 3Q14 and 3Q15 (Slide 6).
- Strategic M&A is explicitly cited as a complement to organic growth, with 'Acquired Revenue' contributing 17% to the Q3 2015 total (Slide 3).
Executive Summary: The Specialty Pharmacy Growth Engine
The November 2015 investor presentation for Diplomat Pharmacy Inc. (Diplomat) serves as a masterclass in demonstrating scale and operational leverage. At the time of this deck, Diplomat was positioning itself as the largest independent specialty pharmacy in the United States. The narrative is built on three pillars: aggressive organic growth, strategic acquisitions, and a 'high-touch' service model that purportedly creates better outcomes for patients with complex, chronic conditions like cancer and multiple sclerosis.
Slide 1: The Human Element
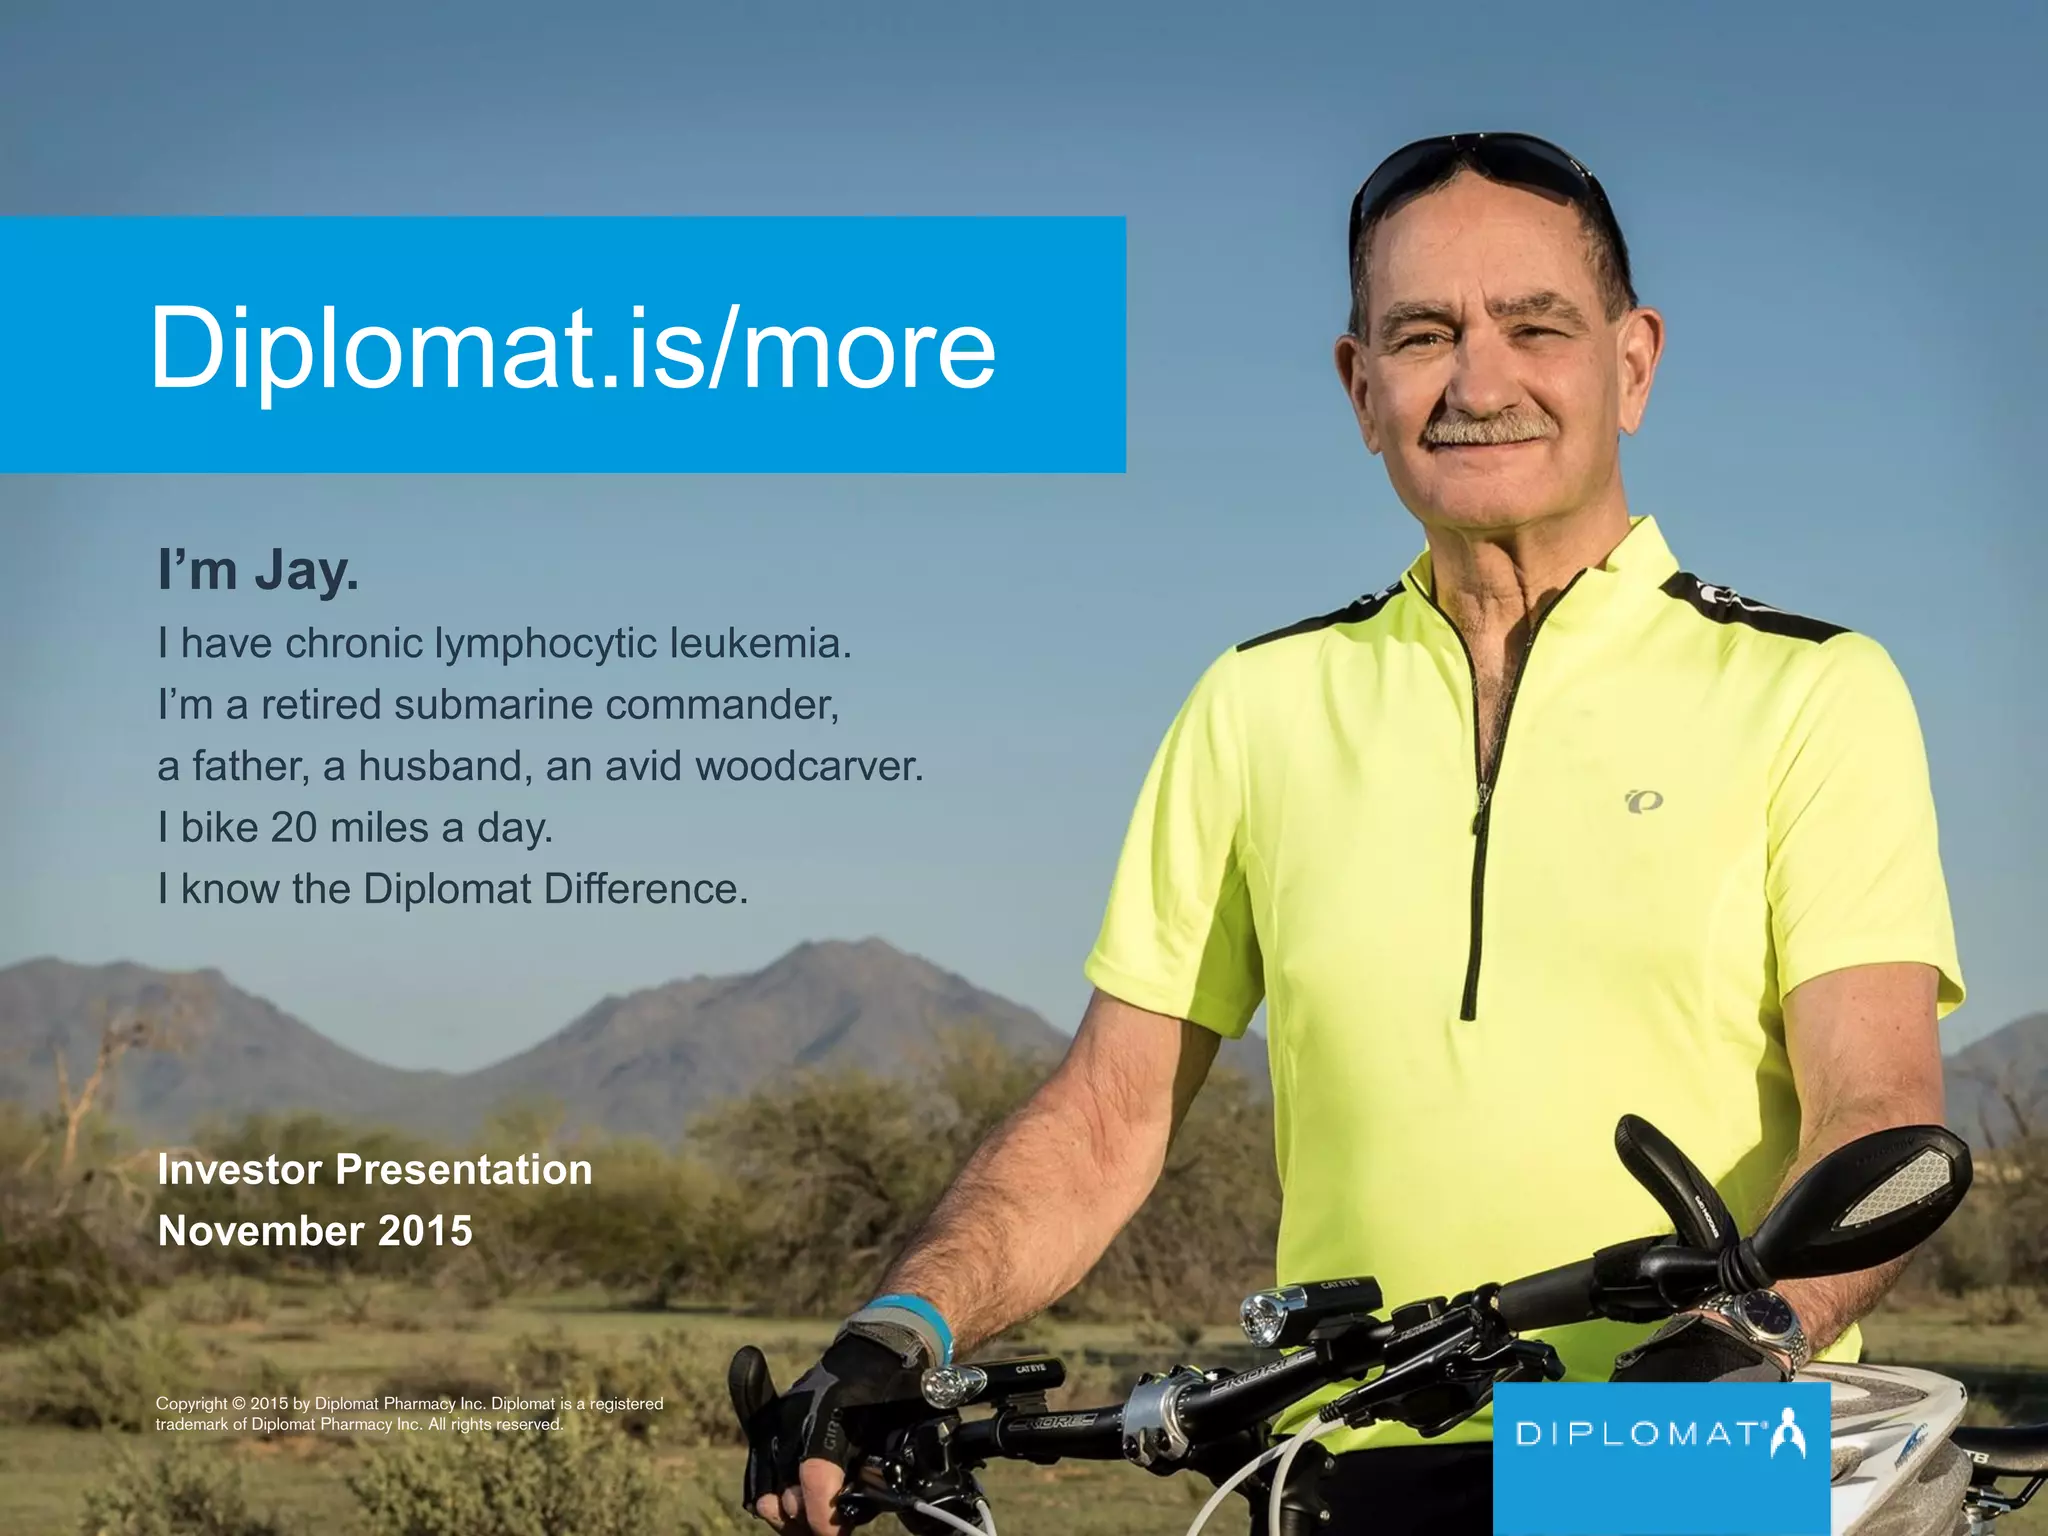
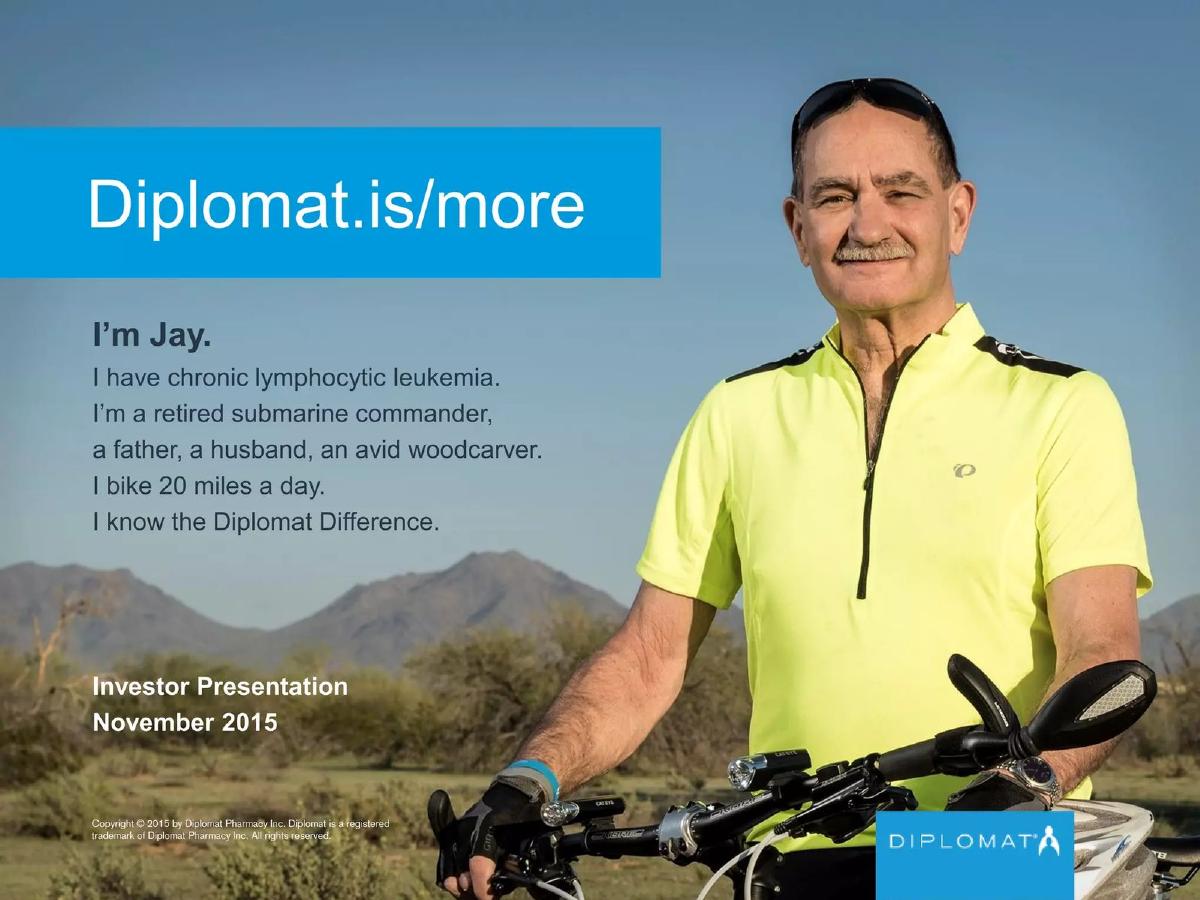
The deck opens not with a logo or a financial chart, but with a full-page photo of 'Jay,' a patient with chronic lymphocytic leukemia. This is a tactical choice to ground a high-margin medical business in patient outcomes. By stating Jay is a 'retired submarine commander' who 'bikes 20 miles a day,' the company immediately defines its value proposition: Diplomat doesn't just ship pills; it enables life. The URL Diplomat.is/more reinforces this branding effort.
Slide 3: Deconstructing Revenue Growth
Slide 3 is perhaps the most critical slide for a sophisticated investor. It breaks down the $947 million in Q3 2015 revenue into specific growth drivers. The company addresses a common industry criticism—that growth is driven by predatory price hikes—by highlighting that inflation impact comprised only 5% of revenue in the most recent quarter. The chart shows a clear transition: while 'Prior Year Revenue' remains the base (63%), 'Acquired Revenue' (17%) and 'New Drugs' (13%) are the primary engines of the 59% year-over-year growth. This slide successfully argues that Diplomat is an 'organic growth story' supplemented by M&A.
Slide 6: Financial Performance and Margin Expansion
This slide focuses on three key metrics: Revenue, Gross Profit per Script, and Adjusted EBITDA. The data shows significant scaling efficiency. While revenue grew 59%, Adjusted EBITDA grew 212% , rising from $10.6 million to $33.0 million. This indicates that the company is successfully managing its fixed costs as it grows. The 130 bps expansion in gross margin (from 6.7% to 8.0%) and 170 bps expansion in EBITDA margin (from 1.8% to 3.5%) are the 'proof points' for the company's operational maturity.
Slide 9: The Patient Journey
Diplomat uses a circular flow chart to illustrate how they 'control the journey of a specialty patient.' The graphic places Diplomat at four distinct touchpoints: monitoring adherence, dispensing drugs, providing benefit verification/prior authorization, and clinical intervention. By inserting themselves between the Physician, Payor, and Patient, Diplomat justifies its 'high-touch' label. The slide emphasizes that they are not just a delivery service but an administrative and clinical partner.
Slide 12: Competitive Positioning
The competitive landscape is presented as a three-column comparison. Diplomat sits in the center, flanked by 'Large PBM / Retail Pharmacy' on the left and 'Smaller Specialty Pharmacies' on the right. The company claims to solve the weaknesses of both: they have the national reach and scalable infrastructure that small pharmacies lack, but maintain the flexibility and specialty focus that large PBMs supposedly lose through diversification. This 'Goldilocks' positioning is a standard but effective strategy for mid-cap market leaders.
Slide 15: Visual Interstitial
Slide 15 is a transition slide titled 'Outstanding financial profile.' It features a collage of six photos showing diverse patients and healthcare professionals. While it contains no data, it serves to reset the presentation before diving into the deeper financial metrics of the subsequent slides.
Slide 18: Gross Profit per Script Trends
This slide provides a historical view of profitability per prescription from 2010 through the first nine months of 2015. The growth from $71 per script in 2010 to $269 in 2015 is a 67% increase just between the 2014 and 2015 nine-month periods. The company attributes this to a 'mix shift towards higher price, higher profit drugs.' The slide also lists future opportunities for margin expansion, including specialty generics and biosimilars, signaling to investors that the ceiling for profitability has not yet been reached.
Slide 21: Therapeutic Diversification
A pie chart details the revenue mix by therapeutic category for FY 2014A. Oncology is the clear leader at 48% , followed by Immunology (20%) and Multiple Sclerosis (10%) . This slide is intended to show that while they are 'specialty,' they are not a 'single-indication' company. However, the heavy weighting toward Oncology suggests that the company's fortunes are closely tied to the oncology drug pipeline and reimbursement environment.
Slide 24: Financial Reconciliations
The final slide provided is a dense page of footnotes regarding the 'Reconciliation of Net income (loss) and Adjusted EBITDA.' It includes details on share-based compensation, restructuring charges (including a $932,000 write-down of a former headquarters), and a $4,869,000 impairment related to an investment in 'Ageology.' This level of detail is typical for a public company (or one in the late stages of an IPO) and provides the necessary transparency for institutional due diligence.
What Works in This Deck
Transparency on Inflation: By explicitly circling the 5% inflation impact on Slide 3, Diplomat proactively defends itself against the 'price gouging' narrative that often plagues the pharmaceutical sector. · Operational Leverage: The contrast between 59% revenue growth and 212% EBITDA growth (Slide 6) is a powerful indicator of a business that becomes more profitable as it scales. · Granular Unit Economics: The 'Gross Profit per Script' metric (Slide 18) provides a clear unit of value that investors can track over time, making the business model easier to model.
What Is Missing
The Team: There is no slide introducing the executive leadership or the clinical experts behind the 'high-touch' model. In specialty pharmacy, the relationships between leadership and payors/manufacturers are vital. · The Ask: The deck does not state how much capital is being raised or how it will be spent. This suggests the deck was used for a general investor roadshow or quarterly update rather than a specific funding round. · Competitor Names: While Slide 12 categorizes competitors, it does not name them. Investors would want to see how Diplomat stacks up against specific peers like Accredo (Medco/Express Scripts) or Specialty Health (CVS).
Founder Takeaways
Isolate your growth drivers. If you are in a sector where 'market tailwinds' (like inflation or general industry growth) are high, show exactly how much of your growth is yours (organic/M&A) versus just riding the wave. Diplomat’s Slide 3 is a perfect template for this.
Define your 'Middle Ground.' If you are competing against giants and mom-and-pops, use a slide like Slide 12 to show why being in the middle is a strategic choice, not a lack of direction. Frame it as having the 'Scale of the Big Guys' and the 'Agility of the Small Guys.'
Use 'Proof Point' Metrics. Don't just say you are getting better; show the unit economics. 'Gross Profit per Script' is a fantastic example of a custom metric that perfectly captures the health of a pharmacy business. Find the equivalent for your industry.
Frequently asked questions
- What is Diplomat's primary revenue driver according to the deck?
- Diplomat's revenue is primarily driven by specialty drugs for chronic diseases, with Oncology making up 48% of their therapeutic mix. Slide 3 shows that while M&A contributes significantly, the majority of their growth is organic, fueled by a 'rich drug pipeline' and a stable, annuity-like revenue base from chronic disease patients.
- How does Diplomat differentiate itself from large Retail Pharmacies or PBMs?
- On Slide 12, Diplomat claims a 'Unique competitive position.' They argue that large PBMs are distracted by diversification and are less flexible, whereas Diplomat is 'singularly focused on specialty' with a 'high-touch model.' They contrast this with smaller pharmacies that lack the national reach and scalable infrastructure Diplomat possesses.
- What are the specific components of Diplomat's revenue growth?
- Slide 3 breaks down the $947 million Q3 2015 revenue into several buckets: 63% from prior year revenue, 17% from acquired revenue, 13% from new drugs (less than 12 months), 5% from price inflation, and 2% from growth in existing drugs. This transparency aims to prove that growth is not merely a result of price hikes.
- What is the 'Gross Profit per Script' metric and why is it important?
- Gross Profit per Script (Slide 18) measures the profitability of each prescription filled. Diplomat showed a steady increase from $71 in 2010 to $269 in the first nine months of 2015. This growth is attributed to a shift toward higher-priced drugs and acquisitions with higher margins, indicating improved operational efficiency and market power.
- Does the deck include a team slide or a specific funding request?
- No. The nine slides provided do not include a management team overview, a board of directors list, or a specific 'Ask' regarding capital requirements. The presence of Slide 24 (Reconciliation of Net Income) suggests this is a corporate investor relations deck for a company that is already public or preparing for an IPO.