Diplomat Pharmacy’s January 2017 presentation for the JP Morgan Healthcare Conference serves as a masterclass in positioning a mid-market player against industry titans like CVS and Walgreens. With a reported $4.5 billion in estimated 2016 revenue and a 62% CAGR from 2005 to 2015, the company emphasizes its 'singular focus' on specialty pharmacy. The deck meticulously details how Diplomat captures value across the patient journey, from clinical intervention to logistics. A significant portion of the narrative is dedicated to 'mix shift'—moving toward higher-margin specialty drugs—and an aggre…
Key takeaways
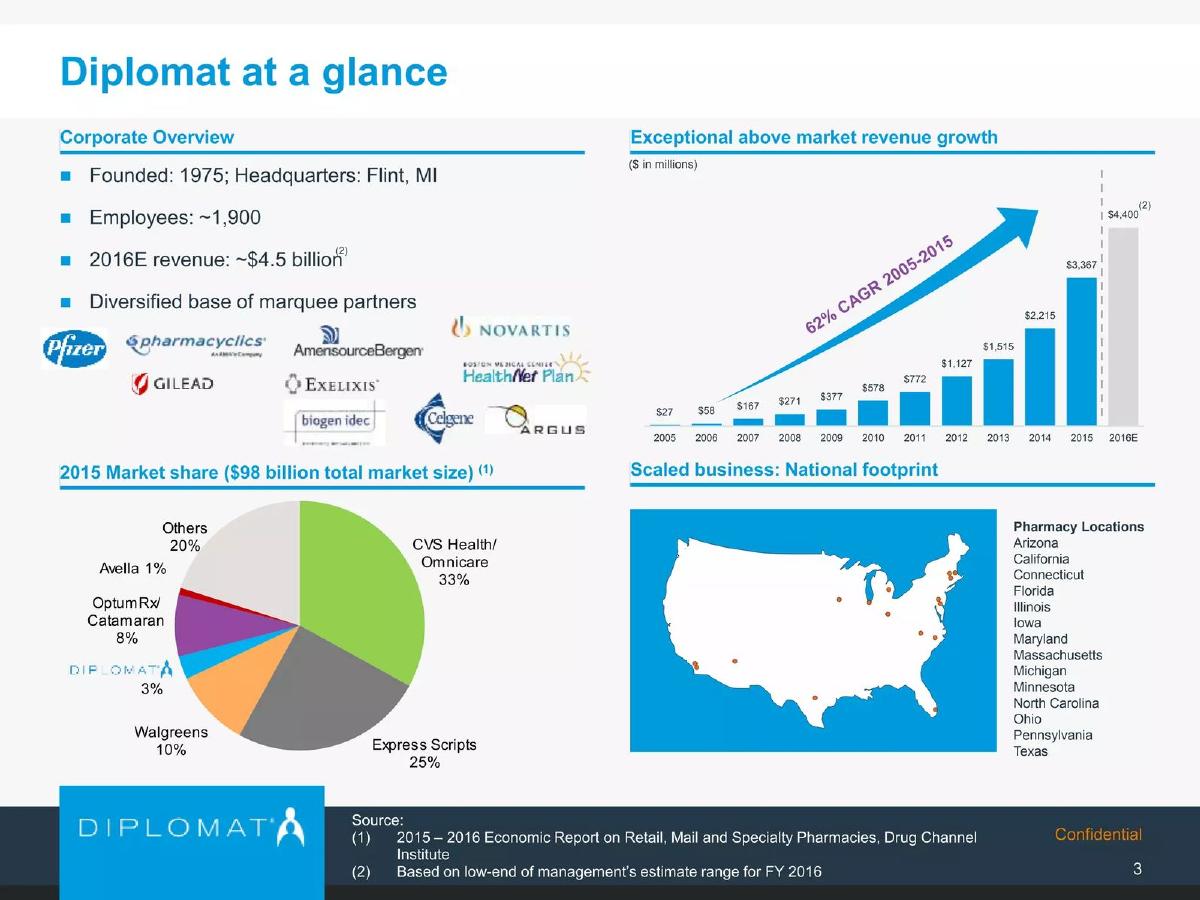
- Diplomat achieved a 62% CAGR in revenue between 2005 and 2015, growing from $27 million to $3.367 billion (Slide 3).
- The company estimates 2016 revenue at approximately $4.5 billion with a workforce of roughly 1,900 employees (Slide 3).
- Diplomat positions itself as a 'nimble' alternative to large PBMs like CVS Health (33% market share) and Express Scripts (25% market share) (Slide 3, 9).
- Gross profit per script increased from $71 in 2010 to $280 in 2015, driven by a mix shift toward higher-priced drugs (Slide 18).
- The growth strategy relies heavily on M&A, citing acquisitions of ModernHealth (Sept 2016) and Biologics (Feb 2016) (Slide 9, 12).
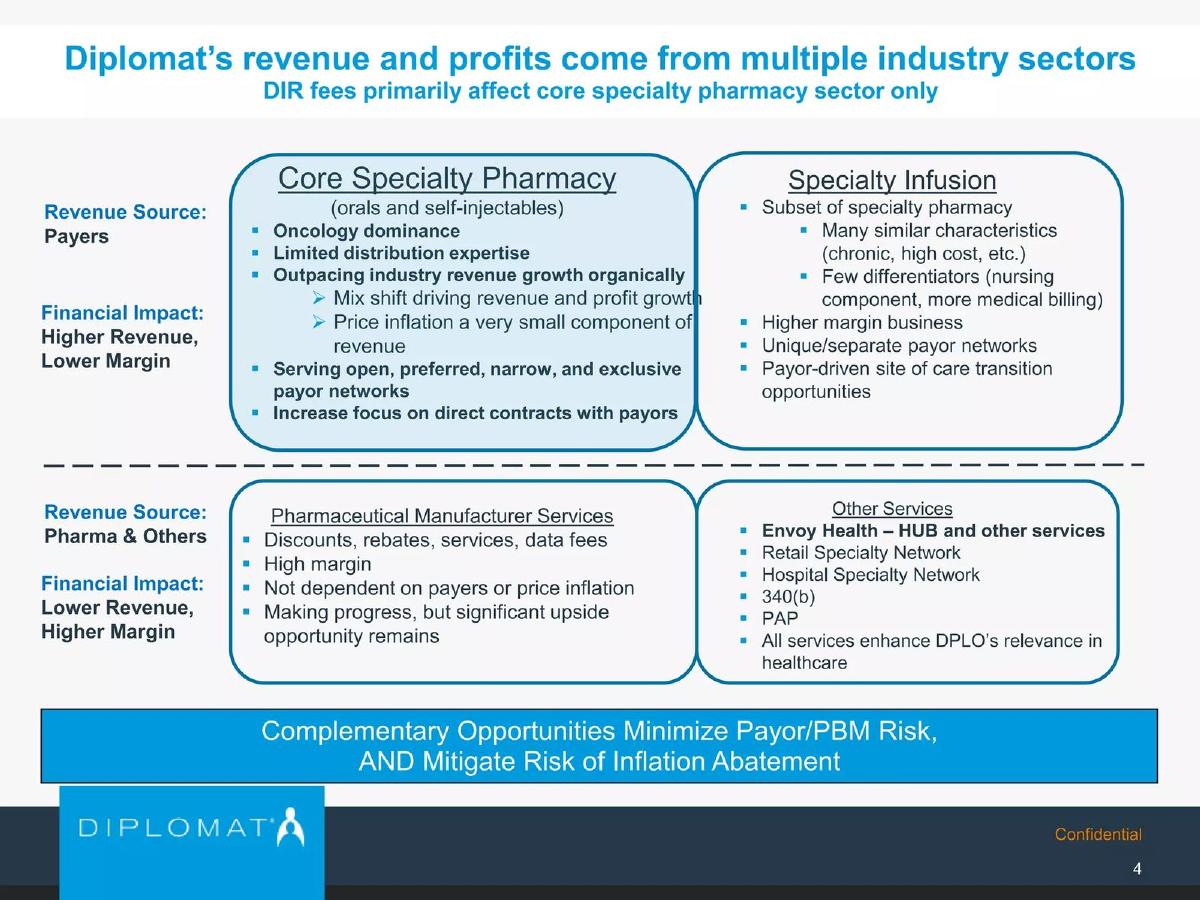
- Direct and Indirect Remuneration (DIR) fees are identified as a significant headwind, with an anticipated impact of $20-$30 million in 2017 (Slide 24).
- The business model relies on a 4% gross margin example, where a $10,000 revenue script yields $400 in gross profit (Slide 15).
- Total debt increased from $119 million at the end of 2015 to $154 million by September 30, 2016 (Slide 21).
Introduction and Patient Centricity
Slide 1: The Human Face of Specialty Pharmacy
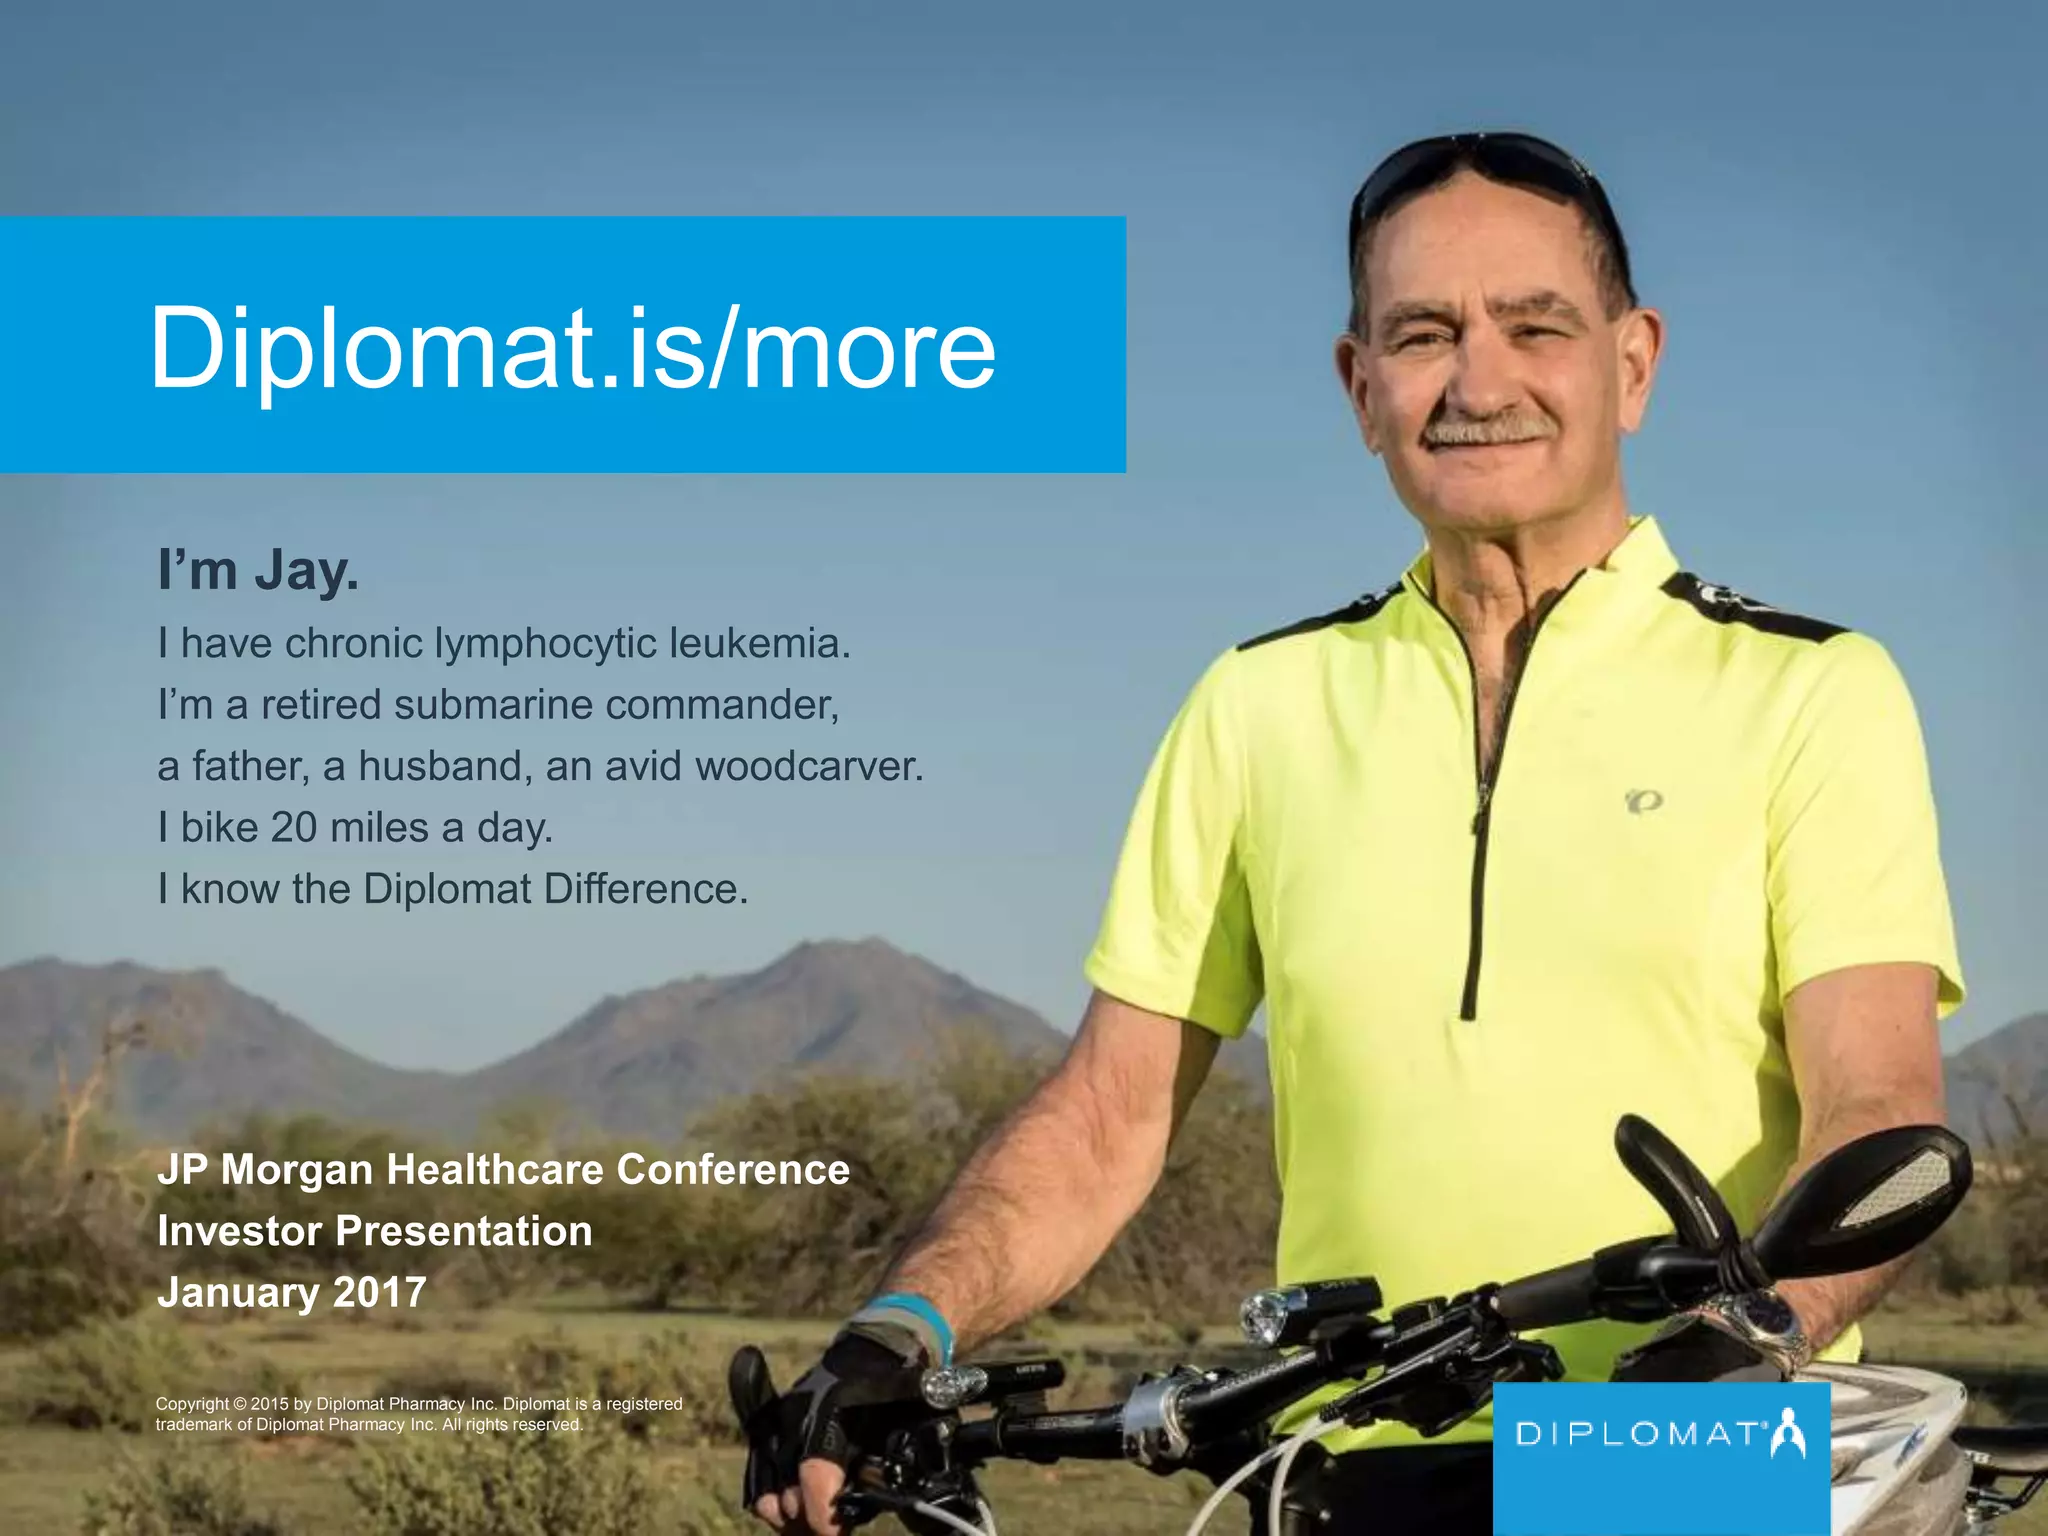
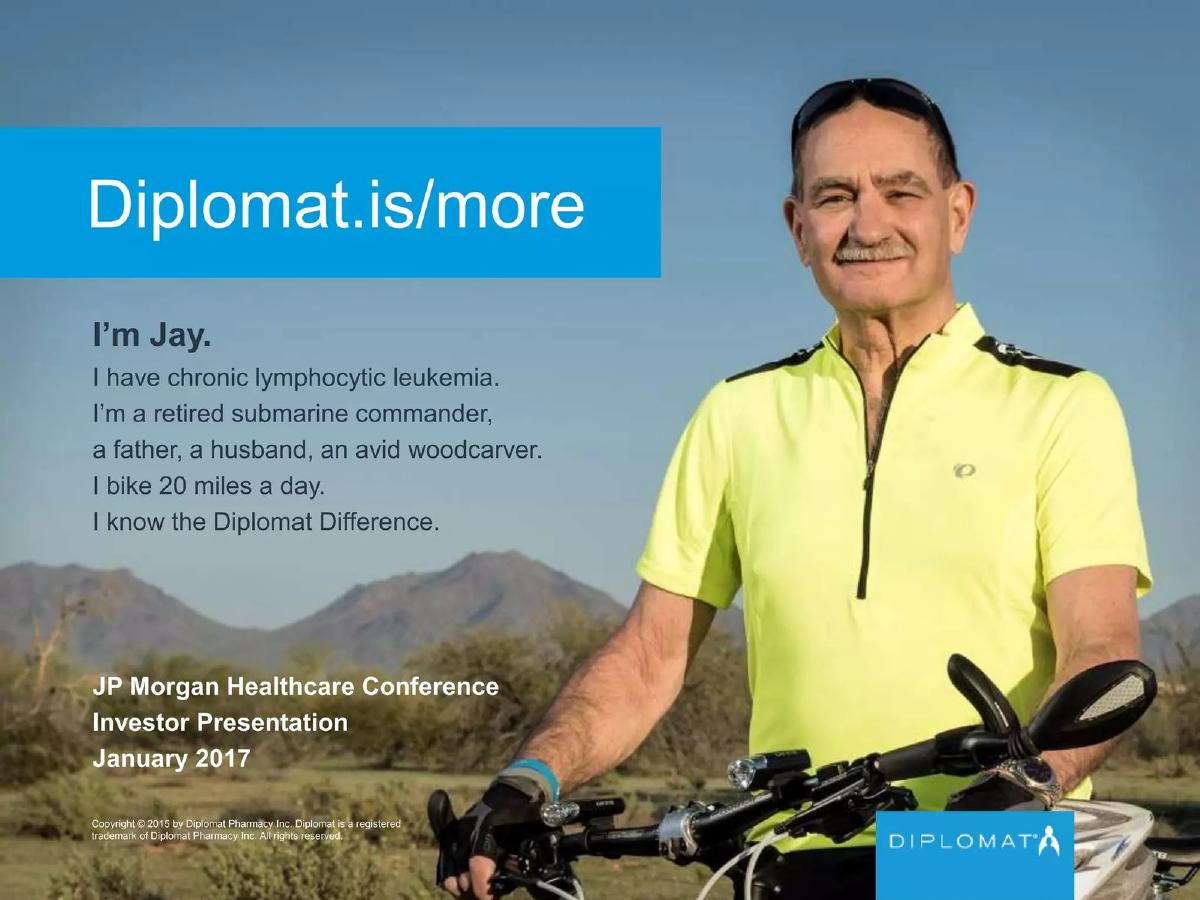
The deck opens with a full-page photo of 'Jay,' a patient with chronic lymphocytic leukemia. This is a classic healthcare industry tactic: humanizing the data. By listing Jay's personal details—retired submarine commander, avid woodcarver, cyclist—Diplomat establishes the 'Diplomat Difference' as something that enables a high quality of life for patients with severe illnesses. The slide notes this is for the JP Morgan Healthcare Conference in January 2017.
Corporate Overview and Market Position
Slide 3: Diplomat at a Glance
This is the 'traction' slide for a mature company. It establishes several critical facts: the company was founded in 1975, is headquartered in Flint, MI, and employs approximately 1,900 people. The most striking visual is the revenue chart showing a 62% CAGR from 2005 to 2015 , growing from $27 million to over $3.3 billion. They also provide a 2016 estimate of ~$4.5 billion. The market share pie chart places Diplomat at 3% of a $98 billion market, positioning them as a significant independent player behind giants like CVS Health (33%) and Express Scripts (25%).
Slide 6: Controlling the Patient Journey
This slide uses a circular flow diagram to show how Diplomat integrates into the healthcare ecosystem. It maps the journey from the patient visiting a physician to the payor approving the script, and finally, Diplomat dispensing the drug. Key value-add callouts include benefit verification, prior authorization, and clinical intervention . By positioning themselves at multiple touchpoints, they argue they 'control the journey,' which is a euphemism for being indispensable to the manufacturer and the payor.
Slide 9: Unique Competitive Position
Diplomat uses a 'sandwich' strategy visualization here. On one side are the 'Large PBM / Retail Pharmacy' players (CVS, Walgreens, OptumRx), which Diplomat claims are 'less flexible' and distracted by diversification. On the other side are 'Smaller Specialty Pharmacies' (Avella, BioPlus), which suffer from 'limited scale.' Diplomat places itself in the center, claiming to have the singular focus of a small player with the scalable infrastructure of a large one. This slide also lists recent acquisitions like ModernHealth (Sept 2016) and Biologics (Feb 2016) to prove their role as a market consolidator.
Strategic Growth and Unit Economics
Slide 12: Growth Strategy
The strategy is summarized in four bullet points. The most telling are the mentions of DIR fees . Diplomat explicitly states they want to expand direct contracts with payors and pursue M&A in areas 'unaffected by DIR fees.' This indicates that regulatory and contractual fee structures were a primary concern for the business at this time. They also mention growing their service offering and contracting with manufacturer partners to ensure service levels.
Slide 15: How We Make Money
This slide provides a rare, transparent look at specialty pharmacy unit economics. Using an 'illustrative example,' they show a script with an Average Wholesale Price (AWP) of $11,905 . After discounts, the revenue is $10,000. The Cost of Goods Sold (COGS) is $9,600, leaving a Gross Profit of $400 (4% Gross Margin) . The bottom half of the slide explains the 'mix shift' strategy. It shows that while traditional drugs might have a 10% margin, the absolute dollar profit is only $10. In contrast, 'Specialty Drug C' has only a 3% margin but generates $810 in gross profit . This justifies their focus on high-cost specialty medications.
Slide 18: Continued Growth in Profitability
This slide tracks 'Gross Profit / Script' from 2010 to 2016. The metric has climbed steadily from $71 to $280 (and $319 in the first nine months of 2016). This 19% growth in profit per script is the core of the investment thesis. It proves that even if margins are compressed, the 'mix shift' toward more expensive drugs and biosimilars is successfully driving bottom-line growth.
Financial Health and Disclosures
Slide 21: Balance Sheet / Cash Flow Snapshot
The financial snapshot compares September 30, 2016, to December 31, 2015. Cash dropped from $28 million to $17 million , while Total Debt rose from $119 million to $154 million . This increase in leverage is consistent with their aggressive M&A strategy mentioned earlier. Shareholders' equity increased from $516 million to $613 million, and Cash Flow From Operations remained stable at around $31 million for the period.
Slide 24: 2016 Normalized Income Statement
This slide breaks down performance by quarter for 2016. It highlights the impact of DIR fees. For example, in Q3 2016, the reported Gross Profit was $78.5 million, but the 'Normalized' figure (removing DIR fee impacts) was $82.5 million. The note at the bottom warns that they anticipate DIR fees of $20-$30 million in 2017 , which serves as a significant risk disclosure for investors.
Slide 27: Reconciliation of Net Income and Adjusted EBITDA
This is a dense disclosure slide explaining the various adjustments made to their financial reporting. It includes details on share-based compensation, restructuring charges, and impairment charges . Notably, it mentions a $932,000 write-down of a former headquarters facility in 2013 and a $4.8 million impairment related to Primrose Healthcare LLC in Q3 2016. These details are crucial for institutional investors performing due diligence on the quality of earnings.
What Works and What Is Missing
What Works
Clear Unit Economics: Slide 15 is exceptionally helpful. It demystifies a complex billing process and clearly explains why a 4% margin is actually better than a 10% margin in this specific industry context. · Market Positioning: The 'sandwich' visualization on Slide 9 effectively communicates why Diplomat is a 'Goldilocks' investment—not too big to be slow, not too small to lack reach. · Historical Growth: The 62% CAGR shown on Slide 3 is a powerful anchor for the rest of the presentation.
What is Missing
Management Team: In the 10 slides provided, there is no team slide. While this is an investor deck for a public or late-stage company, seeing the leadership behind the M&A strategy is usually standard. · Specific Competitive Data: While they name competitors, they don't provide a direct feature-by-feature or service-by-service comparison beyond general adjectives like 'nimble' or 'distracted.' · Future Revenue Guidance: While they provide a 2016 estimate, there is no multi-year forward-looking projection, likely due to the volatility of the DIR fees they mention.
Founder Takeaways
Master the 'Mix Shift' Narrative: If your business operates on low percentages but high absolute dollars, use Diplomat's Slide 15 as a template. Don't let investors get hung up on a low margin percentage if the absolute dollar contribution per customer is growing.
Address Regulatory Headwinds Head-On: Diplomat didn't hide the DIR fee issue. They named it, quantified it, and built a growth strategy (Slide 12) specifically to mitigate it. This builds credibility with sophisticated investors.
Humanize Complex B2B/B2G Models: Even in a multi-billion dollar pharmacy business, starting with a single patient's story (Slide 1) reminds the audience of the ultimate value created, which can soften the impact of a deck that is otherwise very heavy on technical financial reconciliations.
Frequently asked questions
- What is Diplomat's core value proposition compared to retail pharmacies?
- Diplomat differentiates itself through a 'high-touch model' and a singular focus on specialty pharmacy. Unlike large retail chains or PBMs (CVS, Walgreens) whose diversification might distract from specialty care, Diplomat claims to be more flexible and nimble. They focus on the entire patient journey, including clinical intervention, benefit verification, and adherence monitoring, which they argue provides higher service levels for complex chronic conditions.
- How does Diplomat maintain profitability despite low gross margins?
- The company relies on 'mix shift' and volume. While the gross margin percentage is low (averaging around 7-8%), the high cost of specialty drugs means the absolute dollar profit per script is high. For example, a specialty drug script might generate $305 in profit compared to just $10 for a traditional drug. By shifting their portfolio toward more expensive, complex medications, they increase their total gross profit dollars.
- What role does M&A play in Diplomat's business strategy?
- M&A is central to Diplomat's growth. The deck highlights several acquisitions between 2013 and 2016, including TNH, BioRx, MedPro Rx, Biologics, and ModernHealth. These acquisitions allow Diplomat to consolidate a fragmented market of smaller specialty pharmacies that lack national scale. They specifically target acquisitions in areas unaffected by DIR fees to protect their bottom line.
- What are DIR fees and why are they prominent in the financials?
- Direct and Indirect Remuneration (DIR) fees are payments made by pharmacies to PBMs after the point of sale. In the 2016 normalized income statement, Diplomat shows these fees have a significant impact on the bottom line. They anticipated these fees would grow to $20-$30 million in 2017, necessitating a strategy to expand direct contracts with payors not affected by these specific fee structures.
- What is the geographic footprint of the company as of early 2017?
- Diplomat is headquartered in Flint, Michigan, but maintains a national footprint. The deck lists pharmacy locations in 15 states, including major markets like California, Florida, Texas, Illinois, and Pennsylvania. This national reach is used as a competitive advantage against smaller specialty pharmacies that are typically limited to one or a few disease states or geographic regions.