The 2020 7bridges deck presents a compelling case for a 'unified, AI powered logistics platform' to solve the massive inefficiencies in global supply chains. By highlighting the 'unbundling' of logistics—where a formerly consolidated market (represented by FedEx) has fragmented into hundreds of specialized startups—7bridges positions itself as the necessary orchestration layer. The deck's strength lies in its clear articulation of the three-layer platform model (UI, AI Engine, Ecosystem) and the founder-market fit of its leadership team. However, the presentation is quantitatively light on in…
Key takeaways
- The platform positions itself as an 'orchestration layer' rather than a carrier, sitting on top of the fragmented logistics ecosystem.
- Claims significant efficiency gains, including 50% lower logistics costs and 90% less time spent on shipping administration.
- The 'Why Now' centers on the 'API-ification' of logistics providers, allowing software to finally automate previously manual processes.
- The team possesses strong domain expertise, combining backgrounds from World Courier, IBM Big Data, and enterprise engineering.
- The deck relies heavily on older macro-market data (2016/2017) and lacks internal traction metrics like revenue or customer logos.
- The product vision includes a 'digital twin' of global logistics to enable real-time combinatorial optimization.
What this deck actually is
The 7bridges deck is a 2020 Seed or Series A-leaning bridge presentation focused on the "unbundling of logistics" and the transition from rules-based software to AI-driven optimization. It positions itself as an orchestration layer—a "unified, AI powered logistics platform"—that sits atop a fragmented ecosystem of carriers and tech providers. The single most important finding in this deck is its emphasis on technological defensibility over market traction . At a time when the logistics space was becoming crowded with digital freight forwarders (like Flexport) and last-mile delivery tech (like Deliveroo or Starship), 7bridges attempts to claim the "brain" of the operation: the data and optimization engine that coordinates these disparate services.
Quantitatively, the deck relies heavily on macro-economic stats (citing 2016 and 2017 reports from BCG and Capgemini) to validate its £2.2 trillion market opportunity, but it is notably silent on internal performance metrics. There are no mentions of current Revenue, Monthly Recurring Revenue (MRR), Customer Acquisition Cost (CAC), or specific pilot results beyond general claims of "50% lower logistics costs." The deck defines its scope as covering "Outsourced parcels, LTL, freight forwarding, air, specialty, truck/container loads, warehousing," yet provides no evidence of which of these sectors it has successfully penetrated. This suggests the deck is designed to sell a vision of a "digital twin of global logistics" to investors who are already convinced of the sector's inefficiency but are looking for a platform-level play rather than another service-heavy logistics provider.
Slide-by-slide walkthrough
Slide 1: Title and Tagline
The opening slide features a teal background with a 3D isometric logo combining the number '7' and the letter 'b'. The text states that the 7bridges platform "unleashes the power of logistics" by transforming "outdated, rules-based processes into agile, automated systems that continuously adapt to change." It establishes the core value proposition immediately: moving from rigid rules to adaptive automation through "smart technology."
An investor reads this and identifies the company as a "Logistics SaaS" or "Supply Chain Orchestration" play. The phrasing "transforming outdated, rules-based processes" signals that the founders believe the current market solutions—likely legacy Enterprise Resource Planning (ERP) or Transportation Management Systems (TMS)—are too brittle for modern commerce. The isometric design language is a common visual shorthand for "modern cloud infrastructure," suggesting a high-tech, scalable software solution rather than a logistics brokerage. However, the phrase "unleashes the power of logistics" is a high-level marketing platitude that lacks a specific hook or unique selling point (USP) until the reader moves further into the deck.
The strongest version of this slide would include a one-sentence "traction teaser" if the company has it. While the tagline is functional, it is abstract. A stronger opening would be: "7bridges: The AI-driven logistics platform reducing shipping costs by 50% for [X] enterprise customers." By adding a concrete outcome and a hint of validation to the very first page, the company would set a high bar for the technical slides that follow. As it stands, the slide relies entirely on the aesthetic of the 3D logo and the promise of "agility" to hold the investor's interest.
Slide 2: The Macro Problem
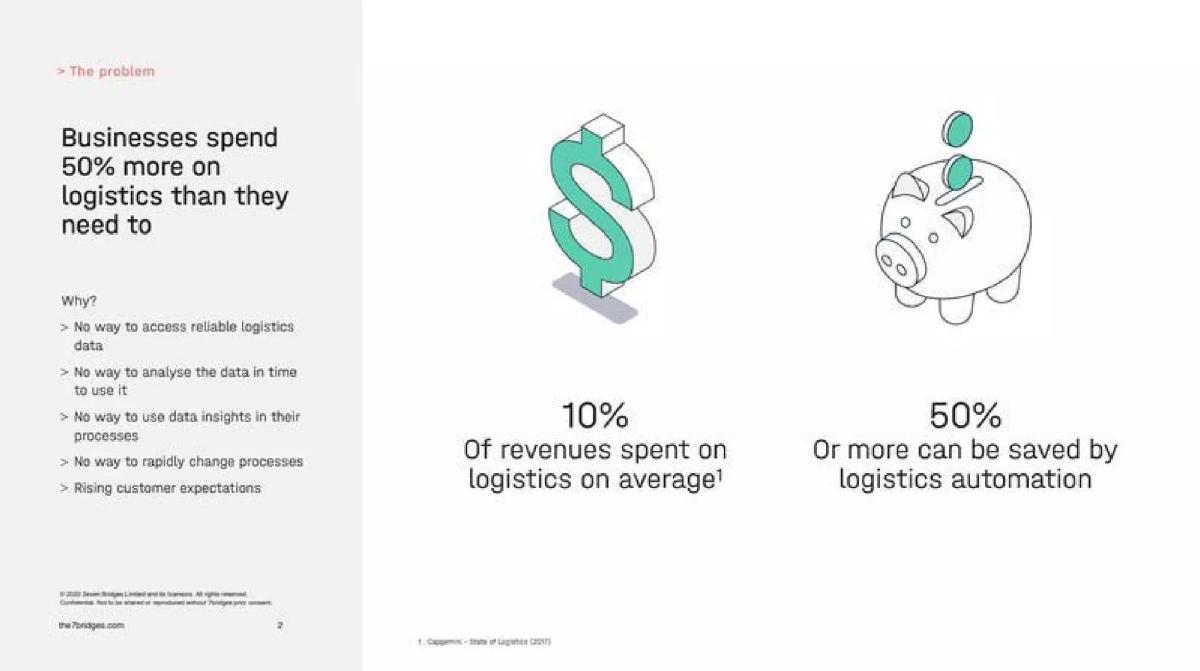
Slide 2 identifies the financial pain point: businesses spend 50% more on logistics than they need to. It lists five "Why" factors: "No way to access reliable logistics data," "No way to analyse the data in time to use it," "No way to use data insights in their processes," "No way to rapidly change processes," and "Rising customer expectations." It cites a 2017 Capgemini report stating that 10% of revenues are spent on logistics on average and claims that "50% Or more can be saved by logistics automation." Visually, it uses a grey sidebar and isometric icons of a dollar sign and a piggy bank.
Investors look for the "so what" in a problem slide. Here, the "so what" is the 50% waste. By quantifying the inefficiency (10% of revenue spent, 50% of which can be saved), the deck establishes the potential ROI for a customer. If a company does £100M in revenue, they spend £10M on logistics, and 7bridges claims to save them £5M. This makes the "Sales Velocity" potential clear: the software should, in theory, pay for itself many times over. However, citing a 2017 report in a 2020 deck feels slightly dated. In the three years between the report and the deck, the "Rising customer expectations" mentioned in the bullet points likely intensified, making the 2017 data a conservative or potentially obsolete baseline.
The strongest version of this slide would replace the generic 2017 Capgemini stats with a specific case study or a "Bottom-Up" calculation of the problem based on 7bridges' own data. Instead of saying "Businesses spend," the slide should say "Our current customers were spending..." This shifts the problem from a theoretical industry observation to a validated market reality that the company is already solving. Furthermore, the slide lists "No way to access reliable logistics data" as the first hurdle; a stronger slide would demonstrate exactly why current systems fail to provide this reliability (e.g., siloed data, manual entry errors) rather than just stating the absence of it.
Slide 3: The Ecosystem Problem (Unbundling)
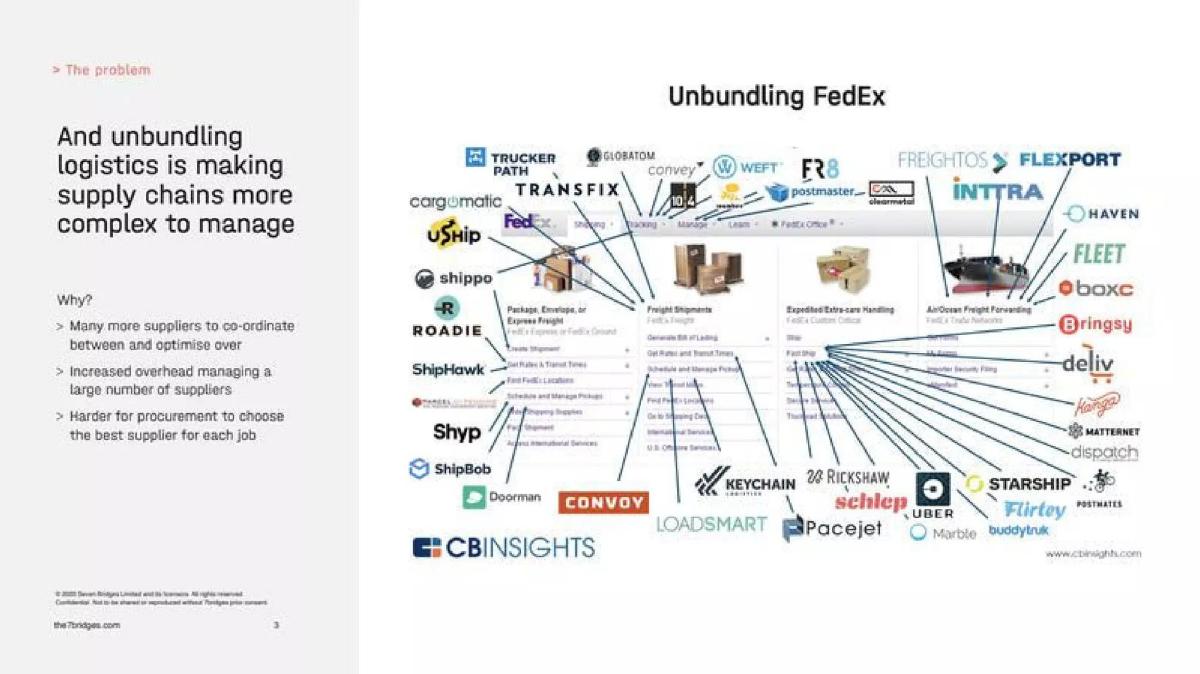
This slide focuses on "unbundling," arguing that supply chains are becoming more complex because there are "Many more suppliers to co-ordinate between and optimise over." It features a large graphic from CBInsights showing a FedEx interface surrounded by dozens of logos—ranging from Flexport and Convoy to Starship and Postmates—connected by blue lines. The sidebar notes that this complexity leads to "Increased overhead managing a large number of suppliers" and makes it "Harder for procurement to choose the best supplier for each job."
To an investor, this slide is a "Market Validation" slide. By showing a sea of competitors and specialized services, 7bridges isn't saying "we are one of these"; they are saying "all of these companies make the problem harder for the customer, and we are the layer that sits on top." This is a classic "Aggregator" or "Orchestrator" pitch. It acknowledges that while FedEx used to be a one-stop shop, the market has fragmented, creating a new need for a "Unified Interface" (UI). It positions the company as a solution to the "Paradox of Choice" in logistics. However, the reliance on a third-party graphic from CBInsights suggests the founders are leaning on external analysts to frame their narrative rather than presenting their own proprietary view of the market map.
The strongest version of this slide would explicitly categorize the logos into the three layers mentioned later in the deck. For example, it could show "Last Mile" logos, "Freight" logos, and "Data" logos, then visually overlay the 7bridges "Unified Layer." The current slide leaves the reader to do the mental work of connecting the "Unbundling FedEx" graphic to the 7bridges solution. The slide would be more powerful if it showed how 7bridges specifically integrates with the logos shown—like Uber, Flexport, or Deliveroo—to create a "best-of-breed" supply chain for a real-world client, rather than just showing a web of logos.
Slide 4: The Solution (The Three Layers)
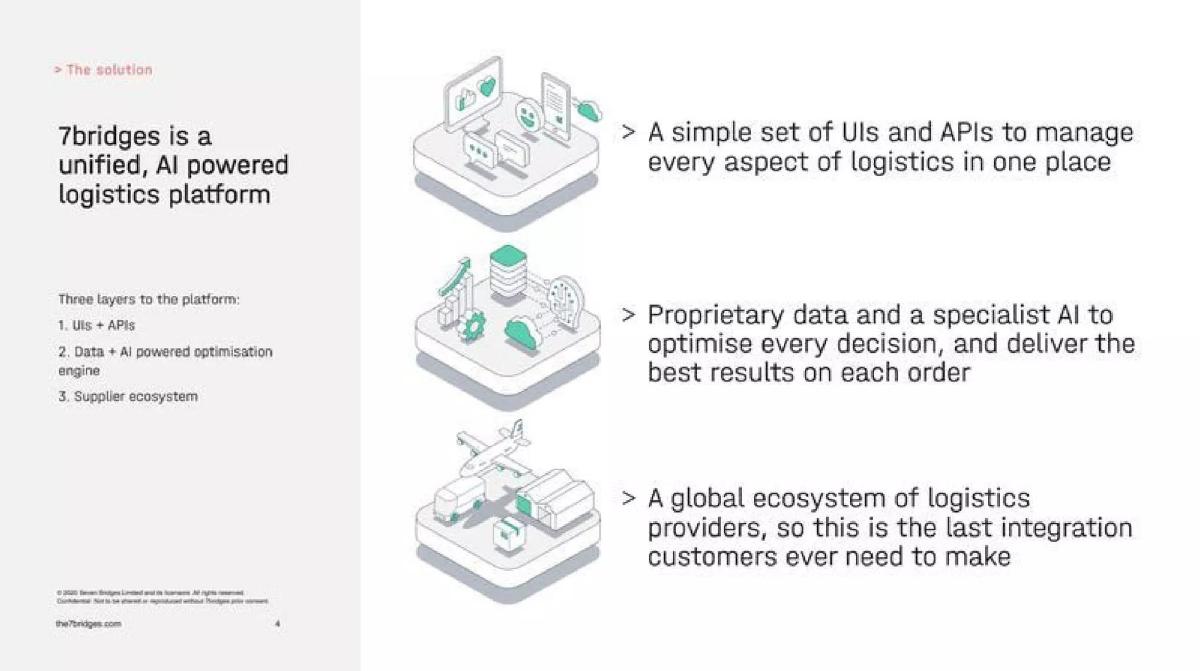
Slide 4 introduces the 7bridges solution as a "unified, AI powered logistics platform" consisting of three layers: 1. "UIs + APIs," 2. "Data + AI powered optimisation engine," and 3. "Supplier ecosystem." It promises that this is the "last integration customers ever need to make" because it provides a "global ecosystem of logistics providers." The sidebar claims the engine will "optimise every decision, and deliver the best results on each order."
Investors examine the "moat" here. The second layer—the "Data + AI powered optimisation engine"—is the supposed proprietary advantage. The promise of a "last integration" is a powerful value proposition for enterprise CTOs who suffer from "integration fatigue." However, the slide is light on how the "proprietary data" is actually acquired. Does 7bridges own the data, or do they just process the customer's data? The "Supplier ecosystem" suggests they might be acting as a marketplace or a reseller, which has different margin implications than a pure SaaS play. An investor would question if the "Supplier ecosystem" is an actual network of pre-negotiated contracts or simply a library of API connectors.
The strongest version of this slide would provide a simplified schematic of how data flows through these three layers in real-time. Specifically, it should explain the "Optimization Engine" in more than just buzzwords. Is it using reinforcement learning? Genetic algorithms? By being slightly more specific about the "AI," the company can move away from generic claims and toward technical credibility. A screenshot of the "UIs" layer would also be more effective than the isometric icon to prove the product is a functional platform that exists today.
Slide 5: The Value Unlock
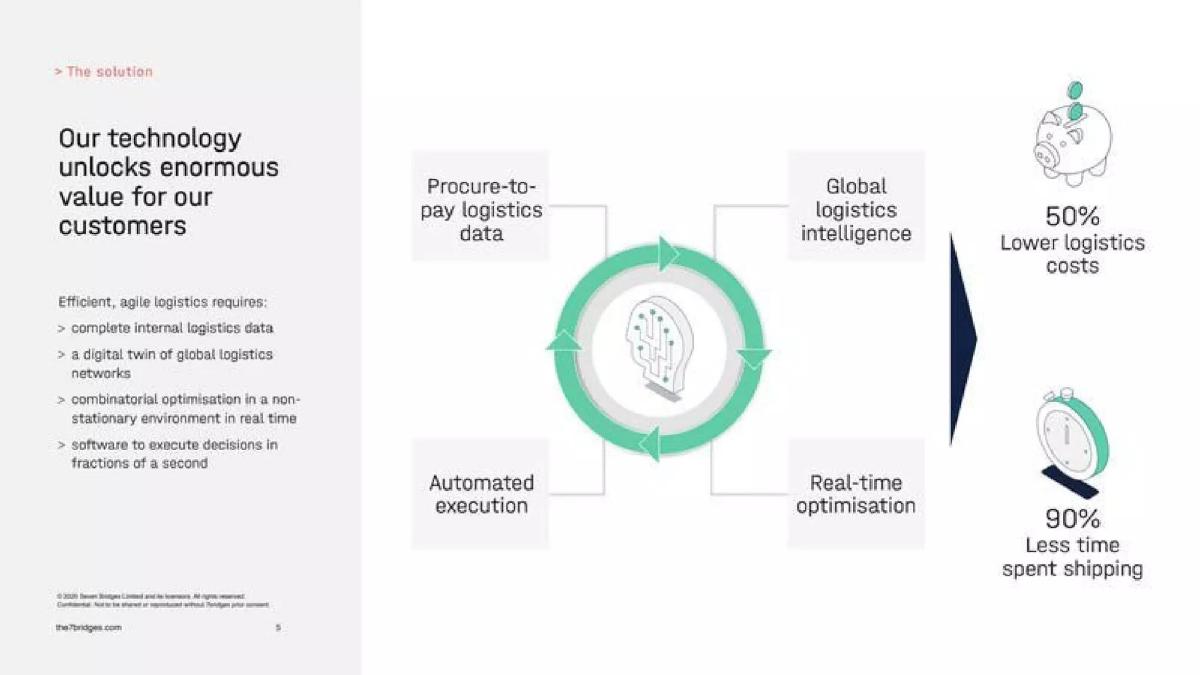
This slide lists the technical requirements for efficient logistics: "complete internal logistics data," a "digital twin of global logistics networks," "combinatorial optimisation in a non-stationary environment in real time," and "software to execute decisions in fractions of a second." It features a circular flow diagram with quadrants for "Procure-to-pay logistics data," "Global logistics intelligence," "Automated execution," and "Real-time optimisation." It reiterates two primary outcomes: "50% Lower logistics costs" and "90% Less time spent shipping."
The mention of a "digital twin" is a high-level concept that appeals to enterprise investors interested in Industry 4.0. It suggests that 7bridges creates a virtual model of the customer's supply chain to run simulations before real-world execution. The "90% less time spent shipping" is a bold claim that likely refers to the administrative time spent booking and managing shipments rather than the transit time of the physical goods. However, the slide fails to define what "non-stationary environment" specifically means in their context—is it fluctuating fuel prices, weather disruptions, or carrier capacity shifts? Without this detail, the technical language feels like filler.
The strongest version of this slide would clarify the "90% less time" metric with a "Before vs. After" table. Does this mean "90% reduction in man-hours for the logistics team" or "90% faster shipping times"? These are vastly different value propositions. Furthermore, the slide should explain how the digital twin is built and maintained. Does it require months of manual data cleaning, or is it automated? The "Time to Value" is a critical metric for enterprise SaaS that is missing here, and addressing it would significantly strengthen the case for the platform's efficiency.
Slide 6: Why Now?
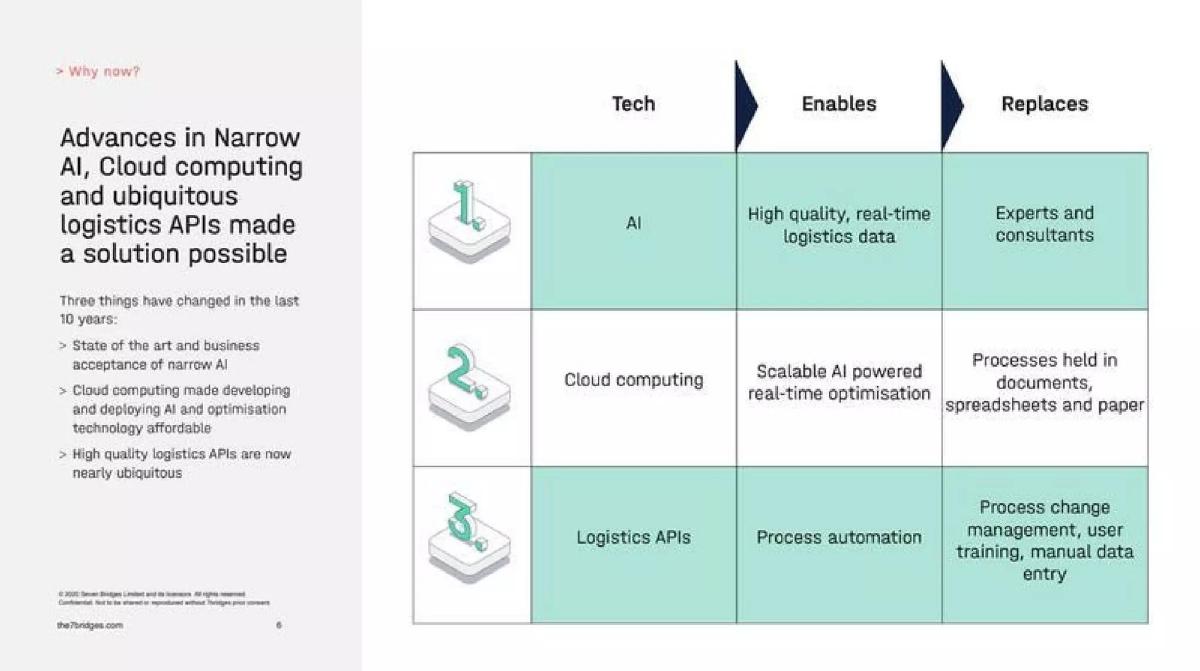
Slide 6 argues that three technological shifts have made 7bridges possible: the maturity of "Narrow AI," affordable "Cloud computing," and the ubiquity of "high quality logistics APIs." It includes a 3x3 grid showing how these technologies "Enable" certain functions and "Replace" manual ones. For instance, AI enables "High quality, real-time logistics data" and replaces "Experts and consultants," while Logistics APIs enable "Process automation" and replace "manual data entry" and "user training."
The "Why Now" is a critical component because it explains why this wasn't built five years ago. 7bridges correctly identifies that the "API-ification" of carriers is the prerequisite for their platform. If the carriers didn't have APIs, 7bridges couldn't automate them. The grid is an effective way to show the transition from "Human-centric" to "System-centric" management. It positions the product as an inevitable evolution. However, the claim that AI replaces "Experts and consultants" is a heavy lift that requires proof of a highly sophisticated decision engine that can handle the edge cases those experts usually manage.
The strongest version of this slide would include a timeline or a "Before vs. After" of the API landscape. For example, "In 2015, only 10% of top carriers had public APIs; today, 95% do." This quantitative shift provides a much stronger "inflection point" than the general statement that APIs are "nearly ubiquitous." It would also benefit from mentioning the rise of e-commerce volumes in 2020, which increased the necessity of these tools due to sheer volume, not just their technological possibility.
Slide 7: Market Size
This slide quantifies the Addressable Market (TAM) at £2.2 trillion, growing at 4.6% annually. It breaks this down into four tiers: "Global" (£2.2trn), "North America and Europe" (£1trn), "Europe" (£151bn), and "UK" (£12bn). The data is sourced from a 2016 BCG report. It uses nested circles to visually represent these segments, with the UK market being the smallest circle and the Global market the largest. It defines the scope as "Outsourced parcels, LTL, freight forwarding, air, specialty, truck/container loads, warehousing."
Investors often find £2T+ TAMs to be unhelpful because they represent the total spend on the physical movement of goods, not the software used to manage it. 7bridges is a software platform, not a shipping company. Therefore, their TAM isn't the £2.2T spent on trucks and ships; it's the percentage of that spend allocated to management software and orchestration fees. By presenting the total logistics spend as their addressable market, the founders risk looking like they haven't calculated their actual revenue potential (the Serviceable Obtainable Market, or SOM).
The strongest version of this slide would present a "Bottom-Up" TAM. This involves taking the number of potential enterprise customers (e.g., 50,000 mid-to-large retailers) and multiplying it by the average annual contract value (ACV) of the 7bridges software. This tells an investor how big the business can get, rather than how big the industry is. Additionally, using a 2016 report in a 2020 deck is a significant weakness; the global logistics spend and growth rates changed dramatically in 2020, making 2016 figures feel historical rather than relevant.
Slide 8: The Team
The team slide features the three founders: Philip Ashton (CEO), Matei Beremski (CPO), and Ben Ede (CTO). Philip's background includes being "Head of business intelligence and special projects at World Courier" and a "Consultant at Oliver Wyman." Matei was a "Senior consultant in IBM’s Big Data and Analytics Group" and an analyst at "BNP Paribas." Ben Ede, the CTO, is described as having "12 years working with enterprise businesses" like BMW, The World Bank, and the UNHCR, and was previously "Head of Engineering at Savvy."
This is a strong "Founder-Market Fit" slide. The CEO has domain expertise from World Courier (a specialty logistics firm), the CPO has a "Big Data" and quantitative pedigree (IBM, Oxford Math), and the CTO has engineering and enterprise experience. Investors look for this trifecta: Domain Knowledge + Technical Depth + Scaling Ability. The academic credentials from Cambridge and Oxford provide institutional credibility. However, the slide doesn't mention how long the team has been working together on 7bridges, which is a key indicator of team stability.
The strongest version of this slide would include the team's "secret weapon." Why are these three the only people who can build a digital twin of global logistics? While their resumes are impressive, the slide doesn't mention any specific shared history or a singular technical breakthrough they achieved. Adding a "Founding Story"—perhaps a specific multi-million dollar waste event Philip saw at World Courier that inspired the company—would make the team's motivation and the platform's necessity feel more tangible.
Slide 9: The Ask and Growth
The final slide returns to the teal background and 3D logo with the text: "7bridges Raising capital to accelerate growth." It includes the website URL and a standard copyright and confidentiality disclaimer for "Seven Bridges Limited." It does not specify the amount being raised, the valuation, or the intended use of funds beyond the generic "accelerate growth."
In a standard pitch deck, the "Ask" slide should be a call to action with specific goals. Saying "Raising capital" is a missed opportunity to set the terms of the conversation. Investors want to see a clear plan: "We are raising £XM to achieve [Milestone A], [Milestone B], and [Milestone C]." Without this, the deck feels like a general teaser or a networking tool rather than an active fundraising instrument. It also leaves the stage of the round (Seed vs. Series A) ambiguous, requiring the investor to guess the company's maturity based on the team's seniority alone.
The strongest version of this slide would explicitly state the funding target (e.g., "Raising £5M") and provide a 12-to-18-month roadmap. This roadmap should include hiring targets (e.g., "expanding sales team by 10"), product milestones (e.g., "launching ocean freight module"), and revenue goals. It should also restate the "Why" one last time: "Join us in automating the £2.2T logistics market." By ending on a generic note, the deck loses the momentum built by the "Value Unlock" and "Team" slides.
Concrete fixes in priority order
Inject Real Traction Data: The most glaring omission is the absence of current performance. The deck needs a slide showing Revenue growth, customer logos, or at least the number of "active shipments" processed by the platform to prove it isn't just "vaporware." Even "50% lower costs" needs to be tied to a specific customer example to be believable. · Update Market and Problem Stats: Citing 2016 and 2017 reports in 2020 makes the founders look disconnected from current events. Use 2019/2020 data to show how the "Why Now" is even more urgent given the supply chain disruptions of the early 2020s. · Define the SaaS TAM: Replace the £2.2T "Logistics Spend" TAM with a "Logistics Software" TAM. Show the ACV (Annual Contract Value) and the number of target customers to demonstrate a realistic path to £100M+ in revenue, rather than claiming a piece of every truck shipment on earth. · Specify the "Ask": Add a slide detailing how much capital is being raised and the specific milestones it will unlock. "Accelerate growth" is too vague; "Scale to 50 enterprise customers and £2M ARR" is a fundable goal that gives investors a way to measure success. · Show the Product: Replace isometric icons (UIs, Data, Global) with actual product screenshots or a simplified dashboard view. For a solution promising "Unified UIs," showing the "UI" is a requirement to prove the "simplicity" and "agility" of the platform. · Clarify the "Proprietary Data": Explain where the data in the "Optimization Engine" comes from. If the platform's value relies on "proprietary data," investors need to know how that data is sourced, how it's cleaned, and why a competitor can't just buy the same data from a provider like Flexport or project44.
Frequently asked questions
- How much money does 7bridges claim to save businesses?
- The deck claims businesses spend 50% more than necessary on logistics, with 10% of total revenue typically spent on logistics costs, 50% of which can be saved through automation.
- What are the three layers of the 7bridges platform?
- 7bridges identifies three layers: a Unified UI/API layer for management, a Data + AI powered optimization engine for decision-making, and a global Supplier Ecosystem to eliminate the need for further integrations.
- What is the addressable market size for 7bridges?
- The deck defines its TAM as the £2.2 trillion global logistics spend (citing BCG 2016), with a UK-specific addressable market of £12 billion in outsourced courier, express, and parcels (CEP).
- Why does 7bridges focus on 'unbundling' in logistics?
- 7bridges argues that 'unbundling' (the rise of many specialized logistics startups) has made supply chains too complex to manage manually, creating a need for a unified orchestration layer.
- What technological shifts does 7bridges cite as the reason for its timing?
- The deck cites three factors: the maturity of Narrow AI, the affordability of Cloud computing for scaling optimization, and the near-ubiquity of high-quality logistics APIs from carriers.