Andean American Gold (TSX.V: AAG) uses this 23-slide deck to position its Invicta project as a near-production asset with superior economics compared to its peers. The presentation is heavy on technical validation, citing a July 2010 feasibility study that projects an average annual production of 160,857 gold equivalent ounces. A critical component of the deck is the disclosure of a strategic relationship with Trafigura, which includes a $15M sub-debt facility and off-take agreements. By highlighting a negative by-product cash cost of ($126.91) per ounce, the company attempts to demonstrate t…
Key takeaways
- The management team features deep institutional experience, including David Rae's ten-year tenure at Falconbridge/Xstrata (Slide 4).
- Geographic positioning is emphasized by showing the Invicta project's proximity to numerous established production and exploration projects in Peru (Slide 7).
- Resource validation is categorized into Measured, Indicated, and Inferred, totaling over 24 million tonnes of material (Slide 10).
- The feasibility study projects a remarkably short 1-year payback period on an estimated $68M CapEx (Slide 16).
- Operating costs are estimated at $28.31 US per tonne, with zero liquid effluents to meet environmental standards (Slide 16).
- A strategic partnership with Trafigura provides a $15M debt facility and a potential path to full project underwriting (Slide 19).
- The company claims a negative by-product cash cost of ($126.91) per ounce, suggesting the non-gold metals cover all production costs (Slide 22).
- Valuation metrics show Andean American trading at $122M MCAP, which is framed as a deep discount relative to its $65M estimated annual free cash flow (Slide 22).
Executive Summary and Visual Identity
Slide 1: Title and Branding
The deck opens with a high-resolution landscape photograph of the Peruvian Andes, immediately establishing the geographic focus of the company. The branding is clean, featuring the 'Andean American Gold' logo. Notably, the slide includes the company's ticker symbol (TSX.V: AAG) and website, signaling that this is a public company presentation intended for the capital markets. The visual language is professional and industry-standard for junior miners.
Leadership and Technical Expertise
Slide 4: Management Team
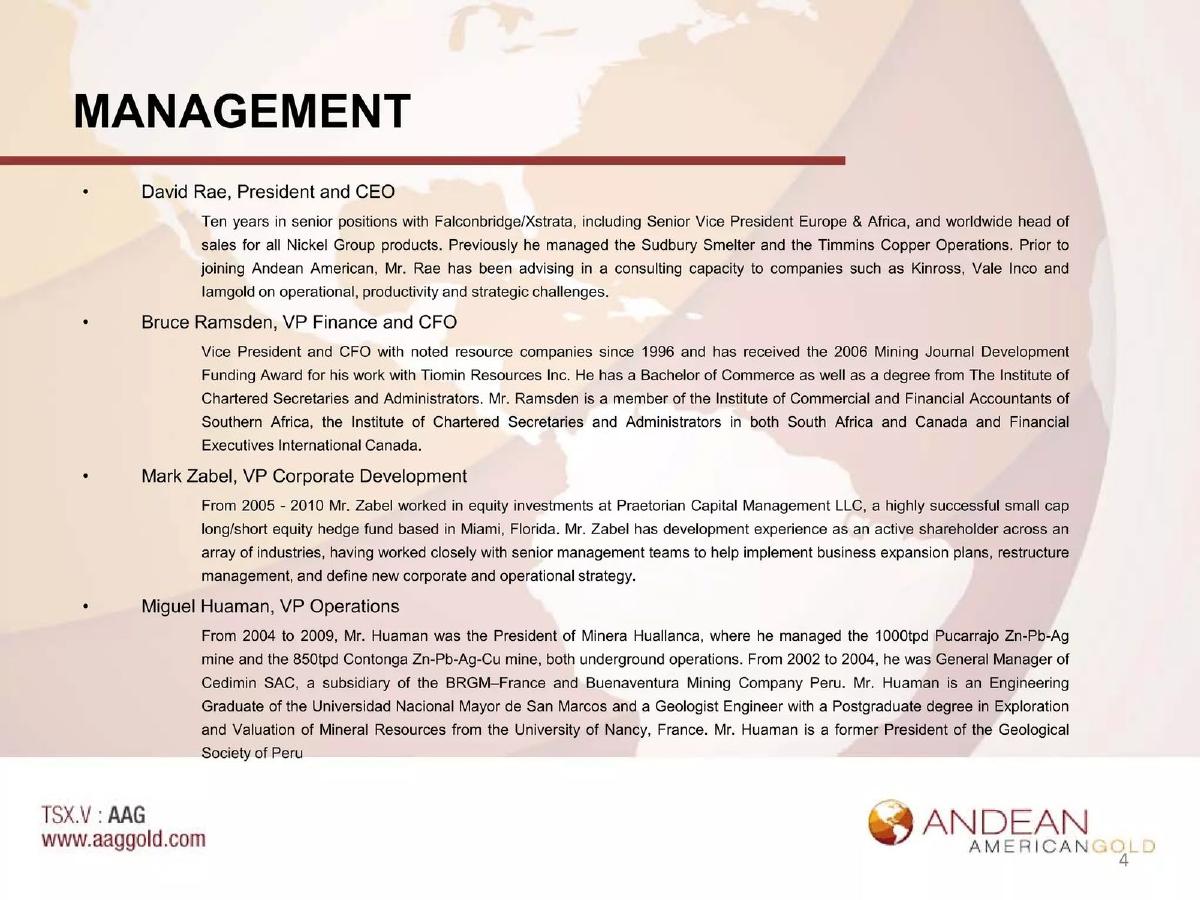
Mining is a capital-intensive industry where management pedigree is a primary filter for investors. Slide 4 lists four key executives. David Rae (President and CEO) is highlighted for his ten years at Falconbridge/Xstrata, specifically his role as worldwide head of sales for Nickel Group products. Bruce Ramsden (VP Finance and CFO) is credited with a 2006 Mining Journal Development Funding Award, which speaks directly to his ability to raise capital. Mark Zabel (VP Corporate Development) brings hedge fund experience from Praetorian Capital Management, and Miguel Huaman (VP Operations) provides local operational expertise, having managed the Pucarrajo and Contonga mines in Peru. The bios emphasize operational success and financial structuring rather than just geological exploration.
Geographic and Resource Context
Slide 7: Project Location and Proximity
Slide 7 uses a map of Peru to contextualize the Invicta project. The slide identifies 'Mines and exploration projects near Invicta,' using red triangles for exploration and yellow circles for production. By showing Invicta surrounded by established names like Atacocha, Milpo, and Cerro de Pasco, the company utilizes 'closeology'—the principle that being near proven deposits increases the likelihood of project success. This slide serves to de-risk the location by showing it is in a mature mining district with existing infrastructure.
Slide 10: Reserves and Resources
This is a data-heavy slide essential for any mining teardown. It breaks down the mineral inventory into three standard categories: Measured, Indicated, and Inferred. Measured resources are listed at 868,000 tonnes with a gold grade of 2.71 g/t. Indicated resources are significantly larger at 9,866,735 tonnes at 1.99 g/t gold. The table also tracks Silver, Copper, Lead, and Zinc. A second table focuses on 'Mineable Reserves - First 5 years,' totaling 7,807,157 tonnes. This distinction is vital; it shows the investor exactly what the company intends to extract in the immediate term (538,946 Oz of gold and over 4.7M Oz of silver).
Technical Infrastructure
Slide 13: 3D View – Tailings/Plant/Mine
Slide 13 provides a topographical 3D model of the site. It labels the 'Concentrate Plant,' 'Tailing' area, 'Mine,' and the 'Main Road from Choques to Plant.' The inclusion of elevation markers (M.a.s.l. ranging from 1100 to 3400) provides a sense of the engineering challenges and logistical requirements. For a technical investor, this slide confirms that site planning has moved beyond theory into spatial design.
Economic Projections
Slide 16: Feasibility Study Results
This is the 'money slide' of the deck. It summarizes the July 2010 Feasibility Study. Key figures include an Average Annual Production of 160,857 Oz Gold Equivalent and an Estimated CapEx of $68M . The CapEx is further broken down: $49M for project costs, $9M in refundable taxes, $7M in contingency, and $3M for a startup facility. The most aggressive claim is the 1 Year Payback period. The slide also notes a 'by-product basis' cash cost of ($126.91) US , implying that the sale of non-gold metals covers all costs and generates a surplus before a single ounce of gold is accounted for. The footnote specifies the price deck used: Gold at $900/oz and Silver at $12.50/oz, which provides a baseline for sensitivity analysis.
Strategic Alliances and Market Positioning
Slide 19: Relationship with Trafigura
Slide 19 details a partnership with Trafigura, described as the '2nd largest non-ferrous trading company in the world.' The agreement includes a $15M USD Sub Debt Facility and off-take rights for all base metal concentrates. The slide outlines a 'fail-safe' mechanism: if project debt lenders do not fund CapEx by January 31st, Trafigura has the option to underwrite the debt and increase their stake. This is a powerful de-risking signal; having a multi-billion dollar commodity trader as a backstop suggests deep due diligence has already been performed by a sophisticated counterparty.
Slide 22: Company Comparisons
The final slide in this selection is a relative valuation table. It compares Andean American to peers like Timmins Gold, Brigus Gold, and Alamos Gold. The 'Average' peer trades at a 15.61x multiple of estimated annual free cash flow. In contrast, Andean American is shown trading at a 1.9x multiple ($122M MCAP vs. $65M Est. Annual Free Cash Flow). The slide explicitly points out the 'Estimated By-Product Cash Cost / Oz' of ($126) for AAG compared to the peer average of $408. This table is designed to trigger a 'value buy' response from investors by highlighting a massive valuation gap.
What Works in This Deck
1. Technical Rigor: The deck does not rely on vague promises. It cites a specific feasibility study (July 2010) and provides granular data on grades, tonnages, and CapEx breakdowns. This is exactly what institutional mining investors require.
2. Clear De-Risking: The Trafigura slide (Slide 19) is the strongest part of the narrative. By showing that a major global player has already committed capital and off-take agreements, the company moves from a 'speculative explorer' to a 'near-term producer with institutional backing.'
3. Economic Transparency: Breaking down the cash costs into co-product, gold-equivalent, and by-product bases (Slide 16) allows investors to understand how the company's multi-metal strategy protects them against fluctuations in the gold price.
What Is Missing
1. Social License Details: While the deck mentions environmental standards, it lacks a slide on community relations. In Peruvian mining, social unrest is often a bigger risk than geological failure. The deck would benefit from showing signed community agreements or social investment programs.
2. Timeline to Production: We see a '1 Year Payback' and 'First 5 years' of reserves, but the deck (in this selection) lacks a Gantt chart or milestone timeline showing exactly when construction starts and when the first pour is expected.
3. Capital Structure: While the market cap is mentioned on Slide 22, a dedicated slide showing shares outstanding, warrants, options, and major shareholders (beyond Trafigura) is missing from this selection. Investors need to know the dilution risk.
Founder Lessons
Quantify Your Competitive Advantage: Andean American doesn't just say they are 'low cost.' They use the 'By-Product Cash Cost' metric to show a negative cost (Slide 22). If your startup has a unique cost advantage, find the industry-standard metric that makes that advantage look undeniable.
Use 'Closeology' Wisely: If you are in a crowded market, show a map of your 'neighbors' (Slide 7). Whether it's physical mines or a market map of successful exits in your niche, proximity to success breeds investor confidence.
The Power of the Backstop: If you have a strategic partner, don't just list their logo. Detail the 'If/Then' mechanics of your deal (Slide 19). Showing that a large partner is obligated or incentivized to step in if things go wrong is the ultimate de-risking tool.
Frequently asked questions
- What is the primary value proposition of the Invicta project?
- The primary value proposition is the project's low-cost profile and rapid path to production. According to Slide 16, the project has a 1-year payback period and a negative by-product cash cost of ($126.91) per ounce. This means the revenue from silver, copper, lead, and zinc is expected to exceed the total cost of mining, effectively making the gold production 'free' from a cash-cost perspective.
- How does the company handle environmental and social governance (ESG)?
- While the deck does not have a dedicated ESG slide, Slide 16 notes that the project 'surpasses the environmental standards of Peru.' Specifically, it mentions a 'contained process with zero liquid effluents,' which is a critical technical detail for gaining social license and regulatory approval in sensitive mining regions like the Andes.
- What role does Trafigura play in this fundraising or development stage?
- Trafigura acts as both a strategic investor and a backstop. As detailed on Slide 19, they provide a $15M sub-debt facility for overruns and hold the rights to buy all base metal concentrates. Crucially, if other lenders fail to fund the project CapEx by January 31st, Trafigura has an option to underwrite the debt and increase their equity stake by 16%.
- How does the resource grade compare across different categories?
- Slide 10 breaks this down: Measured resources (868,000 tonnes) have the highest gold grade at 2.71 g/t. Indicated resources (9.8M tonnes) sit at 1.99 g/t, and Inferred resources (14.2M tonnes) are lower at 0.67 g/t. The 'Mineable Reserves' for the first five years focus on higher-grade material, averaging 2.14 g/t gold and 18.76 g/t silver.
- Is the company currently generating revenue?
- No. The footer on Slide 22 explicitly states that 'The Company's projects are not currently in production.' All financial projections, including the $65M annual free cash flow and the 1-year payback period, are estimates based on the Invicta Project Feasibility Study from July 2010.