Yhat’s deck is a strong example of a seed-stage B2B SaaS pitch that prioritizes problem-solution alignment through visual storytelling. The deck identifies a specific bottleneck in the data science lifecycle—the transition from model building to production—and uses a 'before and after' workflow diagram to illustrate how their platform, ScienceOps, eliminates 14 of 21 manual steps. With a stated target market of $500 million and 6,000+ companies, Yhat positions itself as a platform solution rather than a point tool. The deck highlights significant early traction, including a 70% quarter-over-q…
Key takeaways
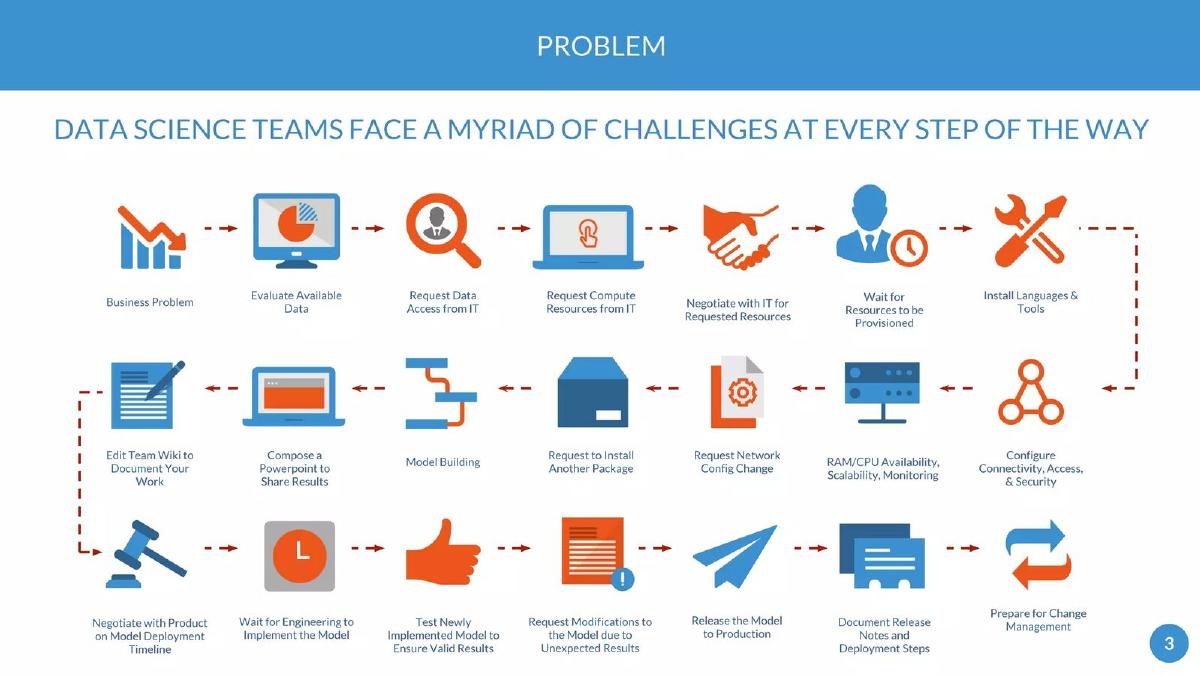
- The deck uses a 21-step icon-based workflow on slide 3 to visualize the 'myriad of challenges' data science teams face.
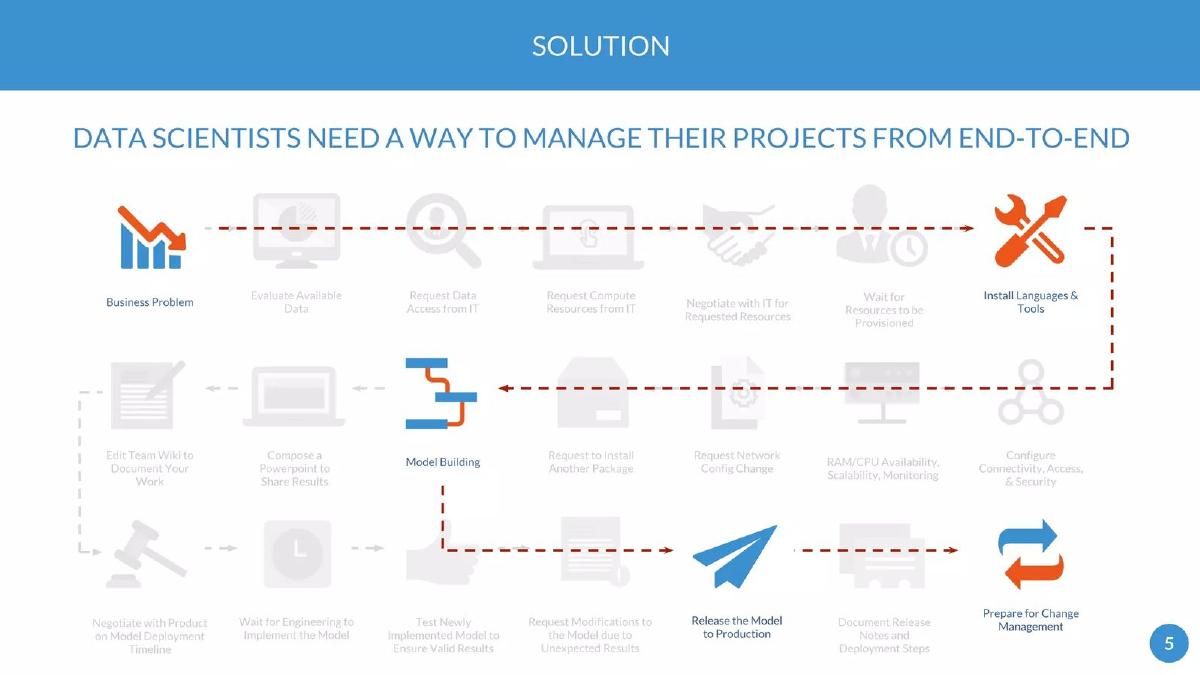
- Slide 5 demonstrates the solution by graying out 14 of the 21 steps, showing a direct path from model building to production.
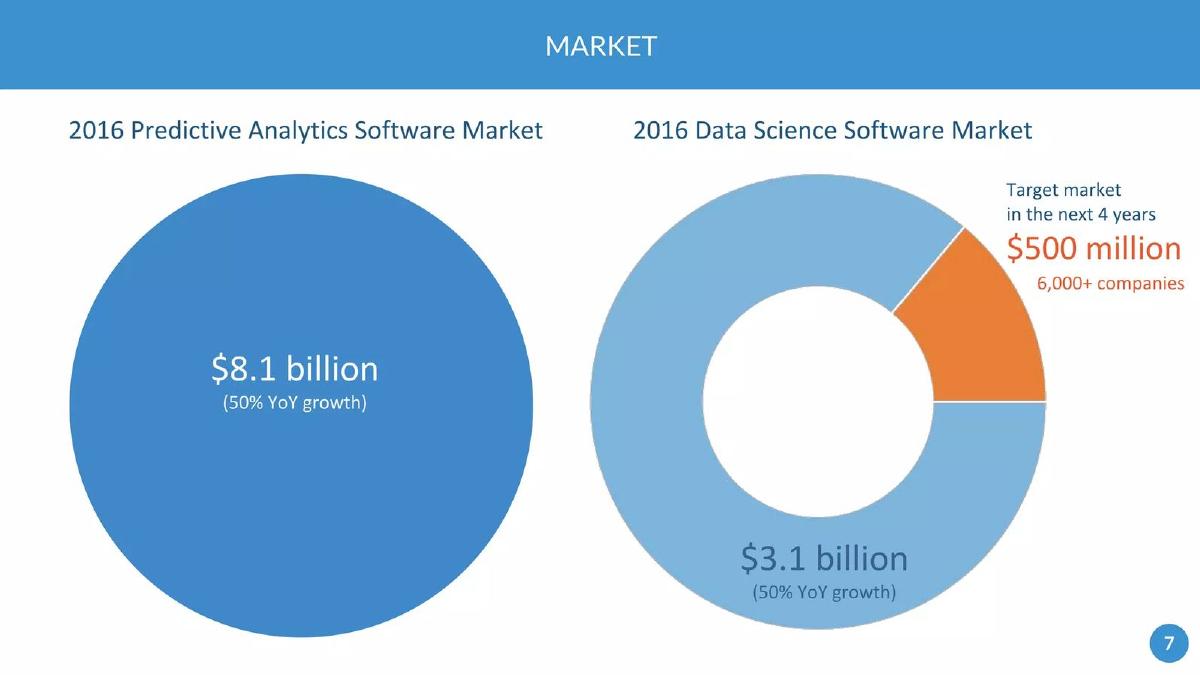
- Market sizing on slide 7 identifies a $3.1 billion data science software market with a specific $500 million target segment.
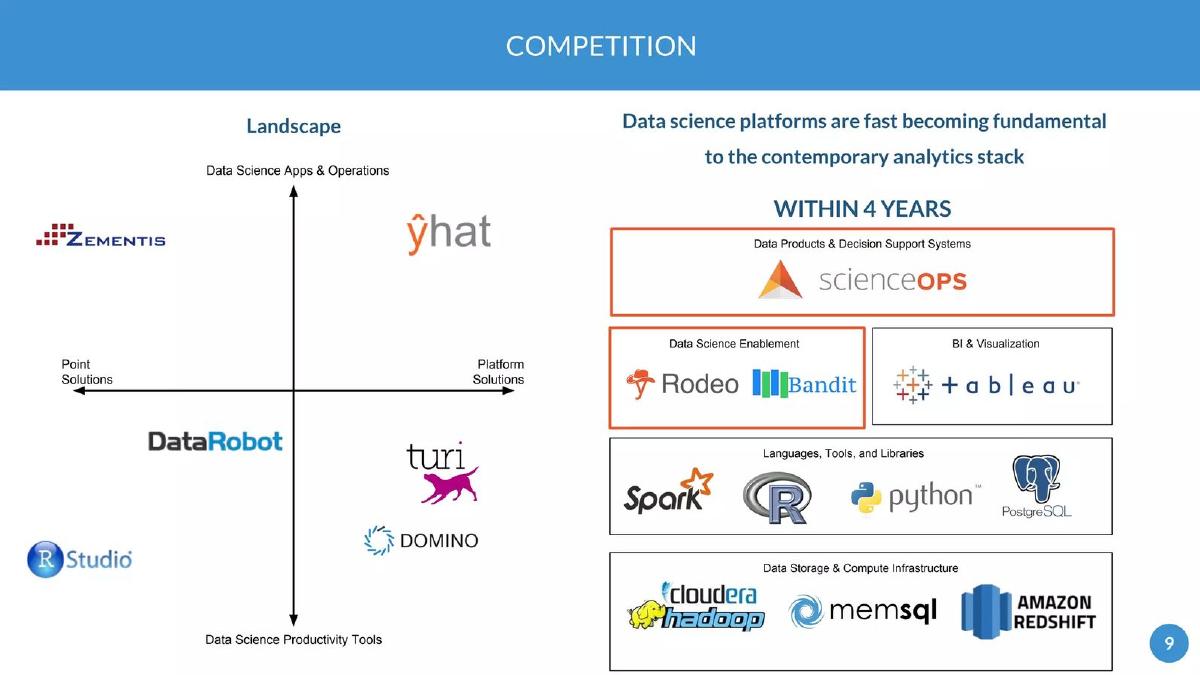
- The competitive landscape on slide 9 positions Yhat as a 'Platform Solution' for 'Apps & Operations,' distinct from point solutions like DataRobot.
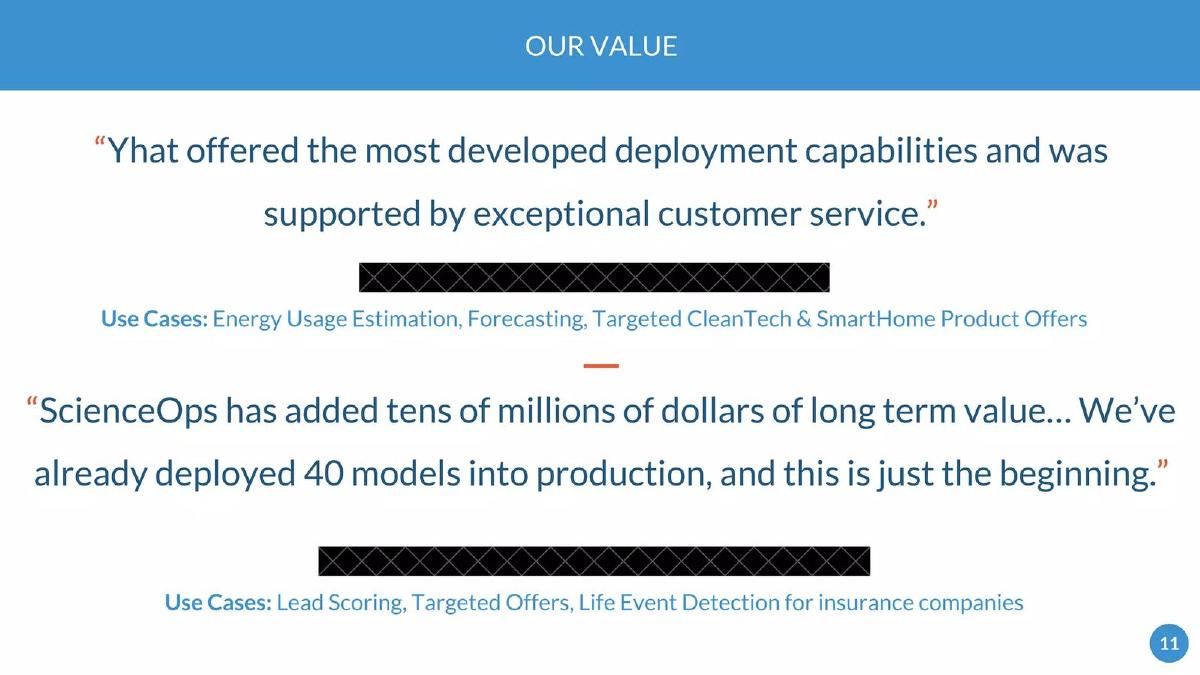
- Slide 11 provides qualitative social proof, claiming ScienceOps added 'tens of millions of dollars of long term value' for a client.
- Traction is shown on slide 13 through an annual run rate line graph and a bar chart showing 70% QoQ growth in inbound leads.
- The company had already raised $3 million in two seed rounds prior to this deck, according to slide 15.
- The team slide (17) is minimal, listing only 10 employees and two founders with backgrounds at EverFi, OnDeck, and comScore.
Executive Summary: The MLOps Pioneer
The Yhat 2017 investor deck is a focused, technical presentation designed to appeal to investors who understand the operational hurdles of enterprise data science. At 18 slides (9 of which are analyzed here), it follows a classic narrative arc: identifying a complex, broken process and presenting a streamlined, automated alternative. The deck is notable for its clarity in positioning and its reliance on visual workflow diagrams rather than dense text blocks.
Slide 1: Title and Value Proposition
The deck opens with a clear, descriptive title: "Data Science Lifecycle Management Platform." The subtitle, "Self-serve IT, automation, and faster time-to-market for data insights and applications," immediately identifies the three core benefits. This slide sets a professional, utility-focused tone, avoiding hyperbolic marketing language in favor of technical categories.
Slide 3: The Problem Visualization
Slide 3 is arguably the most important slide in the deck. It uses 21 distinct icons to map the "myriad of challenges" data science teams face. The workflow starts with a "Business Problem" and ends with "Prepare for Change Management." In between, it highlights the friction points: requesting data access from IT, waiting for resources to be provisioned, negotiating with engineering, and documenting deployment steps. By visualizing the process as a long, winding path, Yhat makes the pain of manual deployment feel visceral to the reader.
Slide 5: The Solution - Streamlining the Workflow
Slide 5 mirrors the layout of Slide 3 but applies a visual filter. It grays out 14 of the 21 steps, leaving a direct, dashed red line connecting "Model Building" to "Release the Model to Production." The headline states, "Data scientists need a way to manage their projects from end-to-end." This "before and after" comparison is a powerful way to demonstrate product value without needing to show a single screenshot of the software interface.
Slide 7: Market Sizing and Segmentation
Yhat provides a tiered view of their market. They cite an $8.1 billion Predictive Analytics Software market and a $3.1 billion Data Science Software market, both growing at 50% YoY. Crucially, they narrow this down to a "Target market in the next 4 years" of $500 million, representing 6,000+ companies. This specificity is a strength; it shows the founders have a realistic understanding of their initial beachhead rather than just claiming a trillion-dollar TAM.
Slide 9: Competitive Landscape
The competition slide uses two frameworks. The first is a 2x2 matrix plotting "Point Solutions vs. Platform Solutions" against "Productivity Tools vs. Apps & Operations." Yhat places itself alone in the "Platform/Operations" quadrant. The second framework shows where Yhat's products (ScienceOps, Rodeo, and Bandit) sit within the "contemporary analytics stack," positioning them above infrastructure (AWS Redshift, Cloudera) and languages (Python, R), but alongside BI tools like Tableau.
Slide 11: Qualitative Value and Social Proof
This slide uses two redacted customer testimonials to prove utility. One quote highlights "developed deployment capabilities" and "exceptional customer service." The second is more impactful, claiming that "ScienceOps has added tens of millions of dollars of long term value" and noting that the client has "already deployed 40 models into production." Listing specific use cases like "Energy Usage Estimation" and "Lead Scoring" helps ground the platform's utility in real-world business outcomes.
Slide 13: Growth and Traction Metrics
Slide 13 presents two charts. The first is a line graph for "Annual Run Rate" (ARR) spanning from April 2014 to December 2016. While the Y-axis values are redacted, the trend shows a significant inflection point in early 2015 followed by steady growth. The second chart shows "Monthly Inbound Leads" by quarter, highlighting a "70% growth QoQ in inbound leads." This suggests that the company's marketing and sales engine was beginning to scale effectively.
Slide 15: Investors and Mentors
Yhat reveals a strong pedigree of backing. The slide states they have "Raised $3MM in two seed rounds." The investor list includes RRE Ventures, Boldstart Ventures, Contour Venture Partners, KEC Ventures, Ignition Partners, and Y Combinator (YC W15). The angel investor list is equally impressive, featuring founders of Twitch, Parse, and CEOs of On Deck and Gerson Lehrman Group. This slide serves as a massive credibility booster, signaling that the company has already passed the due diligence of top-tier firms.
Slide 17: Team and Contact Information
The final slide analyzed is a combined team and summary slide. It lists 10 employees and identifies the two founders: Austin Ogilvie (CEO) and Greg Lamp (CTO). Their backgrounds include stints at EverFi, OnDeck, and comScore. The slide also reiterates the company's headquarters in NYC and their core identity as a "Turnkey Data Science Lifecycle Management Solution." The inclusion of the investor logos again on this slide reinforces the institutional support behind the founders.
What Yhat Does Well
The deck excels at process mapping . By breaking down the data science workflow into 21 discrete steps, they define the problem in a way that makes their solution seem inevitable. This is a classic "selling the hole, not the drill" strategy. They also do a great job of positioning . By placing themselves in the "Operations" quadrant of the competitive matrix, they avoid being compared to popular but different tools like RStudio or DataRobot, which focus more on model creation than deployment.
What is Missing from the Deck
The most glaring omission is a specific financial ask . While they mention previous rounds, they don't state how much they are raising now or what the milestones for the next 18 months look like. Additionally, there is no product roadmap . For a platform solution in a fast-moving space like MLOps, investors would want to see how the product will evolve to handle new technologies (like deep learning or real-time streaming) that were emerging in 2017. Finally, the unit economics (CAC, LTV, churn) are entirely absent, which is a missed opportunity given the traction shown on slide 13.
What a Founder Should Copy
Founders building complex B2B software should copy the workflow visualization used on slides 3 and 5. It is the most efficient way to explain a technical bottleneck to a non-technical investor. Additionally, the market segmentation on slide 7 is a model for how to present TAM/SAM/SOM without looking like you're pulling numbers out of thin air. By identifying a specific number of target companies (6,000+), Yhat makes their $500 million target feel achievable and grounded in reality.
Frequently asked questions
- What is the primary problem Yhat is solving?
- Yhat addresses the friction between data science and IT operations. Slide 3 illustrates a fragmented 21-step process involving manual resource requests, environment configuration, and engineering hand-offs. The deck argues that these steps delay time-to-market for data insights, creating a bottleneck that prevents models from reaching production efficiently.
- How does Yhat define its market opportunity?
- On slide 7, Yhat segments the market into two categories: the $8.1 billion Predictive Analytics Software market and the $3.1 billion Data Science Software market. They identify their specific target market as a $500 million opportunity encompassing over 6,000 companies within the next four years, citing a 50% year-over-year growth rate for the sector.
- Who are Yhat's main competitors according to the deck?
- Slide 9 uses a 2x2 matrix to map the landscape. Yhat positions itself in the top-right quadrant as a 'Platform Solution' for 'Apps & Operations.' Competitors listed include Zementis (Point Solution/Operations), DataRobot and RStudio (Point Solutions/Productivity), and Turi and Domino (Platform Solutions/Productivity).
- What evidence of product-market fit does the deck provide?
- The deck offers both qualitative and quantitative evidence. Slide 11 features a customer quote stating they deployed 40 models into production using ScienceOps. Slide 13 shows a steadily climbing annual run rate from April 2014 to December 2016, alongside a bar chart showing 70% QoQ growth in inbound leads.
- What is missing from this pitch deck?
- The deck lacks a specific 'Ask' slide detailing how much capital they are currently seeking and how it will be deployed. It also omits a detailed financial projection, unit economics (like CAC or LTV), and a comprehensive roadmap of future product features beyond the existing ScienceOps and Rodeo tools.