Mobility Product Slides: 7 Real Pitch Deck Examples
How mobility and transport startups show their product: a labelled vehicle drawing with a price per launch, a phone showing ride options and fares.
Mobility Product Slides: Real Pitch Deck Examples
Seven product slides from mobility decks (a small orbital launcher, a ride-comparison app, mobile oil changes, public-transport mapping, kids' bike subscriptions, vehicle analytics and car-service booking), shown in full. Mobility products usually involve a vehicle, a trip or a service visit, so investors want to see what the user or operator actually gets and what it costs. The stronger slides show the thing itself with a number; the weaker ones describe it in bullets.
TL;DR
A mobility product slide should show the vehicle, the screen or the service as the customer meets it, with one hard number. Aphelion draws its launcher with its payload, weight and $750,000 price per launch. Hero shows a phone listing ride options with wait times and fares. OLR lays out eight features of its mobile oil-change app. WhereIsMyTransport shows how it maps a city week by week. One Mobility sums up a kids' bike subscription in four benefits. Acerta pairs two photos with its two customer groups. MechanicBaba describes its booking platform in bullets, the weaker example here.
Mobility product slides
Each example shows the exact stored slide above its analysis and links to the full teardown. Stronger examples first. Claims and figures are as shown on the slides; we have not verified them.
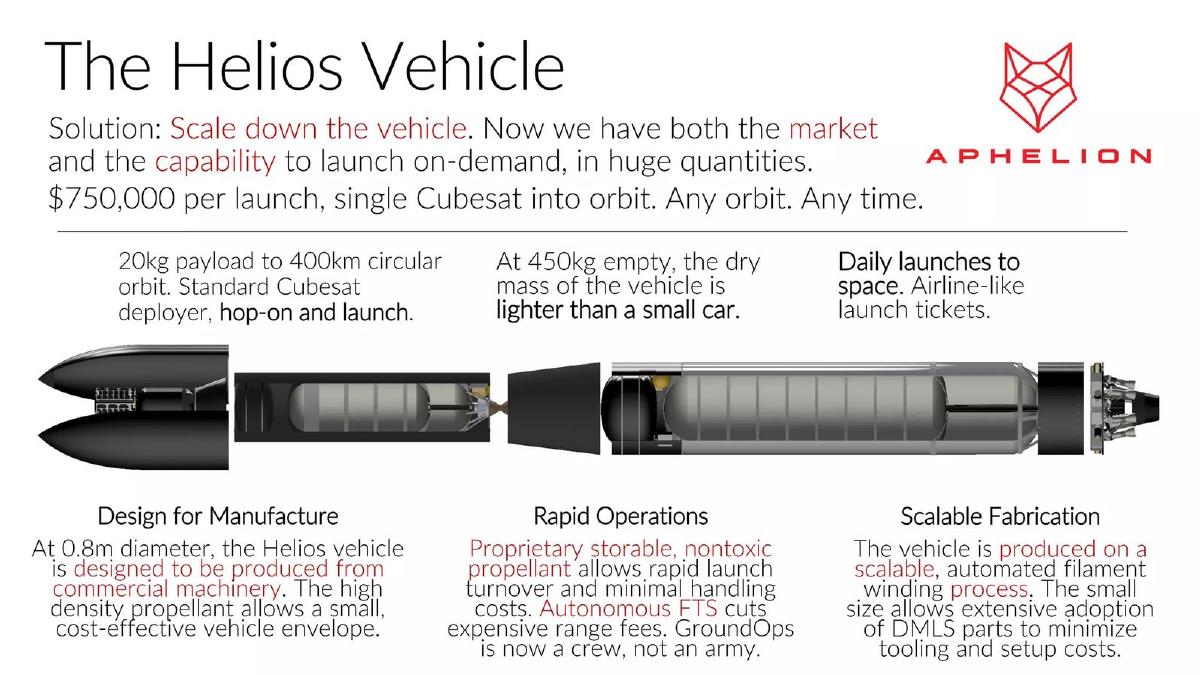
Aphelion Orbitals product slide — slide 5
Pre-A (recorded). Small orbital launch vehicle. A labelled vehicle drawing with a price.
Aphelion Orbitals deck, slide 5. Exact stored slide matched to this analysis.
Our analysis: The strongest example here: the investor sees the vehicle, what it carries, what a launch costs and why it can be built cheaply, all on one slide.
Evidence and limitation: A cutaway drawing, price per launch, payload and weight; no test or launch history on this slide.
What a founder can adapt: Draw or photograph your vehicle, label its key specs and put the customer price beside it.
Supporting analysis
What the deck claims: "The Helios Vehicle." "Solution: Scale down the vehicle." "$750,000 per launch, single Cubesat into orbit. Any orbit. Any time." "20kg payload to 400km circular orbit." "At 450kg empty, the dry mass of the vehicle is lighter than a small car." "Daily launches to space. Airline-like launch tickets." Three columns: "Design for Manufacture", "Rapid Operations", "Scalable Fabrication".
Presentation choice: Pairing the price with the payload lets an investor judge the offer without another slide.
When it does not fit: Mark what is designed versus built and tested; a drawing alone doesn't show the vehicle has flown.
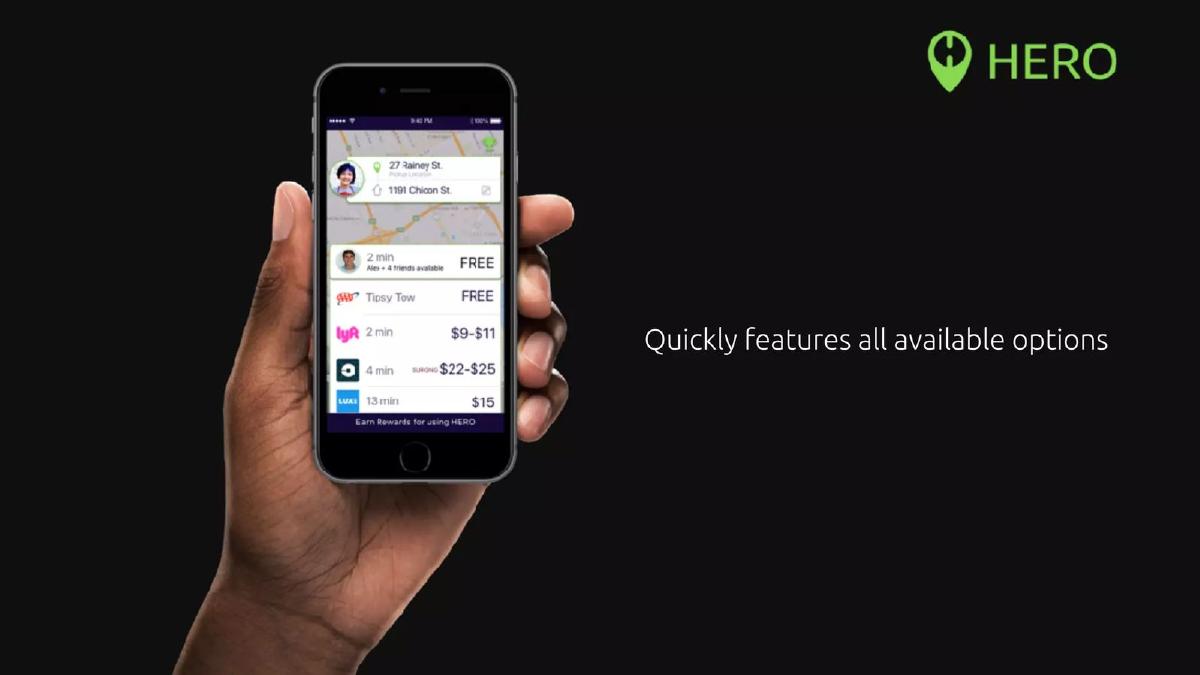
Stage not recorded. Ride-options app. A real app screen in a hand.
Hero deck, slide 6. Exact stored slide matched to this analysis.
Our analysis: The screen does the explaining: a rider sees every option, how long each takes and what each costs.
Evidence and limitation: A screenshot of the app with real-looking options and fares; the caption is one line.
What a founder can adapt: Use one real screenshot at readable size and a caption that names the benefit.
Supporting analysis
What the deck claims: "Quickly features all available options." The phone shows a route from "27 Rainey St" and a list of options with wait times and prices, including two marked "FREE", Lyft "$9-$11", another at "$22-$25" and one at "$15".
Presentation choice: Showing the actual screen proves the app exists and makes the benefit obvious in seconds.
When it does not fit: Make sure the screen text is legible on a projector; small phone text is easy to miss.
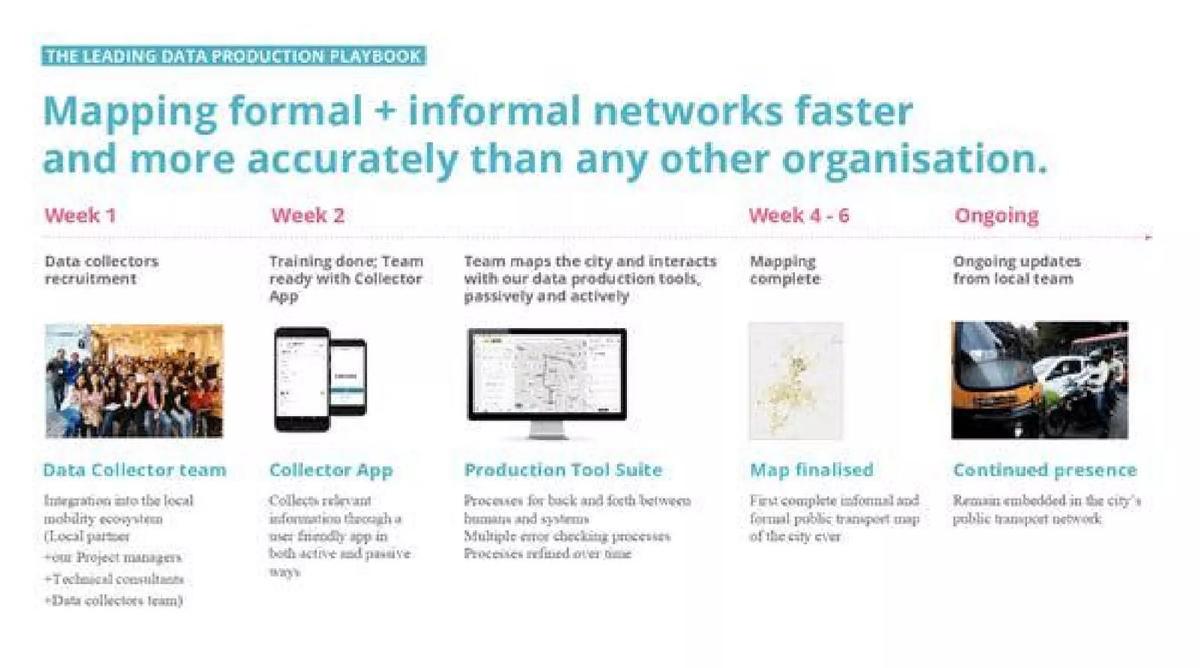
Series A (recorded). Public-transport data. A week-by-week rollout.
WhereIsMyTransport deck, slide 5. Exact stored slide matched to this analysis.
Our analysis: For a data product, the product is partly the process. The timeline shows how a city goes from unmapped to mapped in about six weeks.
Evidence and limitation: A timeline with photos of each step; the speed claim has no comparison figures.
What a founder can adapt: If your product is an operation, show its steps with how long each takes.
Supporting analysis
What the deck claims: "The leading data production playbook." "Mapping formal + informal networks faster and more accurately than any other organisation." Timeline: "Week 1" data collectors recruitment; "Week 2" training done, team ready with Collector App; "Week 4-6" mapping complete; "Ongoing" updates from local team. Photos of the team, the Collector App, the Production Tool Suite, a finished map and a street scene.
Presentation choice: Putting time on each step turns a vague claim (faster) into something an investor can check.
When it does not fit: Back "faster than any other organisation" with a number or drop it.
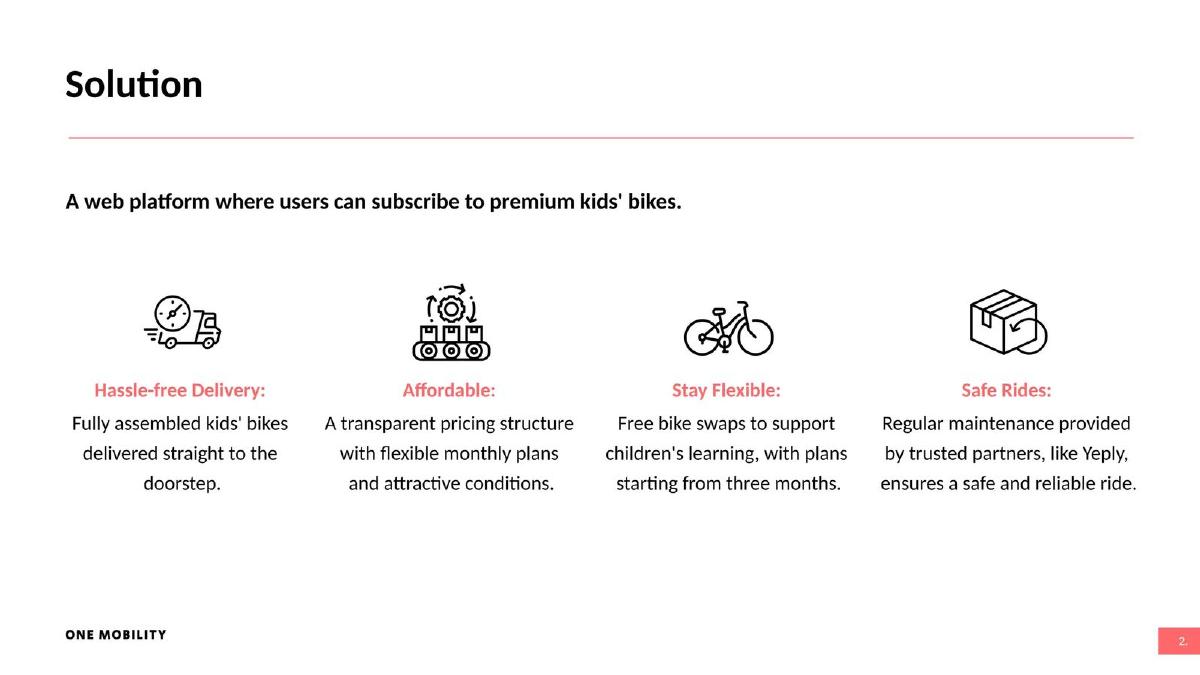
Seed (recorded). Kids' bike subscriptions. Four benefits under one line.
One Mobility deck, slide 3. Exact stored slide matched to this analysis.
Our analysis: The first line says exactly what the product is; the four benefits answer a parent's main worries.
Evidence and limitation: A one-line product definition and four benefits; no price or photo of a bike.
What a founder can adapt: Open with one sentence defining the product, then three or four benefits.
Supporting analysis
What the deck claims: "A web platform where users can subscribe to premium kids' bikes." "Hassle-free Delivery: Fully assembled kids' bikes delivered straight to the doorstep." "Affordable: A transparent pricing structure with flexible monthly plans." "Stay Flexible: Free bike swaps to support children's learning, with plans starting from three months." "Safe Rides: Regular maintenance provided by trusted partners, like Yeply."
Presentation choice: A single-sentence definition at the top is the fastest way to orient an investor.
When it does not fit: "Affordable" without a monthly price leaves the key question open.
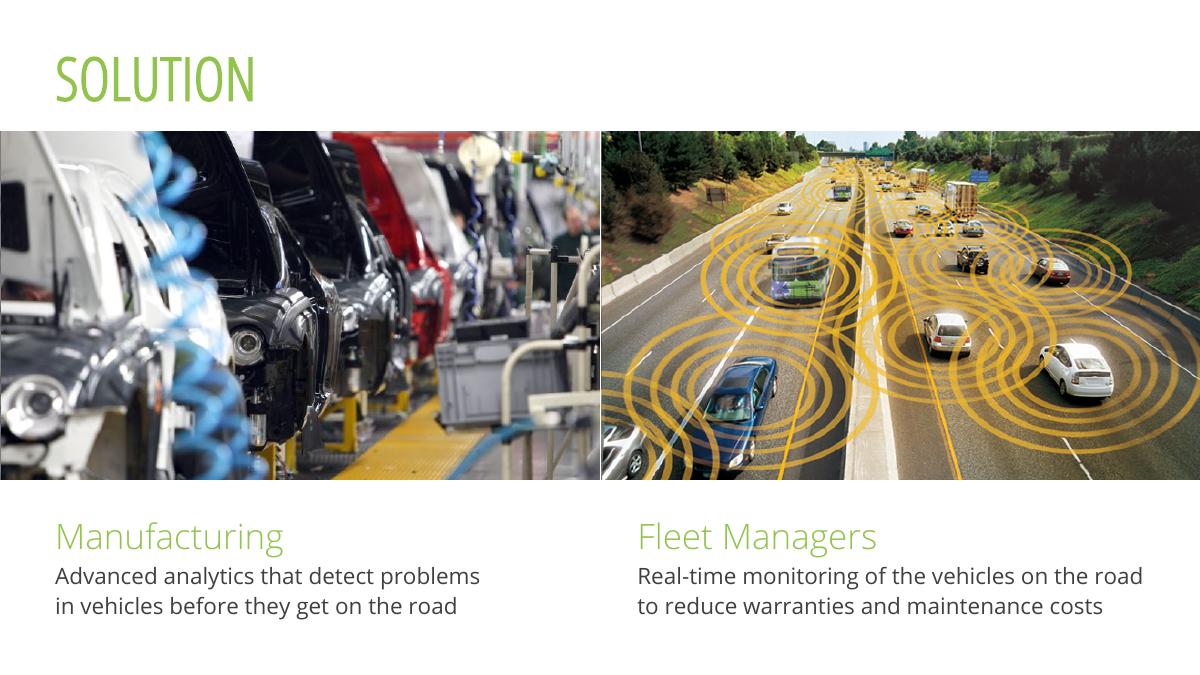
Pre-revenue (recorded). Vehicle analytics. Two customer groups with photos.
Acerta deck, slide 5. Exact stored slide matched to this analysis.
Our analysis: The split makes the two buyers clear, but the investor never sees what the software shows them.
Evidence and limitation: Two use cases with stock-style photos; no screen, output or accuracy figures.
What a founder can adapt: Keep the two-buyer split and add one screen or alert from the product under each.
Supporting analysis
What the deck claims: "Solution." "Manufacturing: Advanced analytics that detect problems in vehicles before they get on the road." "Fleet Managers: Real-time monitoring of the vehicles on the road to reduce warranties and maintenance costs." Photos of a car assembly line and a highway.
Presentation choice: Useful for naming who pays; weaker at proving the product works.
When it does not fit: Stock photos of cars say nothing about your software.
Post-pilot (recorded). Car-service booking. Bullets only (weaker example).
MechanicBaba deck, slide 3. Exact stored slide matched to this analysis.
Our analysis: The selling points are concrete (30% lower, a warranty), but the investor sees no booking screen or service.
Evidence and limitation: A definition, a customer and three selling points; no screen or photo.
What a founder can adapt: Add a screenshot of the booking flow next to the three selling points.
Supporting analysis
What the deck claims: "Product / Service." "MechanicBaba - An online car service booking platform which help car owners in the car maintenance activities and get the service and repairs done in reasonable and transparent prices." "Target Customer: Car Owners." "USP: Transparent Pricing. 30% lower prices with same quality. 3 months or 1000 KMs warranty."
Presentation choice: Included for contrast: clear words, nothing shown.
When it does not fit: Say what "30% lower" is compared with.
How the product is presented, whether the product itself is pictured, and whether a hard number appears.
Example
Product
Presented as
Product pictured
Hard number
Aphelion Orbitals
Launch vehicle
Labelled drawing
Drawing
Price, payload, mass
Hero
Ride-options app
App screen
Yes
Fares, wait times
OLR
Mobile oil change
Feature grid
Icons
10–15 minutes
WhereIsMyTransport
Transit data
Week-by-week process
Yes (tools)
4–6 weeks
One Mobility
Kids' bike subscription
Four benefits
Icons
Plans from 3 months
Acerta
Vehicle analytics
Two customer groups
No (stock photos)
No
MechanicBaba
Car-service booking
Bullets
No
30% lower, warranty
Key Takeaways
Show the vehicle, app screen or service visit, not an abstract icon.
Add one hard number: price, payload, wait time or turnaround.
Say who uses it: rider, driver, fleet manager or manufacturer.
If the product is an operation, show the steps and how long they take.
Build your mobility product slide
Start with what the rider, driver or operator actually sees, then add one number.
Picture. The vehicle, app screen or service visit as the customer meets it.
User. Who uses it: rider, driver, fleet manager, manufacturer.
Number. Price per trip or month, wait time, turnaround or payload.
Status. Designed, piloting, or live, and where.
Copyable framework: [Screen or vehicle photo] [Product] lets [user] [do what]. [Price/time figure]. Status: [live in X / piloting with Y].
Illustrative example 1 — written by us
Before: MechanicBaba - An online car service booking platform which help car owners in the car maintenance activities and get the service and repairs done in reasonable and transparent prices.
After: [Screenshot: booking flow with fixed price] Car owners book a service in [n] taps and see the price before they confirm. [Price] for a standard service, 3 months or 1,000 km warranty. Status: [pilot results].
What improved: Our illustrative rewrite; not MechanicBaba's wording. Bracketed parts are placeholders to fill with real facts. It shows the product and puts the price where the investor can see it.
What this guide adds
The library already has mobility problem, solution and market guides, a general product slide guide, product slides by stage, and sector product guides for hardware, consumer apps, marketplaces and others. This page looks at how a transport or vehicle product is shown to an investor.
Sector labels come from the sector recorded for each published teardown (high confidence for five; medium for Aphelion, whose deck is aerospace; low for Acerta, which is automotive analytics). None of these seven slides appears in another guide. Other slides from the Acerta, Hero and MechanicBaba decks are used elsewhere in the library for different lessons.
Four ways mobility decks show the product
The vehicle or screen with numbers (Aphelion, Hero): a labelled drawing or a real app screen with prices.
Feature grid (OLR, One Mobility): each part of the service as an icon with a line of explanation.
Process over time (WhereIsMyTransport): what happens in week 1, week 2 and after, with photos of the team and tools.
Customer groups or bullets (Acerta, MechanicBaba): who the product is for, told in words and photos rather than shown working.
Common mistakes
Icons instead of the product. Show the real screen, vehicle or service.
No price. "Affordable" or "transparent pricing" without a figure leaves the question open.
Stock photos. Generic car or road photos don't show your product.
Unbacked speed claims. "Faster" needs a time or a comparison.
Diagnostic checklist
The vehicle, screen or service pictured.
Who uses it.
One hard number.
Designed vs live marked.
Frequently asked questions
How we chose these examples
Corpus: published pitch deck teardowns on StartupFundraising.com. Founder-uploaded private decks are excluded.
Selection (2026-09-27): we took teardowns whose recorded sector is mobility, slides 2 to 7, with a stored slide image and readable text mentioning the product, app, features or how it works. We viewed ten candidate slides, left out slides already used in other guides, slides without a stored image (Dartrays' product comparison), a second slide from the same deck (Acerta's slide 4), and slides that describe a revenue offer or community approach rather than the product (Humanforest's proposition, Grivo's "how we do it"), and kept seven that show different ways of presenting a mobility product. MechanicBaba is included as a weaker example for contrast.
Sector is the category recorded for each teardown (high confidence for five; medium for Aphelion; low for Acerta). Stages as recorded: One Mobility and OLR, seed; WhereIsMyTransport, Series A; Aphelion, pre-A; Acerta, pre-revenue; MechanicBaba, post-pilot; Hero, not recorded.
Review: stored slide images were checked on 2026-09-27 and matched to company, deck and slide number, and quoted text was read from the images (editorial model review). No person has yet completed an editorial review of this page.
Claims and figures are as shown on the slides; we have not verified them. We make no claim that any slide caused a fundraising outcome.