Mobility Startup Problem Slide: Pitch Deck Examples
How mobility and automotive startups present the problem in a pitch deck: name the driver or car owner, the moment it goes wrong, and what it costs.
Mobility Startup Problem Slide: Real Pitch Deck Examples
Eight problem slides from startups in parking, car care, car sharing, EV charging and driver safety, shown in full, compare whether each slide names who suffers, the moment the problem happens, and a number that shows its size.
TL;DR
A mobility problem slide should name one person (a driver, a car owner, a fleet manager), the moment the problem happens (looking for parking, waiting for a repair, glancing at a phone) and one number for what it costs. Cyclectric does this in three lines: EV sales "expected to grow 10x by 2025 (Bloomberg)", only "50-60k stations", and "~$20K for a commercial station". Dartrays names the moment, phones and infotainment screens "may lead to 80% loss of visual contact with the road". GH Mobil splits its buyers into used-car owners and fleet owners and cites an AutoMD survey. Traffic, pollution and climate change are background every investor knows; HumanForest's list of seven trends never says who has the problem, which is the weaker pattern.
Mobility problem slides from real pitch decks
Each example shows the exact stored slide above its analysis and links to the full teardown. Claims are as shown on the slides; we have not verified them.
Cyclectric problem slide — slide 2
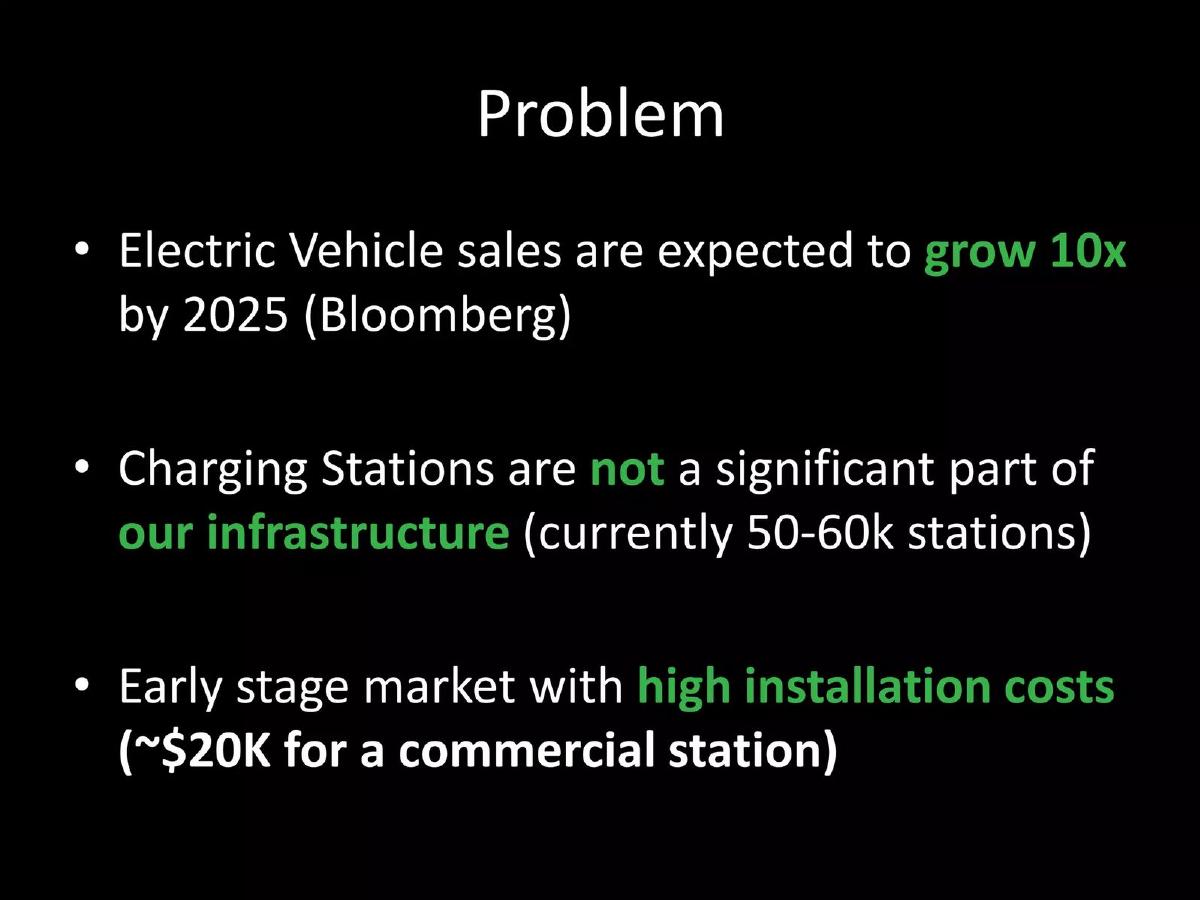
EV charging. Three large bullets on black, key words in green.
Cyclectric deck, slide 2. Exact stored slide matched to this analysis.
Our analysis: The strongest structure here: demand is rising, supply is small, and the reason supply is small is a specific cost.
Evidence and limitation: A sourced growth forecast, a station count and a cost per station.
What a founder can adapt: Demand, supply, and the one cost that keeps supply short.
Supporting analysis
What the deck claims: "Problem." "Electric Vehicle sales are expected to grow 10x by 2025 (Bloomberg)." "Charging Stations are not a significant part of our infrastructure (currently 50-60k stations)." "Early stage market with high installation costs (~$20K for a commercial station)."
Presentation choice: Each line is a number, and together they explain the gap rather than just stating that EVs are growing.
When it does not fit: Say who pays the $20K (property owners? cities?); that person is the buyer. Source the station count.
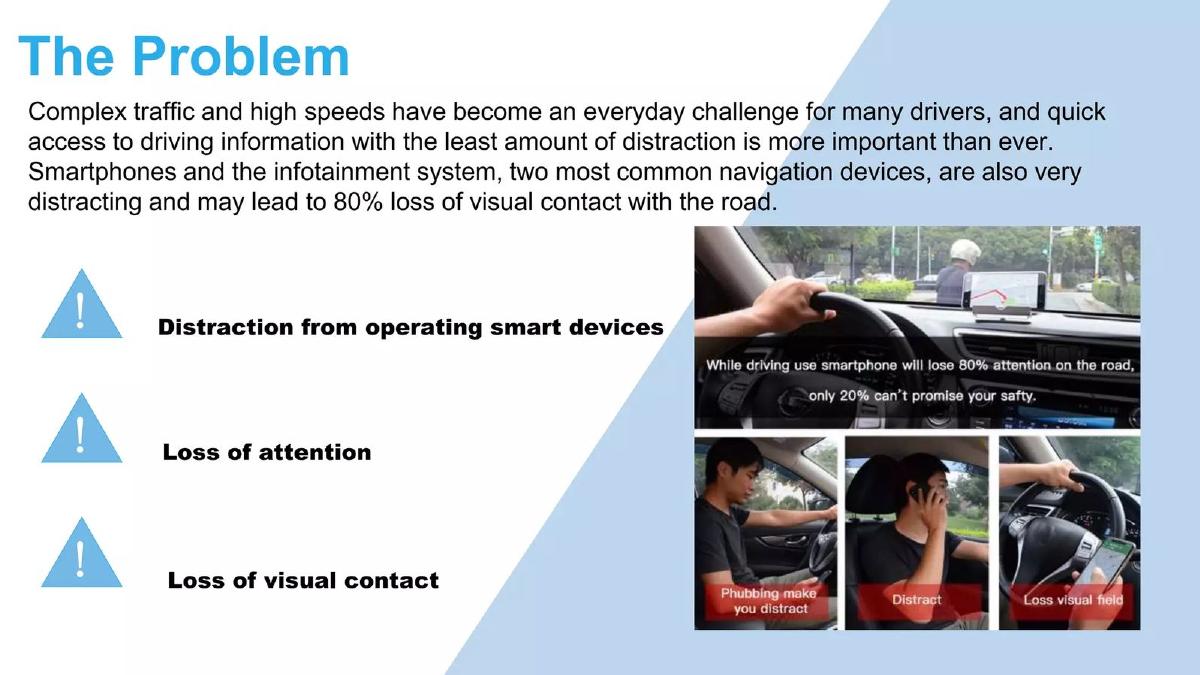
Head-up display for cars. A paragraph, three warning icons and photos of drivers on phones.
Dartrays deck, slide 2. Exact stored slide matched to this analysis.
Our analysis: It names the moment (looking at a screen to navigate) and the photos make it instantly familiar.
Evidence and limitation: "80% loss of visual contact"; no source.
What a founder can adapt: Show the exact moment the problem happens.
Supporting analysis
What the deck claims: "The Problem." "Complex traffic and high speeds have become an everyday challenge for many drivers." "Smartphones and the infotainment system, two most common navigation devices, are also very distracting and may lead to 80% loss of visual contact with the road." "Distraction from operating smart devices." "Loss of attention." "Loss of visual contact."
Presentation choice: Every investor has done this; the photos do the work of a paragraph.
When it does not fit: The three icons repeat the paragraph. Source the 80% figure and add what distraction costs (accidents, insurance).
Mobile car repair. Two buyer lists and a survey chart.
GH Mobil deck, slide 3. Exact stored slide matched to this analysis.
Our analysis: Splitting two buyers shows the founder knows their problems differ: owners worry about price, fleets about downtime.
Evidence and limitation: One survey figure with a named source.
What a founder can adapt: If you serve two buyers, give each their own short list.
Supporting analysis
What the deck claims: "Why we exist." "Dealing with car problems has historically been a time-consuming and frustrating experience, and very expensive." "Used vehicle owners: Expired repair warranties; Automotive shop repairs too expensive; Towing fees, rental car fees, inconvenience." "Commercial fleet owners: ... slow response times; Towing fees, down time, high Repair cost, Maintenance Tracking." "87% of respondents reported that independent shop quotes were more affordable than dealership quotes" (AutoMD).
Presentation choice: Named buyers with their own lists are more believable than "car owners" in general.
When it does not fit: The survey compares dealers and independent shops, which supports neither buyer's pain directly; pick a figure about downtime or repair cost.
GetPark deck, slide 2. Exact stored slide matched to this analysis.
Our analysis: It links illegal parking to traffic and stress, but "people" is everyone and "hours" isn't measured.
Evidence and limitation: No figures; the quote has no speaker.
What a founder can adapt: Name the city and measure the hours.
Supporting analysis
What the deck claims: "Problem." "The high rate of traffic jam. Illegal parking one of the problem. People are spending hours in the road because of the destiny highway. Increased levels of stress and aggression."
Presentation choice: Linking parking to traffic is a useful argument for cities as buyers.
When it does not fit: A quote with no speaker reads as the founder's own words; attribute it or turn it into a statement.
On-demand car wash. Three icons with short captions.
Kilapin deck, slide 2. Exact stored slide matched to this analysis.
Our analysis: The queue is a clear moment; the other two points are weaker.
Evidence and limitation: No figures.
What a founder can adapt: Lead with the queue and measure it: how long, how often.
Supporting analysis
What the deck claims: "The Problem." "Going to car wash nearby can be a irritating experience." "We need to wait in queue line at our regular car wash." "lack of car wash options that has same features as the regular one." "If we have bad experience, there is no reliable feedback channels."
Presentation choice: Waiting in line is an easy problem to picture.
When it does not fit: "No reliable feedback channels" is minor; cut it for a number.
Shared long-term car leasing. Text, a bar chart and a cost table. Partial: problem and solution share the slide.
Orto deck, slide 5. Exact stored slide matched to this analysis.
Our analysis: The best numbers here, but they compare against Orto's own price, so they prove the solution rather than the problem.
Evidence and limitation: A cost table for one car; notes document referenced.
What a founder can adapt: Keep the ownership and leasing costs on the problem slide; move Orto's price to the next.
Supporting analysis
What the deck claims: "The pain point..." "The world is full of people who love cars, but find it hard to justify buying their dream car... expensive, inefficient, and a lot of hassle." "...The solution." Chart: "Cost comparison with traditional ownership models for a Jaguar F-Type S": Orto £13,496 whole term, leasing £37,169, sole ownership £26,853.
Presentation choice: A worked cost for one real car makes "expensive" concrete.
When it does not fit: Putting problem and solution on one slide leaves neither enough room.
Shared e-bikes. A numbered list of seven items. Weak on purpose.
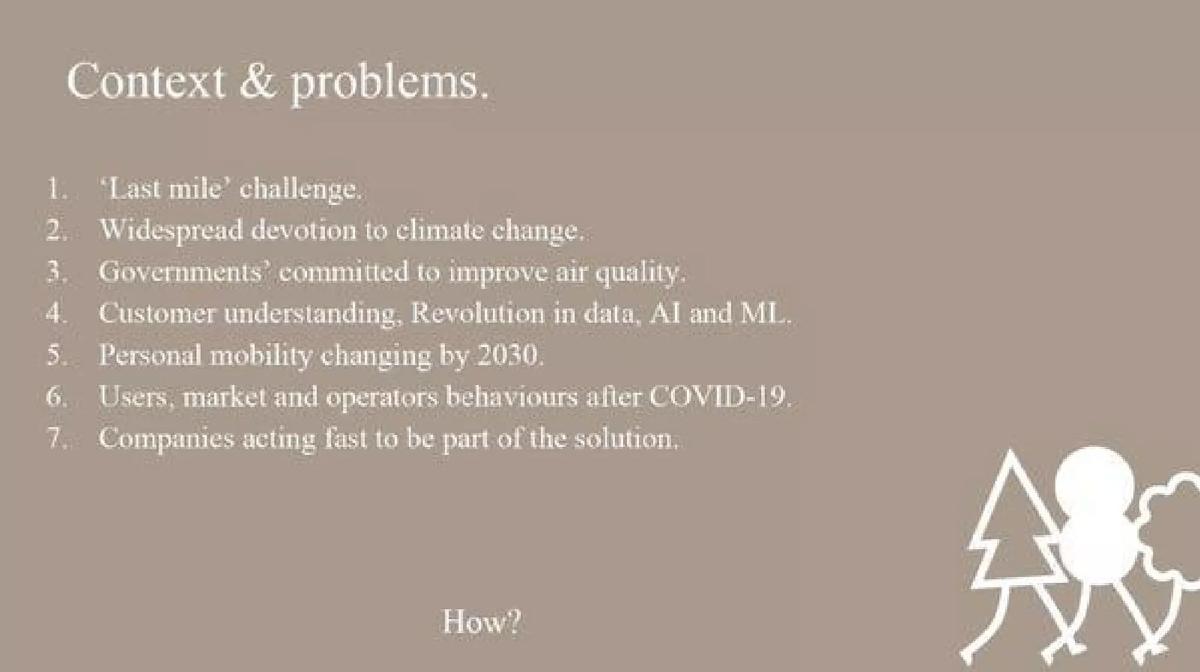
HumanForest deck, slide 2. Exact stored slide matched to this analysis.
Our analysis: Only item 1 is a problem; the rest are trends. No rider, city or cost is named.
Evidence and limitation: No figures.
What a founder can adapt: Turn "last mile" into a person and a number: how far, how long, how much.
Supporting analysis
What the deck claims: "Context & problems." "1. 'Last mile' challenge. 2. Widespread devotion to climate change. 3. Governments' committed to improve air quality. 4. Customer understanding, Revolution in data, AI and ML. 5. Personal mobility changing by 2030. 6. Users, market and operators behaviours after COVID-19. 7. Companies acting fast to be part of the solution." "How?"
Presentation choice: It shows what the stronger slides avoid: context in place of a problem.
When it does not fit: Move trends to a "why now" slide.
Whether each slide names who suffers, the moment it happens, and a number for the cost.
Example
Who suffers
The moment
Number
Cyclectric
Implied (station builders)
Partly (too few stations)
Yes (Bloomberg, ~$20K)
Dartrays
Yes (drivers)
Yes (looking at a screen)
Yes (80%, unsourced)
GH Mobil
Yes (two buyers)
Partly (repairs, towing)
Yes (AutoMD survey)
Parkhound
Implied (drivers)
Yes (finding parking)
No
GetPark
No ("people")
Partly (hours on the road)
No
Kilapin
Implied (car owners)
Yes (queue)
No
Orto
Yes (car lovers)
No
Yes (cost table)
HumanForest
No
No
No
Key Takeaways
Name one person: the driver, the car owner, the fleet manager, the charging-site owner.
Describe the moment it goes wrong: circling for parking, a day lost at the garage, eyes off the road.
Give one number for the cost, with a source: Cyclectric's "~$20K" per station, Orto's cost table.
Traffic, pollution and climate are context, not the problem; say who pays for them and how.
Keep the product off the problem slide; Orto and Get A Drive mix both.
Build your mobility problem slide
One person, one moment, one number.
Person. Who has the problem and pays to fix it: commuters, fleet managers, apartment owners?
Moment. When exactly does it go wrong? Describe it in one line.
Cost. Time, money or risk per occurrence, with a source.
Today. What do they do now, and why doesn't it work?
Copyable framework: [Person] lose [time/money] every time they [moment]. Today they [workaround], which [why it fails]. (Source: [source].)
Illustrative example 1 — written by us
Before: Traffic is getting worse and parking is a nightmare in every city.
After: Drivers in central Lisbon spend an average of 18 minutes finding a space on each trip; the nearest garage costs €3.50 an hour. (Source: our survey of 420 drivers.)
What improved: Our illustrative rewrite; the figures are invented for the example. It names the person, the moment and a measured cost.
What this guide adds
The logistics guides cover moving goods and the travel guides cover trips; this guide covers people and their cars day to day: parking, repairs, washing, sharing, charging and safety while driving.
Mobility decks share a trap: the problems are ones investors live with (traffic, parking, garage bills), so founders assume the slide needs no evidence. The stronger slides still name who suffers and add a number.
Three things a mobility problem slide proves
Who suffers: "Used vehicle owners" and "Commercial fleet owners" (GH Mobil), "many drivers" (Dartrays), people who "love cars" but can't justify one (Orto).
When it happens: waiting "in queue line" at the car wash (Kilapin), "spending hours in the road" (GetPark), using a phone while driving (Dartrays).
What it costs: "~$20K for a commercial station" (Cyclectric), an 87% survey result on repair quotes (GH Mobil), a full cost table (Orto).
Common mistakes
Traffic or climate as the problem. Investors know; say who pays and how much.
"People" as the buyer. Drivers, owners, fleets and cities have different problems and budgets.
No number. Everyday problems still need a measured cost.
Trends listed as problems. Put 2030 forecasts and post-COVID behaviour on a why-now slide.
Solution on the problem slide. Keep your price for the next slide.
Diagnostic checklist
It names one person who has the problem.
It describes the moment it happens.
It gives a number for time, money or risk, with a source.
Trends are on another slide.
The product is on the next slide.
Frequently asked questions
How we chose these examples
Corpus: published pitch deck teardowns on StartupFundraising.com. Founder-uploaded private decks are excluded.
Selection (2026-09-25): we searched slides 2–6 for problem slides mentioning parking, cars, drivers, EV charging, ride sharing, bikes or mobility, excluding freight and parcel delivery (covered by the logistics guides). Eleven stored images were inspected. Acerta and Mechanicbaba were excluded because those decks already appear in other guides; Get A Drive p4 was left out because it mixes the problem and the solution and GetPark and Orto already cover those patterns. Orto is marked partial; HumanForest is kept as a weaker contrast.
Overlap check: none of these eight slides appears in another guide.
Review: all eight stored slide images were inspected on 2026-09-25 and matched to company, deck and slide number (editorial model review). No person has yet completed an editorial review of this page.
Claims are as shown on the slides; we have not verified them. We make no claim that any slide caused a fundraising outcome.