Acerta's 12-slide deck, exported on 2 March 2017 as version five, pitches machine learning that predicts vehicle component failures from sensor data. The problem section is outstanding - a full-bleed wiring harness photograph and four real software recalls at FCA, Toyota and Honda - and the team is deeply domain-matched, with an advisor who spent 25 years as a Chrysler VP before becoming EVP of vehicle engineering and quality at Tesla. But the deck has no traction, no customer, no completed proof of concept, no accuracy figures, no pricing, no financials and no ask. Its market pie double-coun…
Key takeaways
- Acerta's 12-slide March 2017 deck contains no ask, no traction, no customers, no pricing and no financials - it establishes the problem and the team, then stops.
- The problem section is exceptional: a full-bleed wiring harness photograph and a table of four real FCA, Toyota and Honda software recalls totalling roughly 3.4 million vehicles.
- The recall table measures impact in vehicles rather than dollars, and never claims Acerta's method would have caught any of the four defects.
- The market pie double-counts: supplier revenue of $0.85 trillion is contained inside the $2.45 trillion of vehicle sales it is drawn next to.
- The headline $1,665 of software supplier revenue per car is an industry-wide average, not a price Acerta can charge - and $150 billion over 90 million cars is $1,667.
- 'Business model' is a three-stage sales funnel - POC, pilot, expand - with the word 'SaaS' in parentheses and not one price attached to any stage.
- The competition grid gives Acerta a green square on all six criteria and omits Tier 1 suppliers such as Bosch, Continental and Denso entirely.
- The strongest asset is the advisor slide - a 25-year Chrysler VP who became EVP of vehicle engineering and quality at Tesla - and the deck attributes no introductions, meetings or pipeline to it.
What this deck actually is
Twelve slides, built in PowerPoint and exported to PDF on 2 March 2017. The file is named acertadeck-v5 — the fifth revision of a deck for Acerta, a Waterloo, Ontario company applying machine learning to vehicle sensor data in order to detect anomalies and predict component failures in real time.
The running order is cover, problem, recalls, solution, solution by customer segment, why now, market, business model, competition, team, advisors, and a closing logo slide with a group email address.
Read that list again and notice what is not on it. There is no traction slide. No customer slide. No pilot results. No revenue, no pipeline, no letters of intent, no accuracy numbers, no pricing, no financial projections, no use of funds, no milestones, and no ask. Twelve slides go by and the deck never states how much money the company wants, what it will do with it, or whether the technology has ever been pointed at a real vehicle.
What it has instead is a genuinely excellent problem section and one of the strongest team-and-advisor pairings you will see on a seed deck: six named operators out of the University of Waterloo's automotive research programme, an associate professor as chief scientist, and an advisor who was a Chrysler VP for twenty-five years and then EVP of vehicle engineering, manufacturing, quality and supply chain at Tesla.
This is a deck that earns the meeting and then has nothing to say in it.
Slide-by-slide walkthrough
Slide 1 — Cover
The Acerta wordmark, a green ring device over the "t", and one line of italic subtitle: "Real time analysis of vehicle data to diagnose and predict failure."
The subtitle is a good one-liner. In eleven words it names the input (vehicle data), the timing (real time), and the two outputs (diagnose, predict). A reader who stops here still knows what the company does, which is more than most cover slides manage.
What is missing is everything that makes a circulated PDF usable: no date, no round name, no stage, no location, no contact, no confidentiality line. This file was emailed to investors — the filename says v5 , so it had been through five drafts — and an investor opening it three weeks later has no way to know how old the numbers are. Cover slides cost nothing; a date and a round label belong on this one.
Slide 2 — "Complexity of vehicles is growing exponentially"
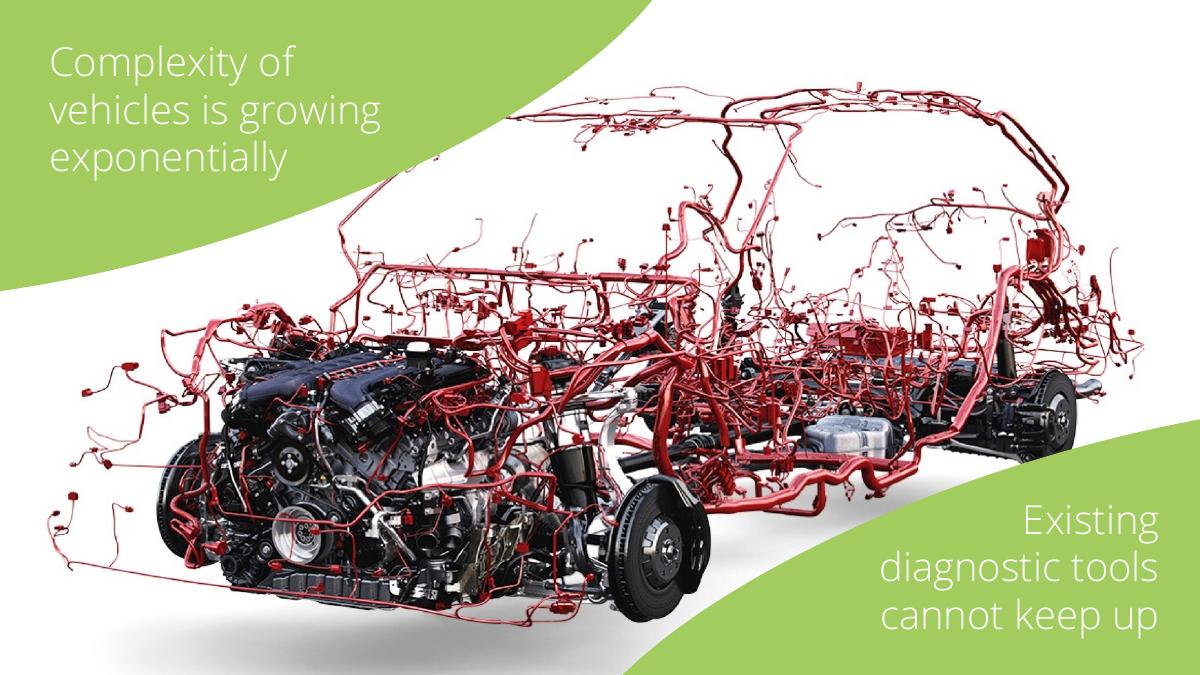
A full-bleed photograph of a car's complete wiring harness, rendered in red against white with the body removed — engine, transmission, axles and several hundred metres of loom floating in space. Two lines of copy in the corners: "Complexity of vehicles is growing exponentially" and "Existing diagnostic tools cannot keep up."
This is the best slide in the deck and one of the best problem slides in any deck. The image does the argument. You do not need a statistic about lines of code or sensor counts because you are looking at the mess, and the second caption converts the mess into a market gap in six words.
The one thing it needs is a citation for "exponentially". Software lines of code per vehicle, electronic control units per platform, or sensors per platform — any of the three, sourced and plotted over fifteen years, turns a rhetorical adverb into evidence. The deck cites McKinsey on the following slide, so the sourcing habit exists; it just is not applied here.
Slide 3 — Recalls
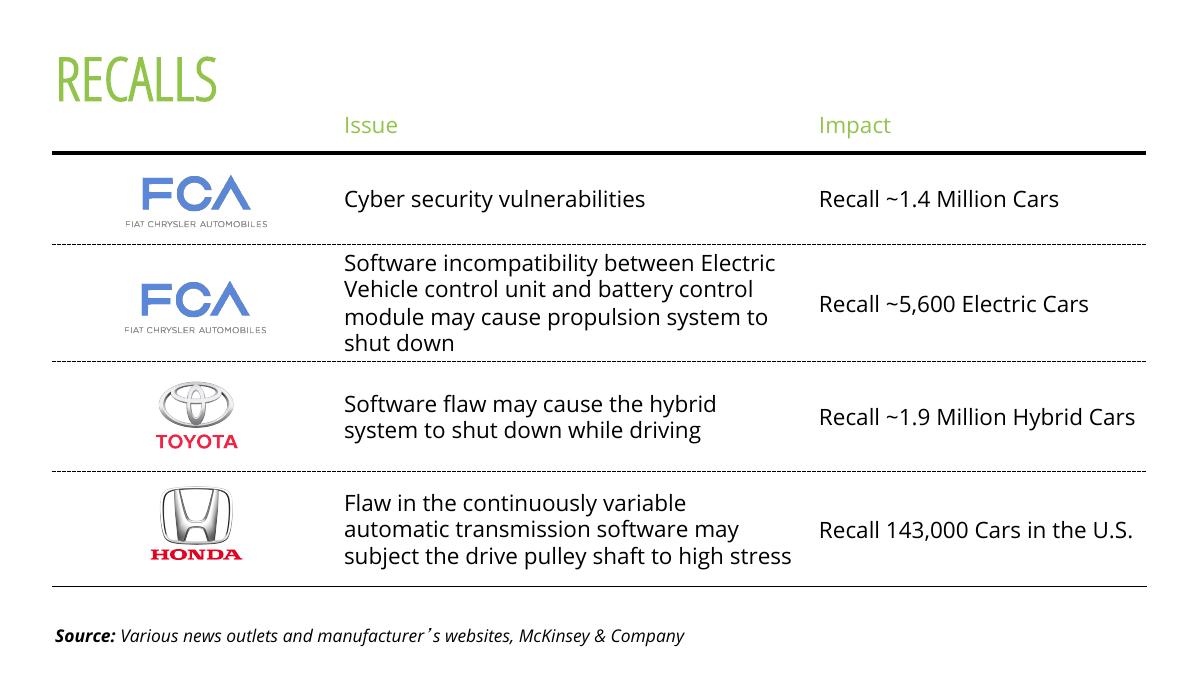
A four-row table of real recalls with manufacturer logos. FCA, cyber security vulnerabilities, recall ~1.4 million cars. FCA, software incompatibility between the electric vehicle control unit and the battery control module that may cause the propulsion system to shut down, recall ~5,600 electric cars. Toyota, a software flaw that may cause the hybrid system to shut down while driving, recall ~1.9 million hybrid cars. Honda, a flaw in the continuously variable transmission software that may subject the drive pulley shaft to high stress, recall 143,000 cars in the U.S. Source line: "Various news outlets and manufacturer's websites, McKinsey & Company."
Naming real manufacturers and real defects is a strong choice. These are not hypotheticals; every reader recognises at least one. The selection is also well made — all four are software or software-adjacent faults, which is precisely the failure class Acerta claims to catch.
Two things undercut it. First, the impact column is measured in vehicles, not dollars. A recall of 1.4 million cars is a headline; the number that moves an automotive executive's budget is what it cost, and public estimates for large software recalls run into hundreds of millions. The deck has chosen the unit that sounds big over the unit that sizes a purchase order. If the four rows had a fifth column headed "estimated cost", this slide would be doing commercial work rather than journalistic work.
Second, and more important, the slide never claims Acerta would have caught any of them. It sits between a problem slide and a solution slide and invites the reader to make the connection themselves. An investor with any automotive background will not: they will ask whether an anomaly-detection layer on sensor data could realistically have flagged a cyber security vulnerability, or a control-unit incompatibility that only manifests under specific conditions. The honest answer differs row by row. Picking the one recall Acerta's method genuinely addresses and walking through how — what signal, what deviation, how many vehicles into the fleet it would have surfaced — would be worth more than four rows the reader has to argue with silently.
"Various news outlets" is also not a citation. Four rows, four dates, four sources.
Slide 4 — Solution
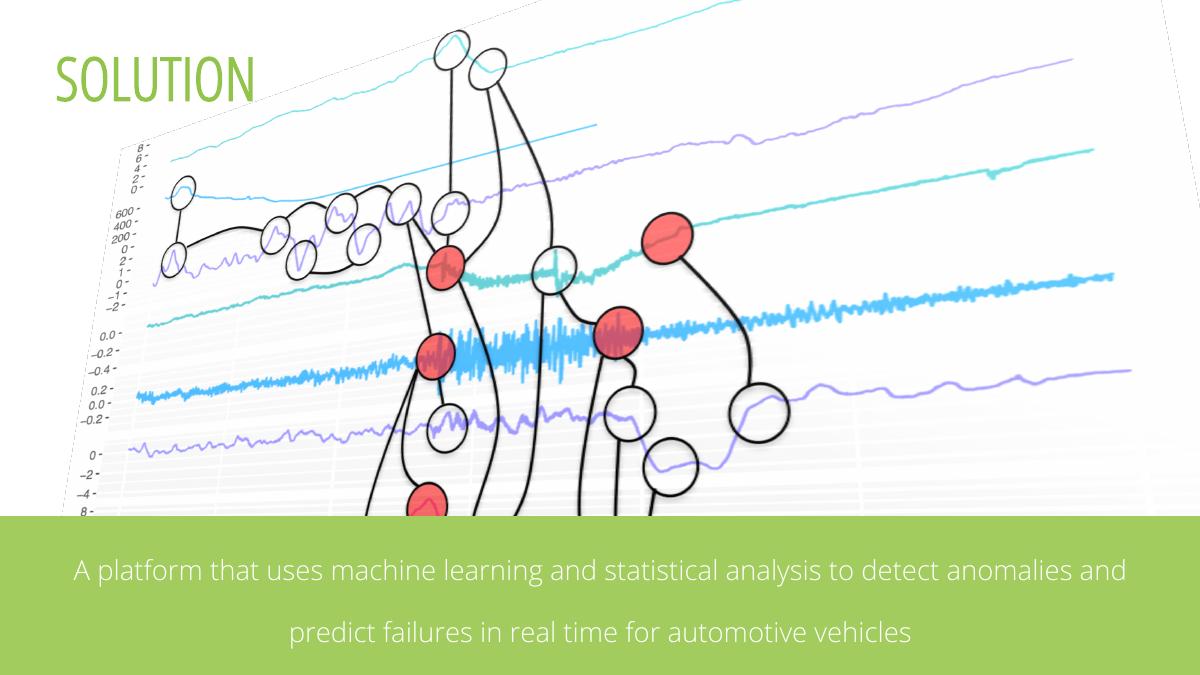
A visualisation of multivariate time-series data — four coloured signal traces with a network of nodes overlaid, several highlighted in red — above a green band reading: "A platform that uses machine learning and statistical analysis to detect anomalies and predict failures in real time for automotive vehicles."
The sentence is clear and the graphic is at least an honest depiction of the method rather than the usual stock illustration of a brain made of circuits. But the slide answers "what is it" and not one of the questions an investor asks next.
How accurate is it? What is the false-positive rate, and how far ahead of failure does it predict? Anomaly detection on vehicle data is a crowded research field, and the difference between a paper and a product is precision, recall, and lead time on real fleet data. There is not a single number on this slide, or anywhere in the deck.
Where does it run — in the vehicle, at the edge, in the cloud? What data does it need, and does the manufacturer have to instrument anything new? Is it a model per component, per platform, per manufacturer, and how long does deployment on a new vehicle line take? None of this is stated, and all of it determines whether the product is a licence sale or a three-year consulting engagement wearing a SaaS label.
Slide 5 — Solution, by customer
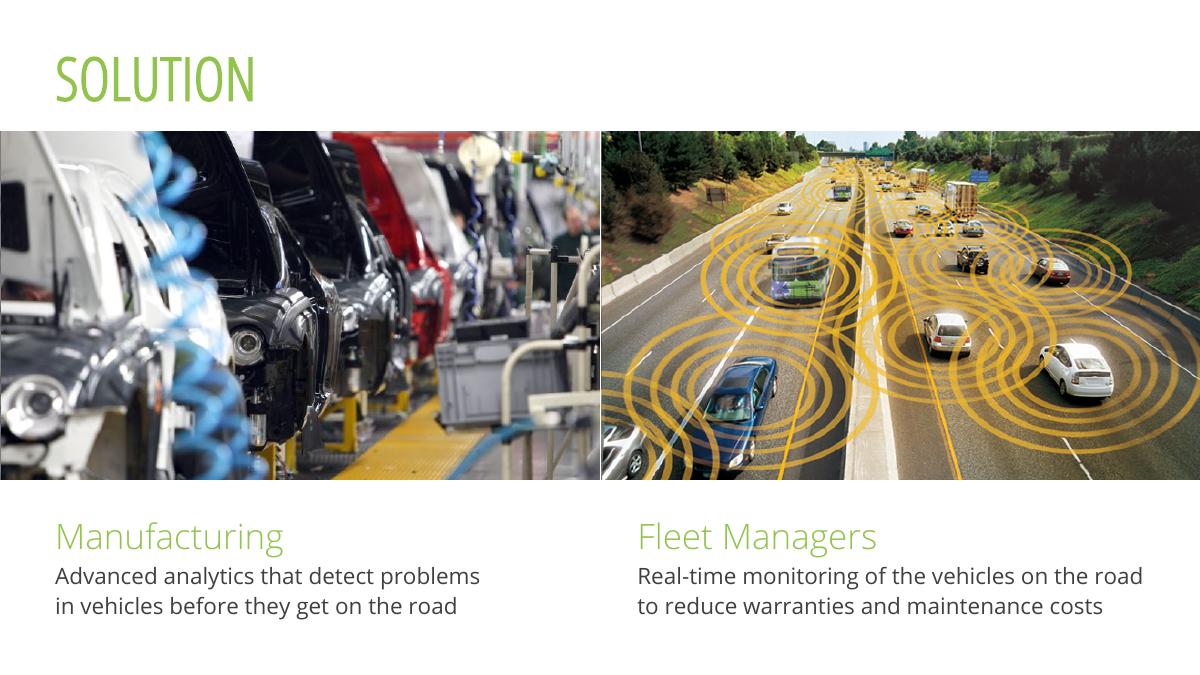
Two photographs — an assembly line and a highway with connectivity rings drawn over the traffic — under two headings. "Manufacturing: advanced analytics that detect problems in vehicles before they get on the road." "Fleet Managers: real-time monitoring of the vehicles on the road to reduce warranties and maintenance costs."
Splitting the customer into a factory buyer and a fleet buyer is a real insight, and both are legitimate markets. It is also the deck's biggest unexamined strategic decision, taken in a caption.
These are two different companies. Selling analytics into an OEM's manufacturing quality organisation means an eighteen-to-thirty-month enterprise cycle, a validation programme, plant-floor integration and a champion at director level. Selling fleet monitoring means telematics hardware compatibility, per-vehicle pricing, and competing with incumbents who already own the dashboard. Different buyers, different sales motions, different data pipelines, different pricing, different competitors.
A seed-stage team of six choosing both, in a caption, with no statement of which comes first, tells an investor the wedge has not been decided. The slide would be stronger if it said: manufacturing is the beachhead because our data is richest there and our advisors open those doors; fleet is the expansion market in year three. That is a strategy. Two photographs side by side is an option set.
Note also what the fleet caption promises — "reduce warranties and maintenance costs" — and what it does not: by how much. Warranty cost per vehicle is a published figure at most OEMs. A single percentage of warranty spend, applied to one manufacturer's annual number, would produce the value calculation this deck never makes.
Slide 6 — Why now
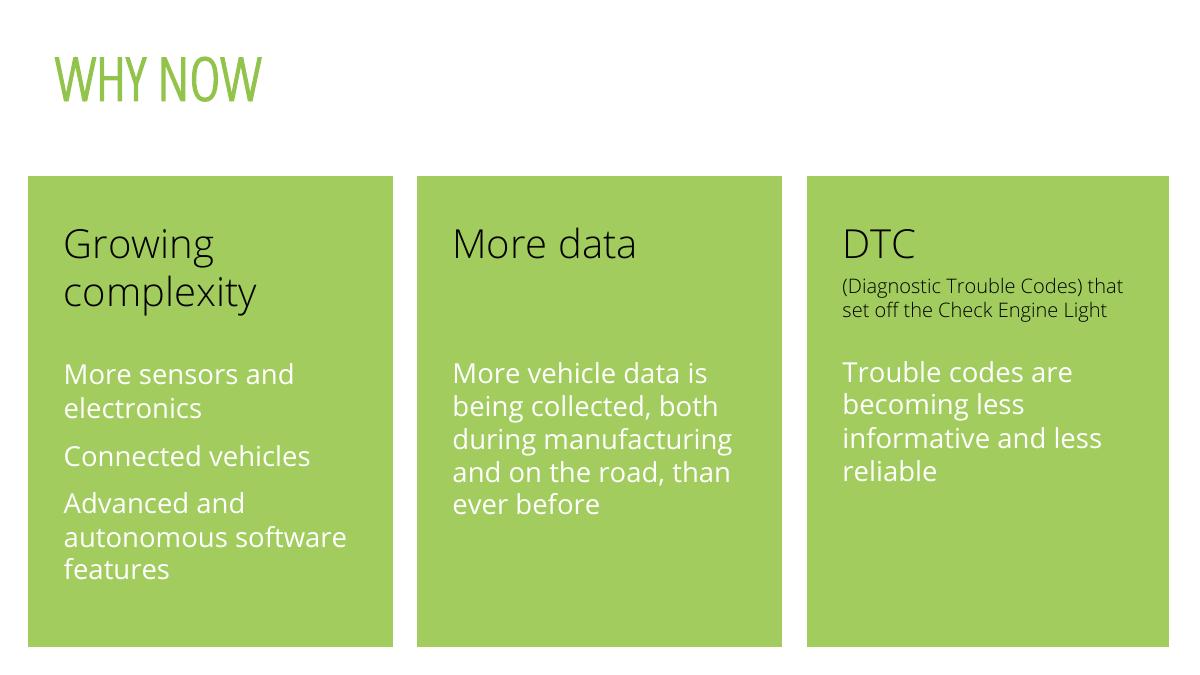
Three green panels. "Growing complexity" — more sensors and electronics, connected vehicles, advanced and autonomous software features. "More data" — more vehicle data is being collected, both during manufacturing and on the road, than ever before. "DTC (Diagnostic Trouble Codes) that set off the Check Engine Light" — trouble codes are becoming less informative and less reliable.
The third panel is the most valuable idea in the deck and it is buried in the third column of the sixth slide. Diagnostic trouble codes are the incumbent technology. Every vehicle has them, every mechanic reads them, and the argument that they degrade as vehicles get more complex — because a single code now maps to dozens of possible causes across interacting subsystems — is exactly why a statistical layer is needed. That is the "why now", and it deserves its own slide with an example: one real DTC, the list of things it could mean on a modern platform, and the time a technician wastes narrowing it down.
The first two panels are restatements of slides 2 and 4. A why-now slide should introduce a timing argument the deck has not already made twice.
Slide 7 — The global automotive market
A pie chart of the global automotive market: vehicle sales $2.45 trillion, insurance/financing/aftermarket $1.7 trillion, supplier $0.85 trillion. The supplier slice explodes into a bar split between hardware at $700 billion and software at $150 billion. A green panel on the right divides $150 billion by 90 million new cars produced per year to reach "$1,665 software supplier revenue per car manufactured". The source footnote lists sixteen research houses: IHS, Autofacts, Frost & Sullivan, KPMG, HBR, Bain, McKinsey, NHTSA, Technavio, the National Automobile Dealers Association, OEM reports, Capgemini, Thomson Reuters, Gartner, Oxford Economics and Strategy&.
The slide is beautifully made and structurally wrong in three ways.
First, the pie double-counts. Supplier revenue is not a slice alongside vehicle sales; it is an input to vehicle sales. Every dollar a supplier earns is already inside the price of the car the OEM sells. Drawing them as adjacent wedges of a $5 trillion whole means the whole is not a whole, and any investor who has looked at an automotive market map will see it immediately.
Second, the per-car calculation is arithmetic, not a market. Dividing total software supplier revenue by units produced yields an average, and averages of that kind cannot be used as a price anchor for one product. Acerta is not selling the whole software content of a car — it is selling one analytics layer. The $1,665 figure is the size of a category Acerta occupies a thin sliver of, presented in the visual position where a seed deck normally puts its own revenue opportunity. (For the record, $150 billion divided by 90 million is $1,667, not $1,665. A rounding slip on the deck's only piece of visible arithmetic is a small thing, and small things are exactly what get checked.)
Third, sixteen sources for one chart is not rigour, it is cover. No reader can trace which number came from which house, or which year any of them was published in. Two sources with figures and dates would be more persuasive than sixteen in a six-point footnote.
What is missing is the only market number that matters at seed: the served market Acerta can actually invoice. How many vehicle programmes launch per year, how many fleets above a given size exist in North America, what a plausible annual contract is worth, and what the resulting reachable revenue is. A top-down $5 trillion pie tells an investor the industry is large, which they knew. A bottom-up number tells them what a win looks like.
Slide 8 — Business model
Three green chevrons. POC (Proof of Concept) — "structured POC to demonstrate diagnostics and prognostics capability", labelled Validation. PILOT — "develop a prototype to integrate the analytics and monitor select vehicles", labelled Integration. EXPAND (SaaS) — "expand prototype into a full deployment by increasing the number of monitored vehicles", labelled Deployment.
Titling this slide "Business model" is the sharpest problem in the deck, because it is not one. It is a sales process. A business model states who pays, what they pay for, how much, and how often.
Every commercial question is open. Is the POC paid or free? What does a pilot cost? Is the expand stage priced per vehicle monitored, per vehicle line, per site, or per seat? What is the annual contract value of a deployed customer? How long does each stage take, and what percentage of POCs historically convert to pilots — a conversion rate any investor will ask for, and one this deck could not answer because there is no evidence any POC has been run.
The "(SaaS)" in parentheses on the third chevron is doing an enormous amount of unearned work. It is the only claim in twelve slides about how revenue arrives, and it appears as a bracketed aside. A deployment that requires a bespoke proof of concept, a bespoke integration, and per-manufacturer model development is not obviously SaaS — it may be excellent enterprise software with services attached, which is a fine business but carries a different gross margin and a different multiple. The word deserves defending, not parenthesising.
There is also a strategic risk this slide does not acknowledge: a land-and-expand motion into automotive OEMs means long unpaid or low-paid validation cycles before any recurring revenue. That is precisely why the missing ask and runway numbers matter — the model itself implies a long cash-consuming ramp.
Slide 9 — Competition
A six-row feature grid with four columns. The competitor columns carry logos and category labels: Manufacturers (OnStar, Ford), Telematics (Agnik, Zubie), General AI (DataRPM, Uptake), and Acerta. The rows are: geared for automotive systems; supports any OBDII hardware and data; works with any vehicle model; rich data; leverages manufacturing data; scales with vehicle complexity. Acerta has a filled green square on all six. No competitor has more than three.
The grouping is the good part. Sorting rivals into manufacturer-owned systems, telematics providers and general-purpose industrial AI platforms shows the founders understand that the threat comes from three directions at once, which is more sophisticated than the usual list of six logos.
The rest is the oldest anti-pattern in pitch decks: the all-green column. Six criteria, and the company that chose the criteria wins every one. No reader believes it, and the cost is not that they doubt one row — it is that they discount the whole slide, including the rows where the advantage is real.
The row that matters is "leverage manufacturing data", where Acerta is the only green square. That is a defensible and specific claim: analytics trained on end-of-line manufacturing data as well as in-service data is a genuinely different position from a telematics dongle. It should be the argument of the entire slide. Instead it is row five of six, weighted identically to "works with any vehicle model".
The grid also omits the competitor an automotive investor will name in the first minute: the Tier 1 suppliers — Bosch, Continental, Denso, Harman — all of which had connected-vehicle analytics efforts by 2017, and any of which could bundle this capability into an existing OEM relationship. And nowhere on the slide, or anywhere else, is there a defensibility claim: no patents, no proprietary dataset, no exclusive data access, nothing that says why an all-green column stays green after somebody with a billion dollars notices.
Slide 10 — Team
Six people with photographs and credentials. Greta Cutulenco, CEO — software engineer, University of Waterloo; two years of research in embedded and real-time systems during her master's; three years working with software systems in automotive, aerospace and nuclear; previously Magna, AECL and Qualcomm. Jean-Christophe Petkovich, CTO — master's in computer science and PhD candidate in computer engineering at Waterloo; five years of research in statistics and machine learning; open source contributions; previously QNX and Bombardier. Sebastian Fischmeister, Chief Scientist — PhD, PEng; associate professor at Waterloo; associate director of WatCAR; over sixteen years of research; experience managing a team of over fifteen and million-dollar budgets. Prashant Raghav, Chief Data Officer — master's in computer science, Waterloo; previously Amazon, SAS and Lenovo; four years with distributed systems including Hadoop and Spark. Gonen Hollander, COO — MBA from Rotman; seven years of navy service as a missile ship tactical officer and basic training team leader. Himesh Patel, Marketing and Business Development — management engineer, Waterloo; previously Whitehat Security, Broadcom and D2L.
This is a serious slide. The domain match is close to ideal: a CEO who has written software for automotive, aerospace and nuclear systems, a CTO out of QNX (the operating system in a large share of the world's automotive infotainment and safety systems), and a chief scientist who is associate director of the University of Waterloo's automotive research centre. For a company selling failure prediction to car manufacturers, that combination is the asset.
What the slide does not say is who is full-time. A named associate professor with a directorship and a PhD-candidate CTO raise an obvious question about commitment, and six people at pre-revenue raises another about salary. An investor will ask both. Answering in advance — full-time headcount, part-time advisory involvement, current burn — costs one line and removes a doubt.
It also never explains the origin story: whether the technology came out of Fischmeister's lab, and if so what the university's licensing position is. IP that originates in a Canadian university carries a specific set of questions about ownership and royalties, and a deck that lists a professor as chief scientist should answer them before being asked.
Slide 11 — Advisors
A Third Shore logo, unexplained, and two advisors. Mike Donoughe — twenty-five years as a VP at Chrysler overseeing manufacturing and engineering; EVP at Tesla Motors overseeing vehicle engineering, manufacturing, quality and supply chain; C-level executive with experience leading companies in all phases of execution. Chris Kondogiani — fifteen years of leadership with Fortune organisations, startups and new ventures; over ten years in vehicle engineering at Chrysler; MBA in finance and marketing.
Donoughe is the single most valuable line in the document. A person who ran manufacturing quality at Chrysler and then vehicle engineering and quality at Tesla is exactly the person who can get a Waterloo startup into the room where recall-prevention budgets are decided. That is worth more to this company than any market statistic on slide 7.
And the slide does nothing with it. There is no statement of what the advisors do — hours, equity, board seat, introductions made — and no consequence drawn. The sentence this deck needed, and never writes, is some version of: our advisors have opened conversations with the quality organisations at N manufacturers, and here is what came of them. Advisor logos are credibility; advisor-generated pipeline is traction. The deck buys the first and never converts it.
The Third Shore logo sits on the slide with no caption at all. If it is an investor, say so and say how much. If it is an incubator, label it. An unexplained logo on an advisor slide is a question mark, not a credential.
Slide 12 — Closing
No name, no title, no phone number, no website, no ask, no next step. After eleven slides of problem, market and team, the document ends by asking the reader to write to a shared inbox about nothing in particular.
What Acerta got right
The wiring harness slide. A single photograph that makes the problem undeniable without a word of statistics. Most technical founders over-explain the problem; this one shows it. · Naming real recalls at real manufacturers. FCA, Toyota and Honda with specific defects is far more persuasive than an abstract claim about software quality, and every one is checkable. · A one-line description that actually describes. "Real time analysis of vehicle data to diagnose and predict failure" survives being repeated by an investor to a partner who has not seen the deck — which is the real test of a tagline. · The degrading-trouble-codes argument. The observation that DTCs are becoming less informative as vehicles get more complex is the sharpest strategic idea in the deck and the strongest available answer to "why now". · Competitors sorted by type rather than listed. Manufacturers, telematics and general AI is a genuine map of where the threat comes from, and it shows the founders have thought past the obvious. · The manufacturing-data claim. Training on end-of-line production data as well as road data is a real differentiator that no dongle-based competitor can copy quickly. · Domain-matched credentials, specifically stated. Magna, Qualcomm, QNX, Bombardier, AECL, WatCAR — named employers a reader can evaluate, not adjectives. · An advisor who has run quality at both Chrysler and Tesla. For a company selling recall prevention, this is the highest-value name it could have recruited.
Where this deck would fail in an investor meeting
There is no ask. Twelve slides and no amount, no instrument, no valuation, no round name. The reader cannot act. · There is no traction slide. Not one customer, pilot, POC, letter of intent, contract or conversation is mentioned. For a company founded around a sales process built on POCs, the absence of a single completed POC is the loudest silence in the file. · There is no evidence the technology works. No accuracy, no false-positive rate, no prediction lead time, no dataset, no benchmark, no published result — from a team with two academics on it, which makes the omission stranger. · There is no pricing. Neither the POC, the pilot nor the "SaaS" deployment carries a number, so the market slide's billions cannot be connected to a single dollar of Acerta revenue. · There are no financials. No burn, no runway, no headcount plan, no projections, no unit economics. · The market pie double-counts. Supplier revenue is contained within vehicle sales; drawing them as neighbouring wedges inflates the whole and signals that the market page was assembled rather than modelled. · The TAM is not the company's TAM. $150 billion of automotive software supplier revenue is not addressable by a vehicle-analytics layer, and the $1,665-per-car figure is an industry average dressed as an opportunity. · Two customer segments, no wedge. Manufacturing and fleet are chosen simultaneously in captions, with no sequencing, and they imply two different sales organisations. · The all-green competition column. Winning all six of your own criteria persuades nobody and discounts the one row where the advantage is genuine. · No Tier 1 suppliers on the competitive map. Bosch, Continental, Denso and Harman are the obvious bundling threat and none appears. · No defensibility. No patents, no proprietary data, no exclusive access, no switching costs — nothing explaining why the advantage persists. · "Business model" is a sales funnel. POC to pilot to expand describes how a deal progresses, not how the company makes money. · The recall table never claims Acerta would have prevented any of it. The connection the whole deck rests on is left for the reader to assume. · "Various news outlets" and a sixteen-source footnote. Both are the appearance of sourcing rather than sourcing. · No go-to-market. Selling to automotive OEMs takes eighteen months and a champion; the deck never says who that champion is or how Acerta reaches them. · Team commitment unstated. Six people, two of them academics, and no indication of who is full-time or what anyone is paid. · University IP position unaddressed. A Waterloo professor as chief scientist raises licensing questions the deck leaves open. · Advisors listed but not converted. No introductions, meetings or pipeline attributed to the strongest asset on the page. · An unlabelled Third Shore logo. Either a credential or a puzzle, depending on a caption that is not there. · The closing slide is a shared inbox. No name, no next step, no date, no ask.
Numbers that do not reconcile
The pie adds to a whole that is not whole. Vehicle sales $2.45 trillion plus insurance, financing and aftermarket $1.7 trillion plus supplier $0.85 trillion is $5 trillion. But supplier revenue is embedded in the price of vehicles sold, so the same money is counted twice, and the chart form asserts a mutual exclusivity that does not exist.
$150 billion divided by 90 million is $1,667. The slide prints $1,665. The error is trivial in dollars and not trivial in signal: it is the only visible calculation in the deck, on the slide where the founders chose to show their arithmetic.
$1,665 per car is not a price Acerta can charge. It is the average software content sourced from all suppliers per vehicle — infotainment, powertrain control, ADAS, body electronics. An analytics layer is a small fraction of it, and the deck never estimates which fraction.
Recalls are counted in vehicles; value is created in dollars. 1.4 million cars is an impressive number that cannot be turned into a purchase justification. Cost per recall, multiplied by the probability reduction Acerta claims, is the calculation an OEM quality director needs — and it is the calculation the deck's own problem section sets up and then abandons.
A SaaS label on a services-shaped funnel. Three sequential custom engagements ending in a deployment priced per monitored vehicle can be SaaS or can be enterprise software with heavy professional services. The deck asserts the first in parentheses and supplies no gross margin, contract value or deployment timeline to support it.
How you would rebuild this deck without changing the company
Add an ask slide. Amount, instrument, valuation expectation, runway in months, and the three milestones the money buys — for example: three paid POCs converted to pilots, a published accuracy benchmark, and first recurring revenue. · Add a validation slide even if there are no customers yet. The dataset you have tested on, the failure classes you detect, precision and recall, prediction lead time, and the conditions under which the method fails. Two academics on the team makes this the easiest slide to write and the most damaging to omit. · Add a pipeline slide. Conversations in progress, by manufacturer type and stage, anonymised if necessary. "Four OEM quality organisations in discussion, two POC proposals submitted" is traction; silence reads as none. · Turn the recall table into a value calculation. Add a cost column, pick one row, and walk through how Acerta's method would have surfaced it earlier and what that would have saved. · Choose the wedge. State that manufacturing is first and why, with fleet as the year-three expansion. One sentence, on the solution slide. · Rebuild the market bottom-up. Vehicle programmes launched per year, addressable manufacturers, plausible annual contract value, resulting reachable revenue. Keep the pie as a backdrop if you like, but fix the double-count. · Price the business model. POC fee, pilot fee, expand pricing unit, target annual contract value, expected gross margin, and the time from first meeting to recurring revenue. · Cut the competition grid to three rows and lose two green squares. Lead with manufacturing data. Add Tier 1 suppliers as a fourth column. Conceding a row you genuinely lose makes the rows you win believable. · Add a defensibility line. Patents filed, proprietary data accumulating per deployment, or the switching cost created once models are trained on a manufacturer's own production data. · Promote the trouble-codes argument to its own slide. One real DTC, the causes it could indicate on a modern platform, and the diagnostic time it costs today. · Say who is full-time. One line under the team grid, plus the university IP position in a sentence. · Convert the advisors. Replace the bullet biographies with what they have produced: introductions made, doors opened, meetings held. · Rewrite the closing slide. A name, a title, a direct email, a phone number, the ask repeated, and the specific next step you want.
The transferable lesson
Acerta's deck is the mirror image of the usual failure. Most seed decks over-claim: inflated traction, invented projections, a hockey stick nobody believes. This one under-claims to the point of silence. It spends eleven slides establishing that a real, expensive, well-documented problem exists in an enormous industry, and that a credible team with an exceptional advisor is standing in front of it — and then it stops, without telling the reader what has been built, whether it works, who wants it, what it costs, or what the company needs.
That produces a specific and avoidable outcome. The deck gets the meeting, because the problem and the team are strong enough to earn one. Then the meeting becomes an interrogation: do you have a customer, does it work, what does it cost, how much are you raising. Every question the deck should have answered is asked out loud, and the founders spend their forty minutes on discovery instead of on the two or three things they actually wanted to discuss. Decks that answer the obvious questions in advance get meetings about strategy. Decks that leave them open get meetings about whether there is a company.
The underlying rule is that a pitch deck is not an explanation of a market. It is an argument that a specific team has found a specific wedge into that market, has evidence the wedge works, and needs a specific amount of money to widen it. Acerta had, on the evidence of this file, most of the ingredients for that argument in March 2017 — deep domain credentials, a real technical approach, and an advisor who could open the exact doors required. What version five is missing is not polish. It is the claim.
Frequently asked questions
- What is Acerta?
- Acerta is a Waterloo, Ontario company applying machine learning and statistical analysis to vehicle sensor data in order to detect anomalies and predict component failures in real time. The deck positions two customer segments: vehicle manufacturers, who want to catch defects during production before cars reach the road, and fleet managers, who want in-service monitoring to reduce warranty and maintenance costs. The team came largely out of the University of Waterloo's automotive research programme, with the associate director of WatCAR serving as chief scientist.
- What is the biggest problem with Acerta's pitch deck?
- There is no ask and no traction. Twelve slides go by without stating how much money the company wants, on what terms, what it will be spent on, or whether a single proof of concept has ever been run with a real manufacturer. The deck's own business model is built on POCs converting to pilots, which makes the absence of any completed POC the loudest gap in the file. An investor finishes reading with no action available to them.
- Why is the market slide wrong?
- It draws vehicle sales at $2.45 trillion, insurance/financing/aftermarket at $1.7 trillion and supplier revenue at $0.85 trillion as three wedges of one pie, but supplier revenue is an input to vehicle sales - the same money appears twice, so the wedges are not mutually exclusive. It then divides $150 billion of automotive software supplier revenue by 90 million cars to reach $1,665 per car, an industry-wide average across infotainment, powertrain, ADAS and body electronics that a single analytics layer cannot charge. The number a seed investor needs - reachable revenue built up from contract values - is absent.
- What should founders copy from the Acerta deck?
- The problem section. Slide 2 is a single photograph of a car's complete wiring harness with the body removed, captioned 'complexity of vehicles is growing exponentially' and 'existing diagnostic tools cannot keep up' - an argument made without statistics that no reader can dispute. Slide 3 then names four real recalls at FCA, Toyota and Honda with the specific software defects behind them. Naming real companies and real failures is far more persuasive than an abstract claim, and it is checkable.
- How should a deep-tech deck prove the technology works before it has customers?
- With a validation slide. State the dataset you tested on and where it came from, the failure classes you detect, precision and recall, how far ahead of failure you predict, the baseline you beat, and the conditions under which the method fails. A pre-revenue company cannot show contracts, but it can show results - and a team including an associate professor and a PhD candidate is better placed to produce that page than almost anyone. Omitting it leaves the reader unable to distinguish a working system from a research proposal.
- Is a POC-pilot-expand sequence a business model?
- No, it is a sales process. A business model states who pays, for what, how much, how often, and at what margin. A three-chevron funnel with no fee for the proof of concept, no pilot price, no pricing unit for the deployment, no annual contract value and no conversion rate between stages tells an investor how a deal advances but nothing about whether the resulting company is worth owning. Labelling the final stage 'SaaS' in parentheses is an assertion the rest of the deck never supports.