Academig’s pitch deck is a textbook example of the 'founder-problem fit' narrative. By spending the first eight slides on the personal struggle of finding a PhD position, the founders establish deep empathy for their target user. The solution positions itself as the 'Crunchbase for academia,' aiming to index 8,000,000 research labs. While the deck excels at defining the pain point and the two-sided revenue model—charging students $7/month and labs up to $550 for job postings—it lacks a specific financial 'Ask' and detailed unit economics. The traction slide shows promising growth toward a 50,…
Key takeaways
- The deck uses a heavy narrative opening, dedicating slides 2 through 8 to a personal story about the difficulty of finding PhD positions in Germany.
- Academig identifies a specific market gap: while ResearchGate and Google Scholar focus on individual researchers, Academig focuses on research labs (Slide 12).
- The company estimates a total market of 8,000,000 research labs globally (Slide 12).
- The business model is a two-sided network, charging researchers a $7 monthly subscription and labs $99-$550 for job postings (Slide 14).
- Future revenue streams include institutional plans for departments and data licensing via an API (Slide 15).
- Traction data shows a growth trajectory from May 2019, targeting 50,000 users and 10,000 research labs by December 2020 (Slide 16).
- The 'Ask' is non-financial, listing 'Team,' 'Network,' and 'Business' development rather than a specific dollar amount (Slide 17).
- The founding team possesses high academic credentials, including two PhDs in Quantum Physics and Stem Cell Biology (Slide 18).
The Narrative Arc: From Personal Pain to Platform Solution
Academig’s pitch deck is structured as a journey. It avoids the traditional 'Problem/Solution' bullet points in favor of a chronological story. This approach is highly effective for early-stage startups where founder-market fit is a primary concern for investors. By the time the viewer reaches the product slides, the founders have already proven they understand the user's frustration because they lived it.
Slides 1-8: The Problem as a Story
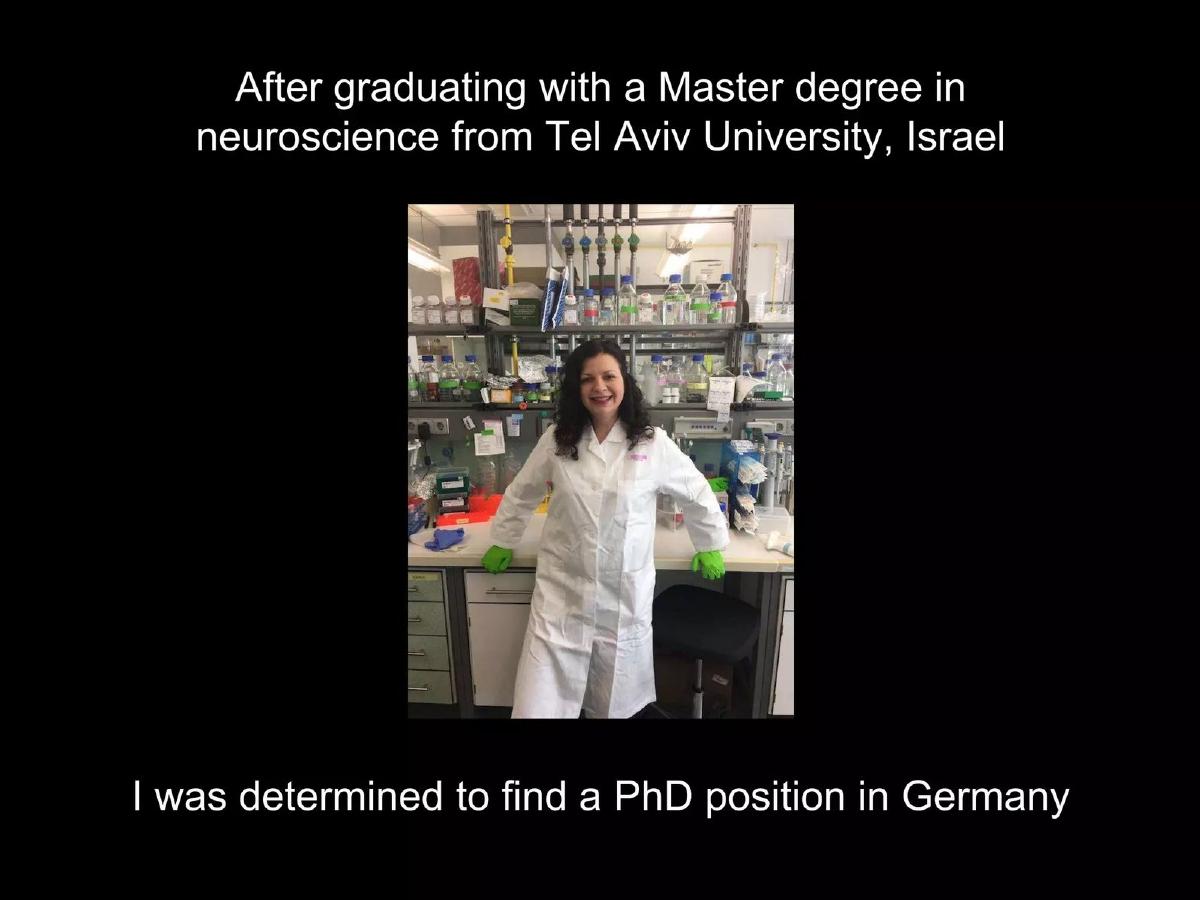
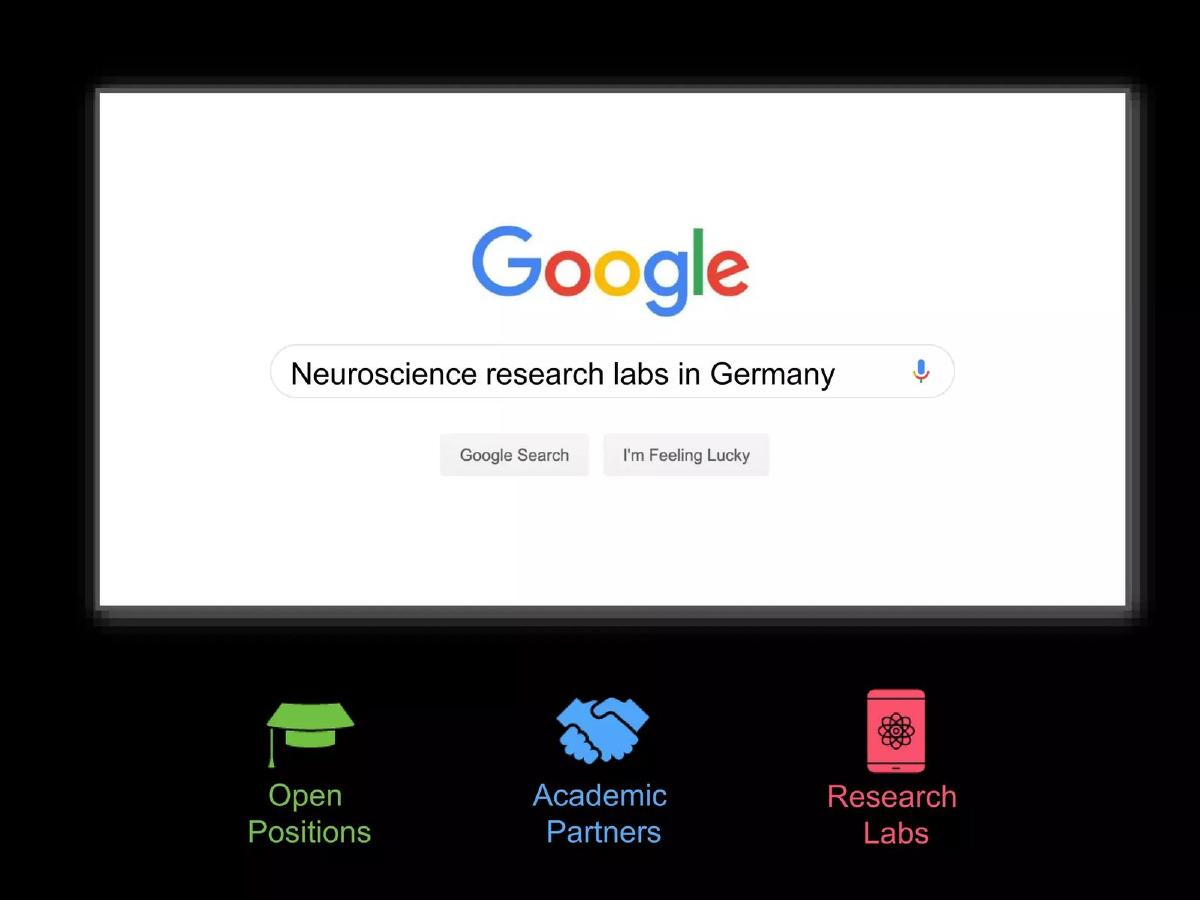
Slide 1 is a minimalist title slide featuring the Academig logo. Slide 2 introduces the protagonist: a Master's graduate in neuroscience from Tel Aviv University determined to find a PhD in Germany. This sets a specific, relatable context. Slide 3 illustrates the initial step—a Google search for 'Neuroscience research labs in Germany'—and identifies the three pillars of the search: Open Positions, Academic Partners, and Research Labs.
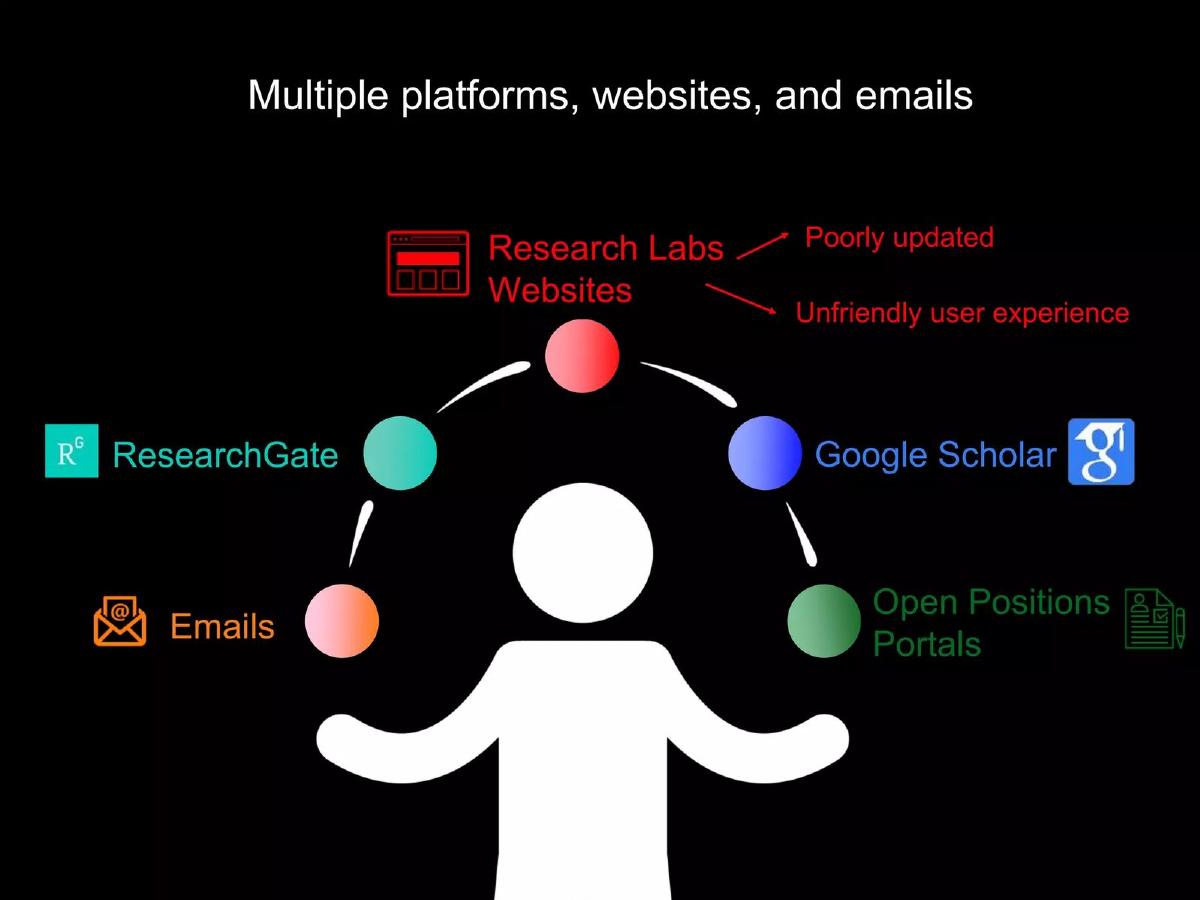
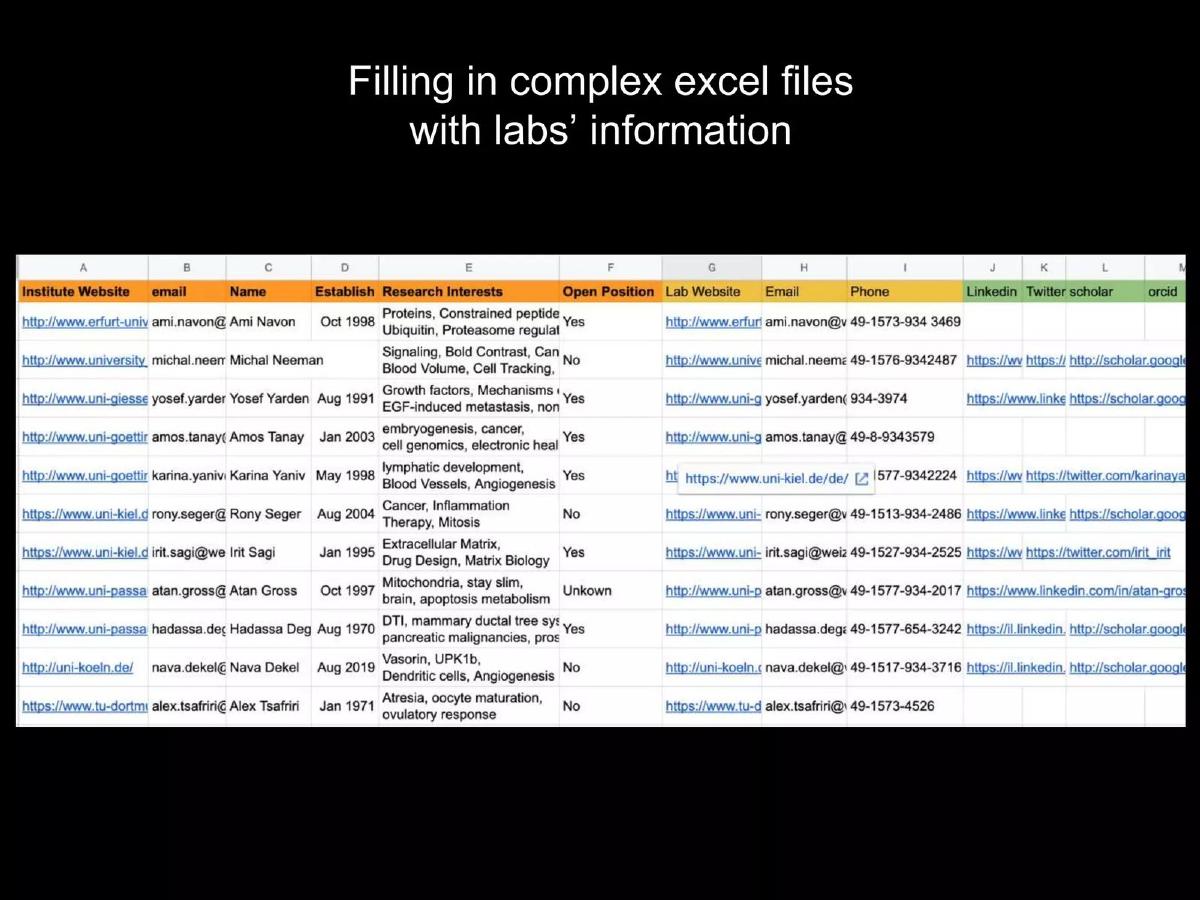
Slide 4 visualizes the chaos of the current process, showing a user juggling icons for ResearchGate, Google Scholar, emails, and poorly updated lab websites. Slide 5 provides 'proof of pain' by showing an actual complex Excel spreadsheet used to track lab data, including columns for 'Research Interests,' 'Lab Website,' and 'ORCID.' This is a powerful visual because it represents a manual process that is ripe for automation.
Slide 6 and 7 focus on the emotional toll, using phrases like 'I got upset and tired' and a missing puzzle piece graphic to represent the fear of missing 'amazing labs and great opportunities.' Slide 8 broadens the scope, providing testimonials from other researchers in Germany and Greece to prove this isn't just a personal problem, but a systemic one.
Slides 9-13: Defining the Solution and Market
Slide 9 acts as a transition, showing a field of flowers with the text 'In search for a better, more organized system.' Slide 10 defines the goal: helping researchers find all the academic data they need through a combination of 'Scraping,' 'Data-mining,' and the 'Human factor' to create structured data. This is the first hint at the technical backend of the platform.
Slide 11 provides a clear differentiation. It lists ResearchGate, Academia.edu, and Google Scholar as platforms that 'Focus on individual researchers,' while Academig 'Focuses on research labs.' It claims to be the 'world’s 1st platform dedicated solely to finding and listing research labs,' citing a total market of 8,000,000 labs. Slide 12 uses a 'Crunchbase for X' analogy, comparing Academig’s role in academia to Crunchbase’s role in the business world. This is a shorthand that investors immediately understand.
Slides 14-15: The Business Model
Slide 14 breaks down the 'Pricing Model' for a two-sided network. Students and researchers are charged a $7 monthly subscription. Labs are charged for 'Jobs posting' ($99-$550) and 'Lab building services' ($200). This shows a diversified revenue stream, though the deck does not explain what 'Lab building services' entails. Slide 15 looks forward, identifying 'Departments' (institutional plans) and 'Data Licensing' via an API as future revenue sources. The mention of 'Academic trends and analytics' suggests the founders see the long-term value in the data they are aggregating, not just the marketplace fees.
Slides 16-19: Traction, Team, and The Ask
Slide 16 presents a traction graph. The solid line shows growth from May 2019 to April 2020, reaching 4,000 users and 400 research labs. A dotted line projects a sharp increase to 50,000 users and 10,000 labs by December 2020. While the growth is visually impressive, the lack of a 'current' marker makes it difficult to tell if they are currently on track for that projection.
Slide 17 , titled 'What we are looking for,' is surprisingly vague. It lists 'Expand our team,' 'Connections with mentors and investors,' and 'Business development and valuations.' The absence of a specific dollar amount or equity offer is a missed opportunity to drive a concrete investment conversation. Slide 18 introduces the team: Rony Pozner (PhD in Quantum Physics) and Tatyana Pozner (PhD in Stem Cell Biology). Their academic pedigree is impeccable, providing high credibility for a product targeting the research community. Slide 19 lists three mentors/consultants with backgrounds in cancer genetics, healthcare coaching, and growth marketing, followed by a final contact slide.
What Works in the Academig Deck
Founder-Market Fit: The team’s academic credentials (two PhDs) and the personal story of the search for a PhD position make them the perfect people to build this product. · The Excel Slide: Showing the 'before' state (the manual spreadsheet) is the most effective way to demonstrate the necessity of the tool. · Clear Positioning: The comparison to Crunchbase and the distinction between 'individual-focused' and 'lab-focused' platforms clearly defines their niche. · Two-Sided Revenue: Identifying how to monetize both the researchers and the institutions shows a sophisticated understanding of marketplace dynamics.
What is Missing or Needs Improvement
The Financial Ask: Investors need to know how much money is being raised and what milestones that money will buy. 'Looking for valuations' is not a standard fundraising ask. · Product Depth: We see the 'what' and the 'why,' but very little of the 'how.' A few screenshots of the actual platform would help investors visualize the user experience. · Data Acquisition Strategy: The deck mentions 'Scraping' and 'Human factor,' but for a platform aiming to index 8 million labs, the scalability of the 'human factor' is a major question mark that isn't addressed. · Unit Economics: While pricing is listed, there is no information on Customer Acquisition Cost (CAC) or Lifetime Value (LTV), which are critical for a subscription/marketplace model.
Founder's Playbook: Lessons to Copy
Use the 'Before' Visual: If your product replaces a manual process, show the spreadsheet or the paper trail your users are currently suffering through. It is more persuasive than any chart. · The Power of Analogy: Comparing yourself to a well-known success (Crunchbase) helps investors categorize your business model instantly. · Credentialing: If you have a PhD or specialized experience in your field, lead with it. In highly technical or academic markets, the 'Dr.' title acts as a significant trust signal.
Frequently asked questions
- What is the primary problem Academig is trying to solve?
- Academig addresses the fragmented nature of academic data. Currently, researchers must navigate poorly updated lab websites, ResearchGate, Google Scholar, and various job portals to find opportunities. As shown on Slide 5, this often results in researchers manually creating complex Excel files to track lab information, leading to inefficiency and the fear of missing out on high-quality opportunities.
- How does Academig plan to make money?
- The deck outlines a two-sided revenue model on Slide 14. For the 'demand' side, students and researchers pay a $7 monthly subscription. For the 'supply' side, research labs pay between $99 and $550 for job postings and $200 for 'lab building services.' Slide 15 also suggests future revenue from departmental plans and data licensing through an API.
- What is the current traction of the platform?
- Slide 16 displays a growth chart starting in May 2019. By April 2020, the platform reached 4,000 users and 400 research labs. The deck projects a significant 'hockey stick' growth curve aiming for 50,000 users and 10,000 research labs by December 2020, though it does not specify the current month of the pitch.
- Who are the competitors mentioned in the deck?
- The deck identifies ResearchGate, Academia.edu, and Google Scholar as existing platforms in the space on Slide 12. However, it differentiates Academig by stating these competitors focus on individual researchers, whereas Academig is the first platform dedicated solely to finding and listing research labs.
- What is missing from this pitch deck?
- The most notable omission is a specific financial 'Ask.' Slide 17 mentions looking for 'Business development and valuations' and 'Connections,' but does not state a fundraising target (e.g., $500k for 18 months of runway). Additionally, there is no detailed breakdown of the 'Human factor' in their data scraping process or a competitive matrix beyond a high-level focus comparison.