The AccessBank 2013 investor presentation is a data-heavy document that prioritizes financial transparency and macroeconomic context. Operating in Azerbaijan, the bank positions itself as a market leader in micro and SME lending, supported by a diverse group of international refinancing partners including the ADB, EBRD, and IFC. The deck highlights exceptional asset quality, with a Portfolio at Risk (PaR) > 30 days of just 0.36% as of Q3 2013. While the presentation lacks a formal 'ask' or specific funding round details in the provided slides, it effectively communicates operational scale thr…
Key takeaways
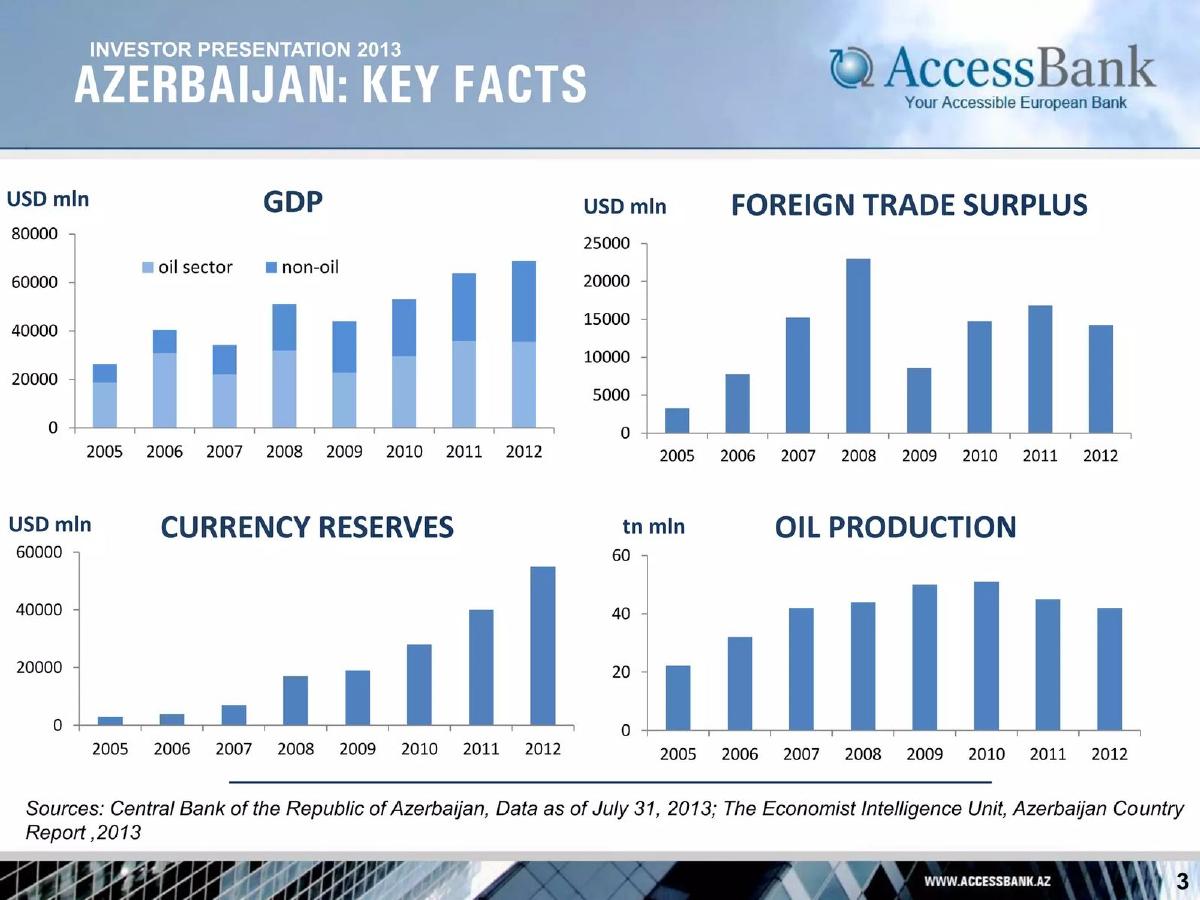
- Macroeconomic stability is established early, citing Azerbaijan's currency reserve growth from near-zero in 2005 to over $50,000 million in 2012 (Slide 3).
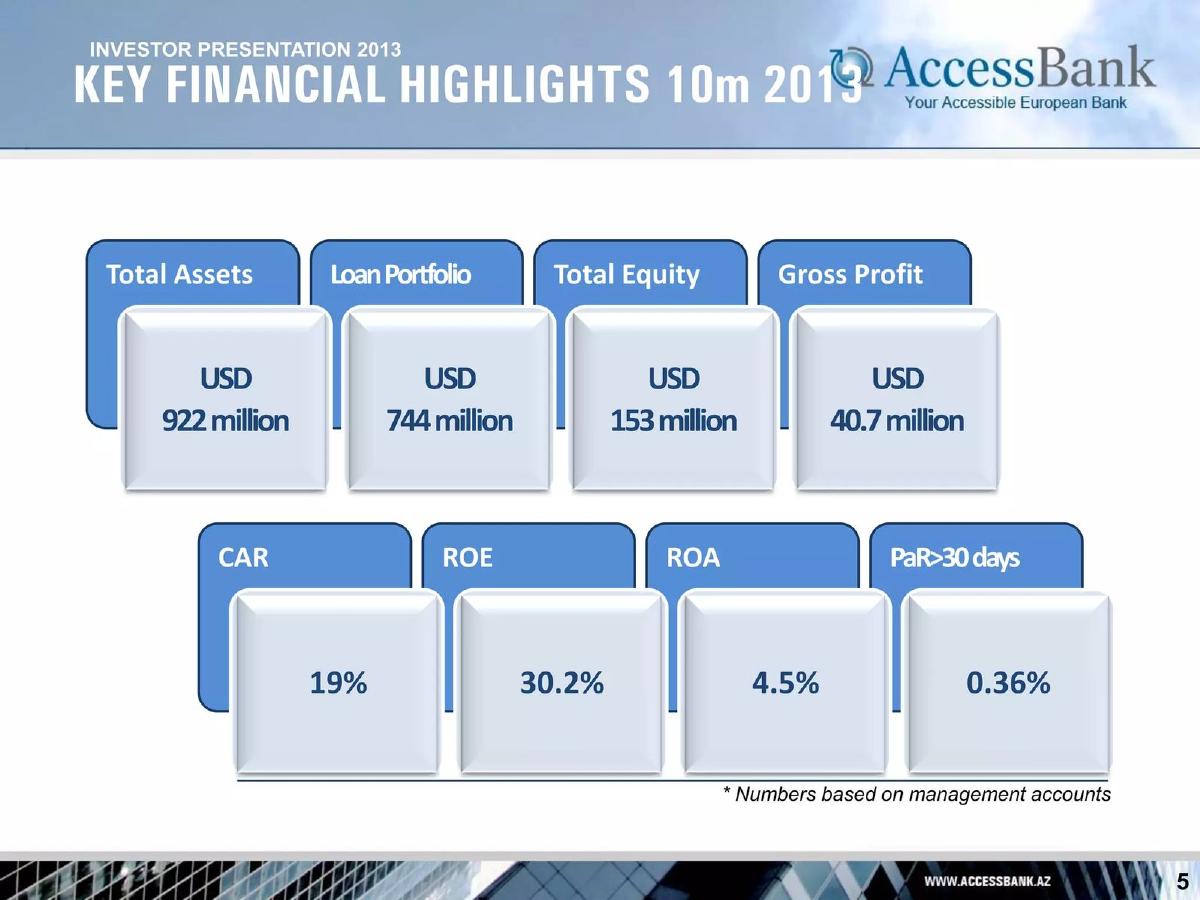
- The bank demonstrated significant scale by Q3 2013, reporting Total Assets of $922 million and a Loan Portfolio of $744 million (Slide 5).
- Asset quality is a primary differentiator, with Portfolio at Risk (PaR) > 30 days dropping from 1.09% in 2010 to 0.36% in Q3 2013 (Slide 10).
- Micro-lending is the core business driver, accounting for 45% of the loan portfolio and serving 105,384 clients (Slide 8).
- Profitability metrics are robust, with a Return on Equity (ROE) of 30.2% reported for the first 10 months of 2013 (Slide 5).
- Operational efficiency improved significantly in 2013, with the Cost/Income Ratio falling to 60.3% from a high of 72.2% in 2012 (Slide 10).
- The bank maintains a strong physical presence with 37 total branches, including 14 in the capital city of Baku (Slide 12).
- Refinancing credibility is bolstered by a list of 14 major international partners, including Deutsche Bank and the OPEC Fund for International Development (Slide 17).
Executive Summary: The Regional Powerhouse Model
The AccessBank Investor Presentation from Q3 2013 is a comprehensive look at a financial institution that has successfully navigated the transition from a niche micro-lender to a dominant regional player in Azerbaijan. The deck is characterized by its heavy reliance on audited and management account data, providing a level of transparency that is often missing in emerging market pitches. By focusing on high-yield micro-loans and maintaining exceptionally low default rates, AccessBank presents a model of profitable, risk-mitigated growth.
Slide 1: Title and Positioning
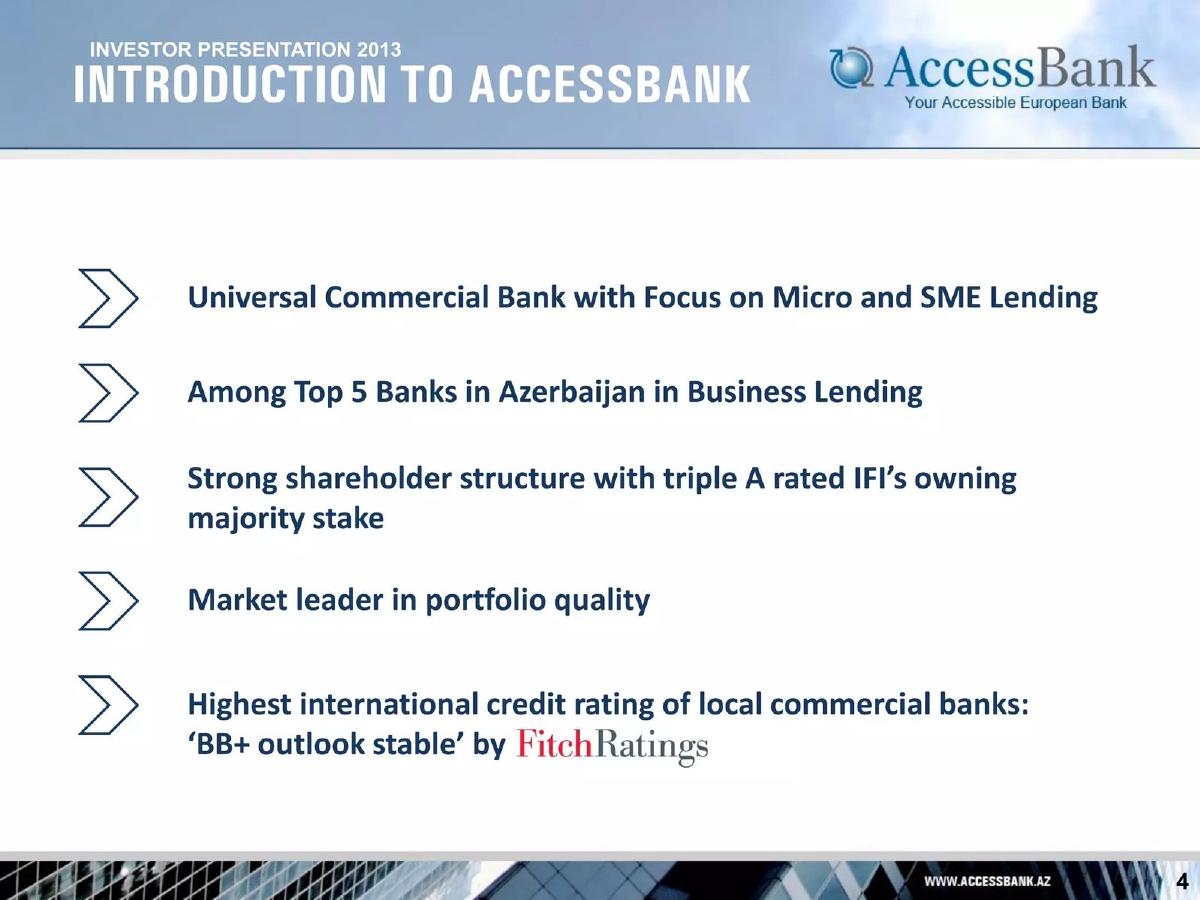
The cover slide introduces the tagline "Your Accessible European Bank." This is a strategic positioning move, likely intended to distance the institution from local competitors by implying European standards of governance, transparency, and reliability, despite its primary operations being in Azerbaijan.
Slide 3: Macroeconomic Context of Azerbaijan
Before discussing its own financials, AccessBank spends significant time on the health of Azerbaijan's economy. Slide 3 presents four key charts: GDP (split by oil and non-oil sectors), Foreign Trade Surplus, Currency Reserves, and Oil Production. The data shows a country with a massive trade surplus and currency reserves that grew from nearly zero in 2005 to over $50,000 million by 2012. This slide is crucial for international investors who may be wary of regional volatility; it establishes that the bank operates in a liquid, resource-rich environment.
Slide 5 & 6: Comparative Financial Performance
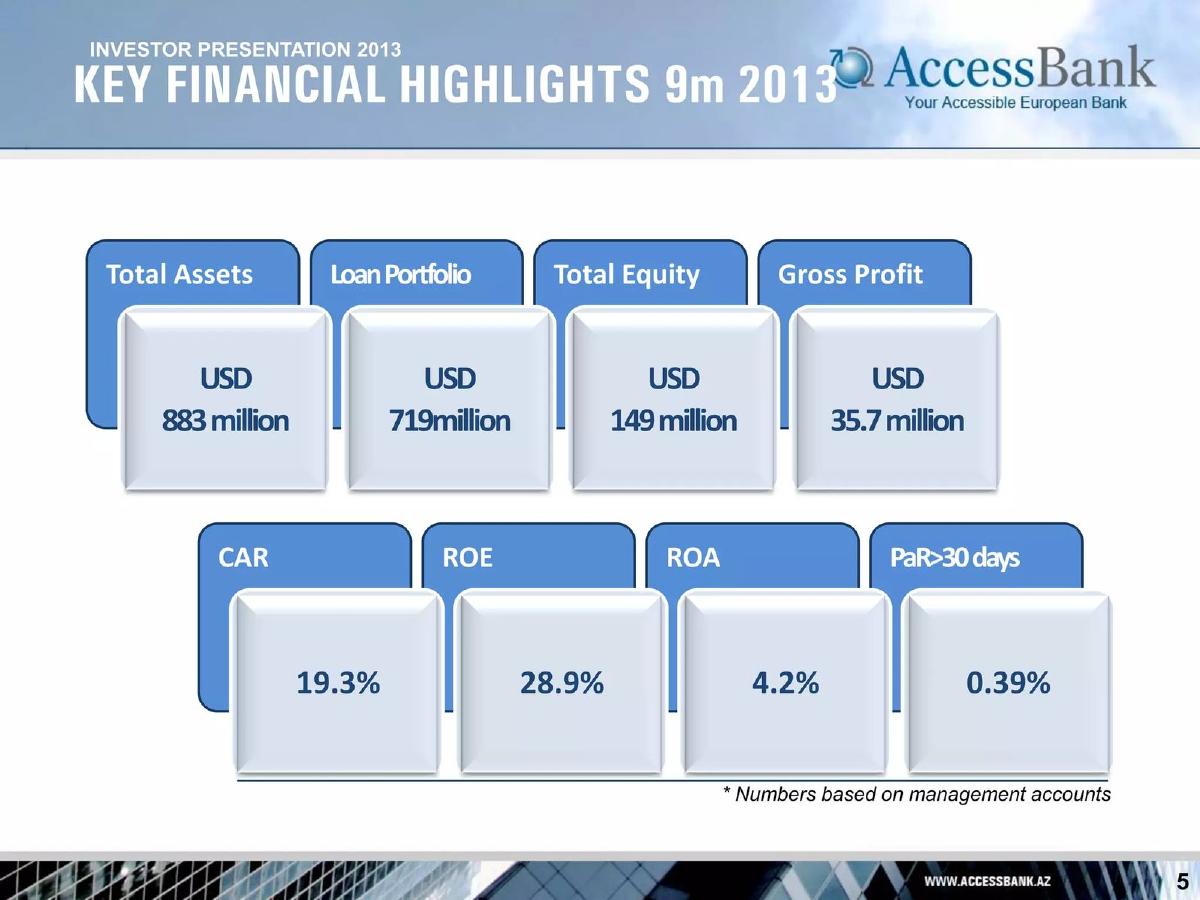
Slides 5 and 6 provide a side-by-side comparison of the bank's performance in 2012 versus the first ten months of 2013. The growth is stark. Total assets increased from $656 million to $922 million. Most impressively, the Return on Equity (ROE) jumped from 18.6% in 2012 to 30.2% in 2013. The bank also highlights its Capital Adequacy Ratio (CAR) at 19%, well above typical regulatory requirements, signaling a strong balance sheet capable of absorbing shocks.
Slide 8: Loan Portfolio Segmentation
This slide breaks down the core of the business. The loan portfolio is divided into four segments: Micro, SME, Retail, and Mortgage. Micro-loans are the clear leader, representing 45% of the portfolio ($329 million) and serving 105,384 clients. SME loans follow closely at 42% ($304 million), but with only 2,186 clients. This indicates that while the dollar amounts are similar, the Micro segment provides massive diversification of risk across a large client base. Mortgage and Retail loans remain small, representing only 3% and 10% of the portfolio, respectively.
Slide 10: Key Financial Ratios and Efficiency
Slide 10 is perhaps the most important for a sophisticated investor. It tracks four metrics from 2009 to Q3 2013: Pre-tax Profit, ROAE, Asset Quality, and Cost/Income Ratio. The Asset Quality chart shows a remarkable trend: Portfolio at Risk (PaR) > 30 days peaked at 1.09% in 2010 and fell to a mere 0.36% by Q3 2013. For a micro-lending institution, a sub-1% default rate is world-class. Additionally, the Cost/Income ratio, which spiked to 72.2% in 2012, was brought down to 60.3% in 2013, showing improved operational efficiency as the bank scaled.
Slide 12: Outreach and Infrastructure
The bank visualizes its physical footprint on a map of Azerbaijan. With 37 branches and 1,758 employees, the bank has a significant physical presence. The slide notes that 23 of these are regional branches, while 14 are concentrated in the capital, Baku. This supports the bank's stated strategy of focusing on regional and agricultural lending, as physical proximity is often a requirement for effective micro-lending oversight.
Slide 14: Future Strategy
The strategy slide is concise, listing five objectives: maintaining leadership in Micro and SME lending, focusing on regions and agro-lending, and expanding mortgage lending. This suggests that the bank is not looking to pivot away from its core strengths but rather to deepen its penetration in underserved regional markets and diversify into longer-term assets like mortgages.
Slide 17: Refinancing Partners
This slide acts as a "trust" page. By listing partners like the Asian Development Bank (ADB), KfW, EBRD, and IFC, AccessBank demonstrates that it has already passed the rigorous due diligence processes of the world's most prominent development finance institutions. The inclusion of Deutsche Bank adds commercial banking credibility to the list.
Slide 19: Contact Information
The final slide provides direct contact details for Farida Pirverdiyeva (International Partner Relations Manager) and Sascha Deutsch (Executive Assistant to the Management Board). The inclusion of a management board assistant as a primary contact suggests a flat organizational structure where investor relations are handled close to the top decision-makers.
What Works in This Deck
Transparency and Data Density: The deck does not shy away from hard numbers. By providing five-year trends for critical ratios like ROAE and PaR, the founders build a narrative of consistent improvement rather than a one-time fluke. The use of both management accounts and IFRS audited figures adds a layer of professional rigor.
Risk Mitigation Narrative: For a bank in an emerging market, the biggest hurdle is the perception of risk. AccessBank addresses this head-on by showing a shrinking default rate and a massive increase in national currency reserves. They prove that their specific micro-lending methodology works even in a complex geographic region.
Institutional Validation: The list of refinancing partners is a powerful signal. It tells a new investor that they aren't the first to the table and that the bank's books have been scrutinized by the EBRD and IFC.
What is Missing
The Ask: The provided slides do not include a specific funding request. While this is an "Investor Presentation," it functions more like an annual report or a general update than a specific pitch for a new round of equity or debt. There is no mention of how much capital is being sought or what the specific terms are.
Competitive Landscape: The deck operates in a vacuum regarding other banks in Azerbaijan. It claims to be a "Market Leader," but it does not provide market share percentages or a comparison against other local or international banks operating in the region.
Technology Stack: For a bank with over 100,000 micro-clients, the operational burden of loan processing must be significant. The deck mentions nothing about the bank's digital transformation, mobile banking capabilities, or the software used to manage its vast branch network.
Founder's Playbook: What to Copy
Macro-to-Micro Flow: Start with the big picture. If you are in a niche or a specific geography, prove the market is healthy before you prove your company is healthy. AccessBank’s use of GDP and trade data is a perfect example of setting the stage.
Standardized Metrics: Use the metrics your industry cares about. For banking, that’s CAR, ROE, and PaR. For a SaaS company, it would be CAC, LTV, and Churn. AccessBank doesn't invent new ways to measure success; it uses the industry standard and shows it is winning by those rules.
Visualizing the Footprint: If your business has a physical component, show it on a map. The branch map in Slide 12 immediately communicates the scale of the operation in a way that a simple list of cities never could. It shows the "moat" of physical infrastructure that a digital-only competitor would have to overcome.
Frequently asked questions
- What is the primary focus of AccessBank's lending operations?
- Based on Slide 8, AccessBank is primarily a micro-lending institution. As of the first 10 months of 2013, the Micro portfolio represented 45% of its total loan volume ($329 million) and the vast majority of its client base, with 105,384 micro-loan clients compared to just 2,186 SME clients.
- How does the bank justify its stability to international investors?
- The bank uses Slide 3 to provide a macroeconomic overview of Azerbaijan. It highlights a consistent foreign trade surplus, rising oil production, and a massive increase in currency reserves. This frames the bank's operational success within a stable, growing national economy, reducing perceived regional risk for foreign partners.
- What do the financial highlights say about the bank's growth between 2012 and 2013?
- The bank saw rapid expansion. Total assets grew from $656 million in 2012 (Slide 6) to $922 million by Q3 2013 (Slide 5). Similarly, gross profit rose from $26 million in 2012 to $40.7 million in just the first 10 months of 2013, indicating a significant increase in operational velocity.
- Who are the key institutional backers mentioned in the deck?
- Slide 17 lists 14 'Largest Refinancing Partners.' These include major development and commercial entities such as the Asian Development Bank (ADB), FMO, KfW, European Bank for Reconstruction and Development (EBRD), International Finance Corporation (IFC), and Deutsche Bank. This list serves as a powerful validation of the bank's compliance and stability.
- What is the bank's strategy for future growth according to the slides?
- Slide 14 outlines a five-pillar strategy: maintaining its market leadership in micro and SME lending, increasing its focus on regional and agricultural lending, and expanding its mortgage lending portfolio. This suggests a move toward diversifying its loan book while leveraging its existing regional branch infrastructure.