Mobility and Automotive Market Size Slides: 6 Real Examples
How car, parking, dealer and vehicle-tech startups size their market: vehicles × spend per vehicle, dealers × spend, or segment totals.
Mobility Market Slide: Vehicles, Spend per Vehicle and Where You Start
Vehicles are easy to count. Registrations, fleets and dealer numbers are published in most countries, so a mobility startup can usually build its market from the ground up: how many vehicles or businesses, and what each spends on the thing you sell. The slides below range from a complete vehicles-times-spend calculation to a single number with no source.
TL;DR
Count the vehicles or businesses you serve, multiply by annual spend on your category, and show the city or region you start in. MechanicBaba is the clearest example: cars in India × $225 a year on service and repairs, then the same sum for Delhi-NCR as its first-year market. Global or segment totals (DarTrays, The Smart Tire Company) give context but don't show how the startup reaches that spend.
Mobility market slides from real pitch decks
Each example shows the slide above its analysis and links to the full teardown. Bottom-up slides come first. Claims are as shown on the slides; comments and calculations are ours.
MechanicBaba market slide — slide 5
Car service and repair platform, India.
MechanicBaba deck, slide 5. Exact stored slide matched to this analysis.
Our analysis: Vehicles × spend, country then launch city, sourced.
Evidence and limitation: Every step is shown: vehicles, spend per vehicle, total, then a launch city with sources. Our checks: the slide says 22 million cars but multiplies 21 million; 21M × $225 = $4.7B and 22M × $225 = $4.95B, both rounded to $5B. The Delhi-NCR sum is exact. Calling the one-city figure a TAM is loose; it works as the first-year market.
What a founder can adapt: "[N] vehicles ([source]) × $[spend]/year = $[X]. Launch [city]: [M] × $[spend] = $[Y]."
Supporting analysis
What the deck claims: "What is the size of the opportunity." "Market size calculation (India): Number of cars - 22 million; Average annual maintenance cost per car - $225 (annual service & repairs); Total Addressable Market (TAM) - 21 million X $225 = $5 billion." "Market for next 1 year (Delhi-NCR): Number of cars - 3 million (approx.); Average annual maintenance cost per car - $225; Total Addressable Market (TAM) - 3 million X $225 = $675 million." Footnotes cite data.gov.in, SIAM and knowindia.net.
Presentation choice: Investors can check every number and see where the company starts.
When it does not fit: Using different vehicle counts in the text and the sum.
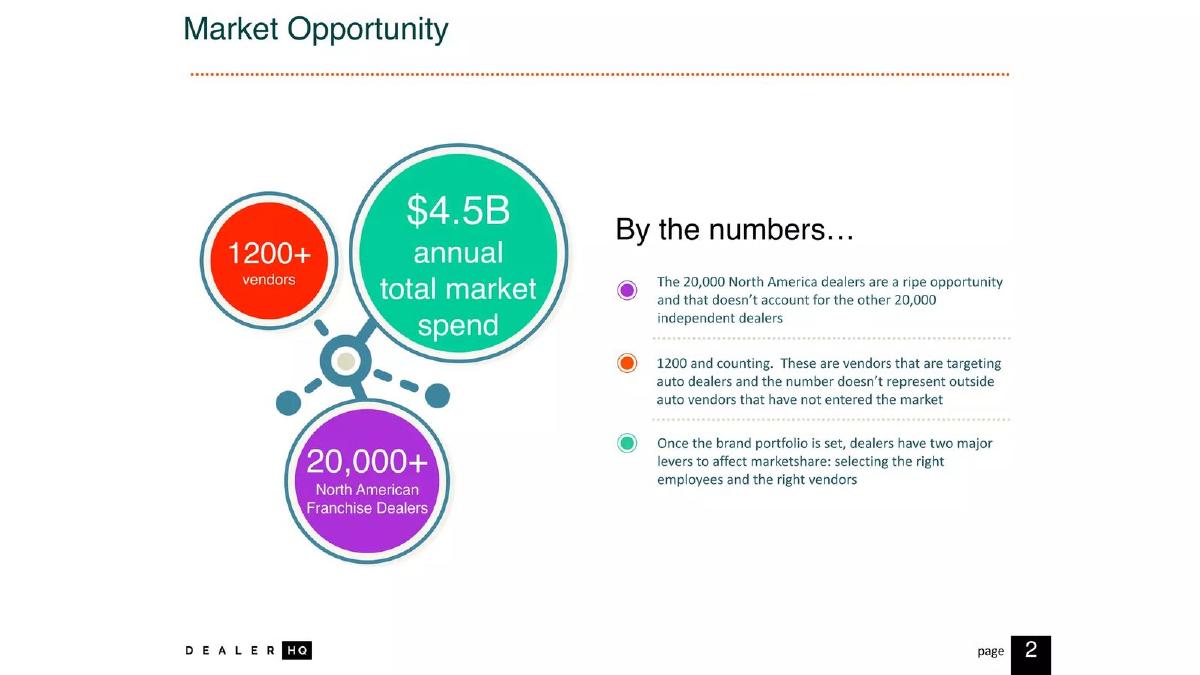
DealerHQ deck, slide 3. Exact stored slide matched to this analysis.
Our analysis: Business count and total spend.
Evidence and limitation: It names the buyer (franchise dealers), counts them and gives an annual spend. Our calculation: $4.5B ÷ 20,000 dealers ≈ $225,000 per dealer a year. The slide doesn't say what that spend covers or where it comes from, or whether DealerHQ earns from dealers or vendors.
What a founder can adapt: "[N] dealers × $[spend on category] = $[X] ([source]); we earn [fee] from [side]."
Supporting analysis
What the deck claims: "Market Opportunity." "$4.5B annual total market spend." "20,000+ North American Franchise Dealers." "1200+ vendors." "By the numbers ... The 20,000 North America dealers are a ripe opportunity and that doesn't account for the other 20,000 independent dealers." "1200 and counting. These are vendors that are targeting auto dealers." "Once the brand portfolio is set, dealers have two major levers to affect marketshare: selecting the right employees and the right vendors."
Presentation choice: Naming and counting the buyer is the right base.
When it does not fit: Leaving the spend category undefined.
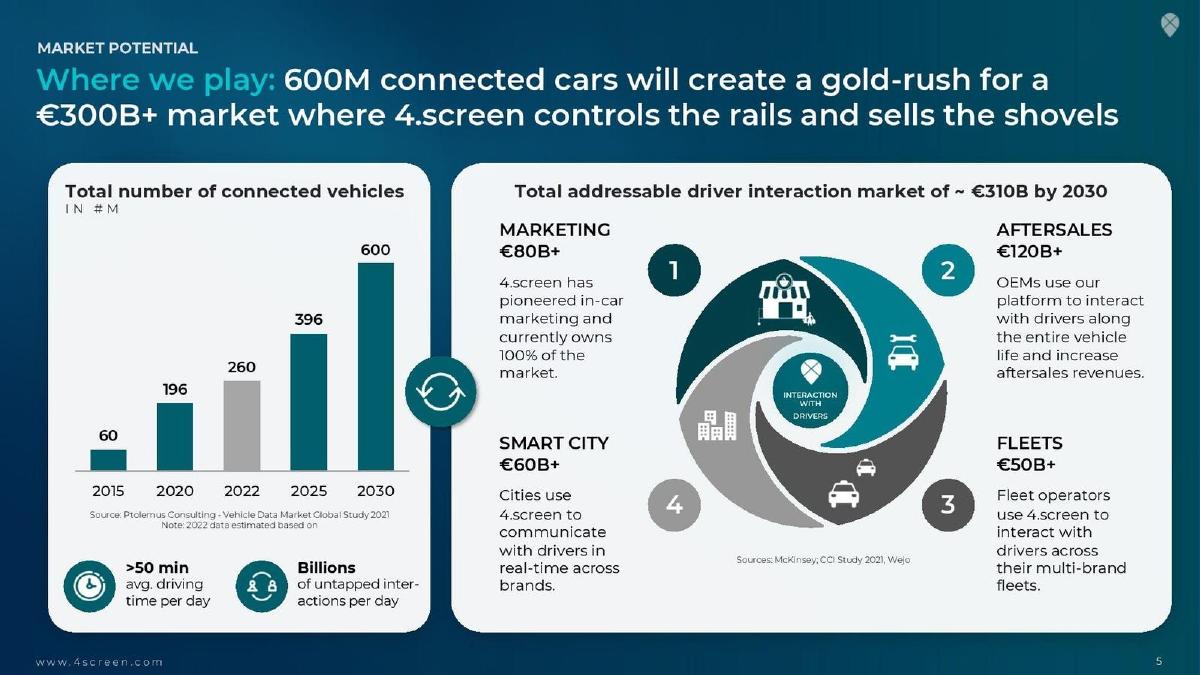
4.screen deck, slide 5. Exact stored slide matched to this analysis.
Our analysis: Sourced vehicle count and a four-part total.
Evidence and limitation: It sources the vehicle count and breaks the total into four buyer groups. Our check: 80 + 120 + 50 + 60 = €310B, matching the total. All four segments are 2030 figures, and only marketing is described as a current business; "owns 100% of the market" is the company's claim.
What a founder can adapt: "[Segment A] €[X] + [B] €[Y] = €[Z] by [year] ([source]); today we serve [A]."
Supporting analysis
What the deck claims: "Where we play: 600M connected cars will create a gold-rush for a €300B+ market where 4.screen controls the rails and sells the shovels." "Total number of connected vehicles (in #M)": 60 (2015), 196 (2020), 260 (2022), 396 (2025), 600 (2030); source: Ptolemus Consulting, Vehicle Data Market Global Study 2021. "Total addressable driver interaction market of ~€310B by 2030": Marketing €80B+ ("4.screen has pioneered in-car marketing and currently owns 100% of the market"), Aftersales €120B+, Fleets €50B+, Smart city €60B+. Sources: McKinsey; CCI Study 2021; Wejo.
Presentation choice: Breaking the total into buyers shows where revenue would come from.
When it does not fit: A future total without the current segment's size.
Marketplace for renting private parking spaces, Australia.
Parkhound deck, slide 5. Exact stored slide matched to this analysis.
Our analysis: Global and country totals with a supply count.
Evidence and limitation: It gives a home-country figure next to the global one and a count of supply. The slide doesn't say what the $1.5B covers (all parking, or private rentals), give sources, or link the 184k properties to either figure.
What a founder can adapt: "[N] spaces × $[monthly rent] × 12 × [take]% = $[X] in [city] ([source])."
Supporting analysis
What the deck claims: "Market Size." "$130 Billion Worldwide." "$1.5 Billion Australia." "184k inner-city properties with unused parking."
Presentation choice: Naming the home market is a useful narrowing step.
When it does not fit: Totals with no definition or source.
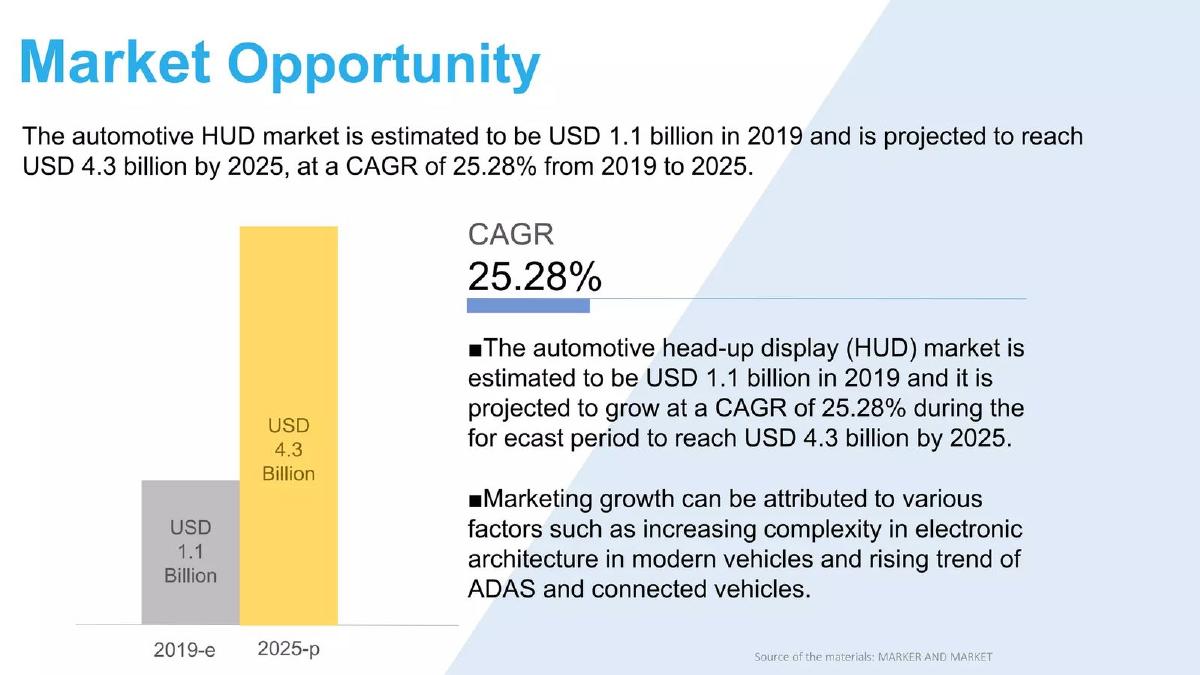
DarTrays deck, slide 5. Exact stored slide matched to this analysis.
Our analysis: Sourced product-segment forecast.
Evidence and limitation: A specific product segment with a sourced forecast. Our check: $1.1B to $4.3B over six years is about 25.5% a year, consistent with the stated rate. It sizes the whole HUD market; the slide doesn't show how many vehicles or which carmakers DarTrays could supply.
What a founder can adapt: "HUD $[X] ([source]); [N] vehicles/year × [fit rate]% × $[unit price] = $[Y]."
Supporting analysis
What the deck claims: "Market Opportunity." "The automotive HUD market is estimated to be USD 1.1 billion in 2019 and is projected to reach USD 4.3 billion by 2025, at a CAGR of 25.28% from 2019 to 2025." "Market growth can be attributed to various factors such as increasing complexity in electronic architecture in modern vehicles and rising trend of ADAS and connected vehicles." Source note: MarketsandMarkets.
Presentation choice: A narrow, named segment is better than the whole car industry.
When it does not fit: Stopping at the segment forecast.
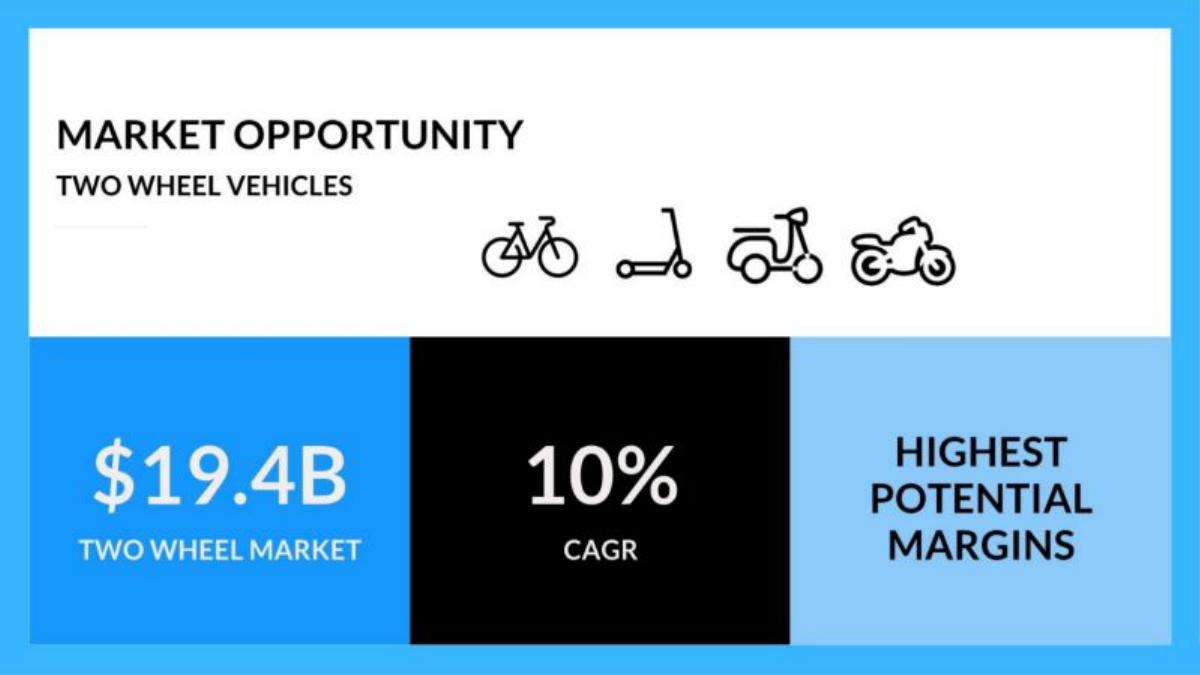
The Smart Tire Company deck, slide 6. Exact stored slide matched to this analysis.
Our analysis: One unsourced headline.
Evidence and limitation: Weaker example. It names the vehicle type but not whether $19.4B is vehicles, tyres or parts, and gives no region, year or source. "Highest potential margins" is not supported on the slide.
What a founder can adapt: "[N] bikes and scooters/year × [tyres] × $[price] = $[X] ([source, year])."
Supporting analysis
What the deck claims: "Market Opportunity: Two Wheel Vehicles." "$19.4B Two Wheel Market." "10% CAGR." "Highest Potential Margins."
Presentation choice: Investors can't tell what the number measures.
When it does not fit: A total that doesn't say what it counts.
Before: "$19.4B Two Wheel Market. 10% CAGR. Highest Potential Margins."
After: "[N] bikes and scooters sold/year in [region] ([source]) × [2] tyres × $[price] = $[X]."
What improved: Our illustrative rewrite of The Smart Tire Company's slide; bracketed text is a placeholder, not company fact.
What's different about mobility market sizing
Vehicle counts, fleet sizes and dealer numbers are public, so investors expect a bottom-up count. The spend side varies: maintenance, parking, software, parts. A useful slide names which spend it captures, per vehicle or per business, and where the first market is.
What investors check
Whether the vehicle or business count is sourced. Whether spend per unit is stated and matches the total. Whether the launch geography is shown. Whether a combined total is broken into the parts the product serves. Whether sources and years are given.
How we read each slide
We quote the text on the slide images and mark our own arithmetic as ours. We have not checked any market figure or source. Page numbers are pages in the original deck file. All six images were already stored and were checked pixel-for-pixel against fresh renders of the decks.
Common mistakes
Unsourced vehicle counts. Registrations are public; cite them.
Mismatched numbers. Use the same count in text and sum.
No launch geography. Show where you start.
Undefined totals. Say what the figure measures.
Diagnostic checklist
Sourced vehicle or business count.
Annual spend per unit.
Launch city or region.
Segments you serve named.
Sources and years cited.
Frequently asked questions
How should a mobility startup size its market?
Count the vehicles or businesses you serve, multiply by annual spend on your category, and show your launch city. MechanicBaba shows cars in India × $225 a year, then the same for Delhi-NCR.
Is a global automotive segment total enough?
Only as context. DarTrays' sourced HUD forecast is specific, but investors still want how many vehicles you could supply.
How we chose these examples
Corpus: published pitch deck teardowns on StartupFundraising.com. Founder-uploaded private decks are excluded.
Selection (2026-09-26): we searched teardown slide text for market-size wording together with automotive, cars, vehicle, fleet, parking, transport, scooter or drivers, kept slides from mobility businesses with stored images, reviewed seven from the deck files and kept six.
Excluded: HearHere p5 (already analysed in the financials guide). Logistics and delivery slides are left for a separate guide. Slides already used in other guides were not reused.
Page numbers are pages in the original deck files. All six images were already stored and were checked pixel-for-pixel against fresh renders on 2026-09-26.
Market figures and sources are quoted from the slides and not independently verified. Calculations (sums, per-unit figures, growth rates) are ours and marked as such.
Review: slide images were checked on 2026-09-26 and matched to company, deck and page (editorial model review). No person has yet completed an editorial review of this page. We make no claim that any slide caused a fundraising outcome.