UXCam’s 2018 seed deck is exceptionally lean, consisting of only 9 slides. It bypasses traditional sections like market size (TAM), detailed financial projections, and a specific 'Ask' slide, choosing instead to focus entirely on the product's utility and the team's pedigree. The narrative is built on a specific pain point: while quantitative tools tell you *what* is happening, they don't tell you *why*. By showcasing their work on the BBC Weather app and claiming a 60% month-over-month growth rate on the final slide, UXCam demonstrated traction without needing complex charts. This deck relie…
Key takeaways
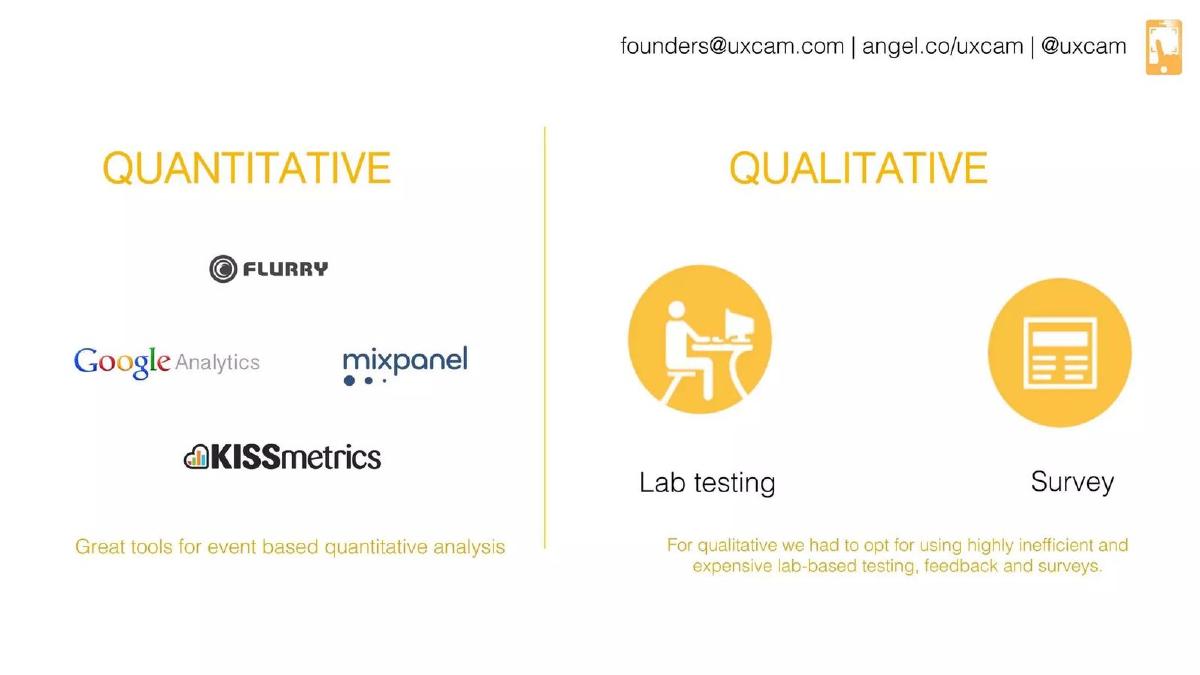
- The deck identifies a clear market gap between quantitative tools like Google Analytics and qualitative methods like lab testing on Slide 3.
- Founders leverage high-profile social proof early, noting they built the BBC weather app on Slide 2.
- The product is positioned as a solution for 'Find and fix usability issues' as stated on Slide 1.
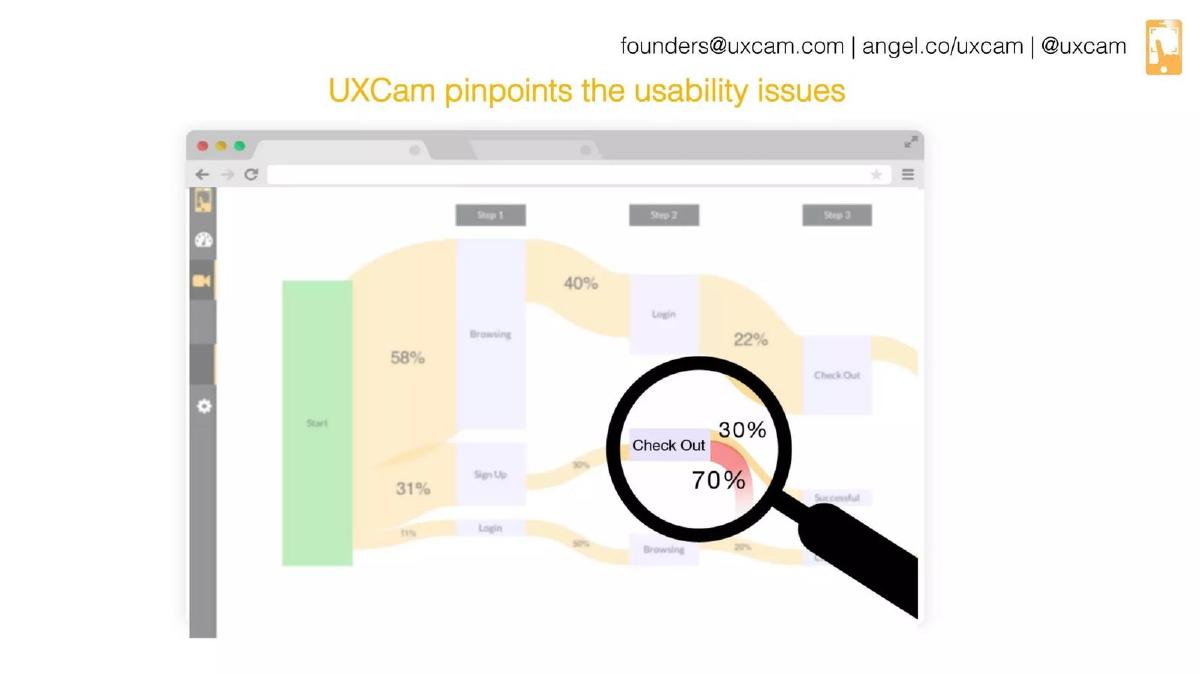
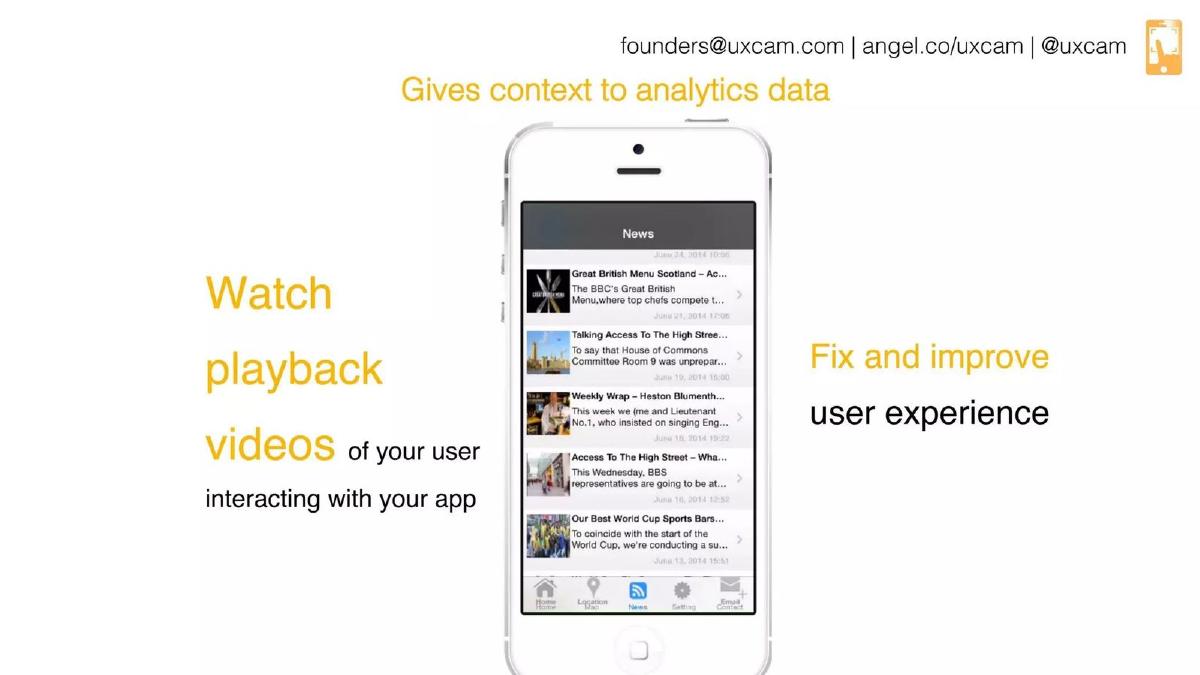
- Visual evidence of the platform is provided through a funnel analysis screenshot on Slide 5 and session playback on Slide 6.
- The team slide (Slide 8) highlights significant exits, noting that Richard 'Founded & IPO’ed a company'.
- Traction is summarized in a single, powerful metric: '60% MoM growth' on Slide 9.
- The deck completely omits a competition matrix, financial roadmap, and a specific funding request.
- Use cases are clearly categorized into Drop-offs, Retention, and Bugs on Slide 7.
The Power of Brevity in Seed Fundraising
The UXCam pitch deck is a fascinating example of minimalist storytelling. In an era where decks often stretch to 20 or 30 slides filled with complex data, UXCam managed to secure a $10.1 million Seed round (according to catalogue data) using just nine slides. The deck operates on a simple premise: the mobile world is drowning in numbers but starving for context. By focusing on the 'Why' behind user behavior, UXCam differentiates itself from the crowded field of quantitative analytics.
Slides 1-2: The Hook and Immediate Credibility
Slide 1: Title Slide The deck opens with a clear value proposition: "Find and fix usability issues." The branding is consistent, featuring a mobile-centric logo and the tagline "Qualitative usability analytics." It establishes the niche immediately—this isn't just another general analytics tool; it is specifically for usability.
Slide 2: The Credibility Shot Before explaining the product, UXCam establishes authority. Slide 2 features a large graphic of the BBC Weather app with an "Editors' Choice" badge. The text simply reads, "We built the BBC weather app." This is a powerful move. It tells investors that the founders aren't just theorists; they are practitioners who have built apps used by millions. This effectively handles the "Why this team?" question before it is even asked.
Slides 3-4: Defining the Market Gap
Slide 3: The Problem with Current Tools This slide splits the world into two halves: Quantitative and Qualitative. On the left, it lists industry giants like Flurry, Google Analytics, Mixpanel, and KISSmetrics, calling them "Great tools for event based quantitative analysis." On the right, it shows the current state of qualitative research: "Lab testing" and "Surveys." The caption notes that these methods are "highly inefficient and expensive."
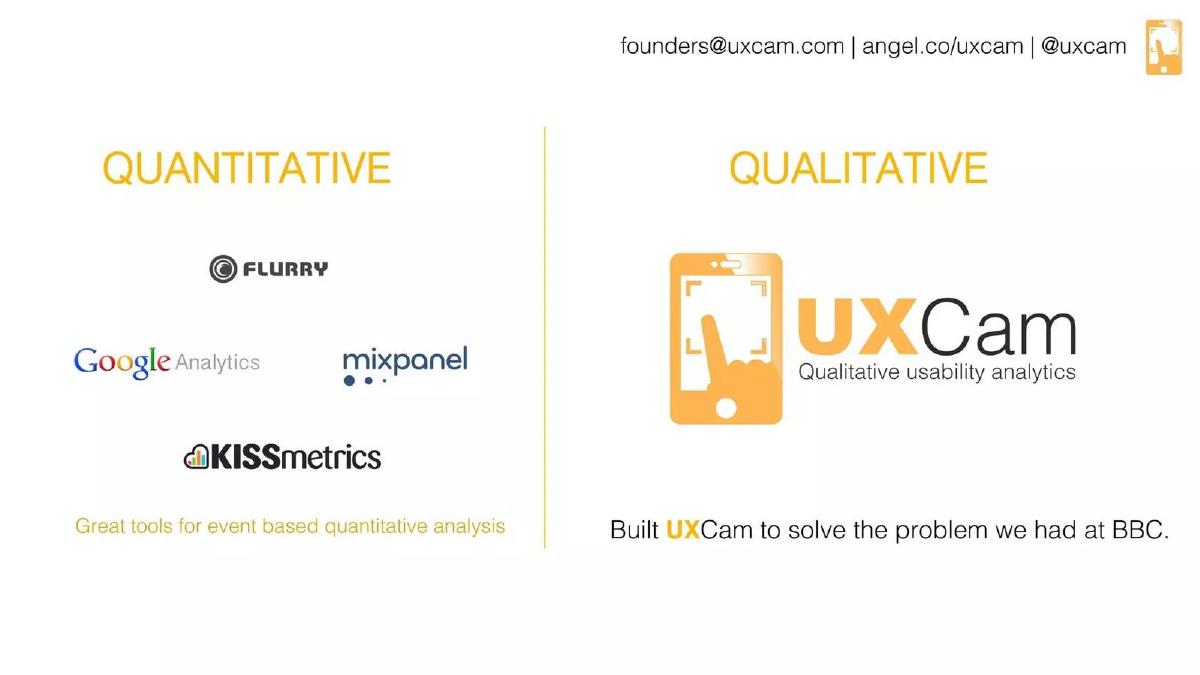
Slide 4: The Solution Slide 4 mirrors Slide 3 but replaces the inefficient lab testing icons with the UXCam logo. The text states, "Built UXCam to solve the problem we had at BBC." This ties the solution back to the credibility established on Slide 2, suggesting the product was born out of real-world necessity at a major enterprise level.
Slides 5-6: Product Demonstration
Slide 5: Pinpointing Issues UXCam moves into the 'How.' Slide 5 shows a browser-based dashboard featuring a Sankey diagram (flow chart). A magnifying glass highlights a specific drop-off point: "Check Out 70%." This visualizes the product's ability to identify exactly where users are leaving a funnel. It moves the conversation from abstract concepts to a concrete interface.
Slide 6: Contextual Analytics Slide 6 explains the unique selling point: "Gives context to analytics data." It shows a mobile device playing back a user session. The text on the left says, "Watch playback videos of your user interacting with your app," while the right side promises to "Fix and improve user experience." This is the core of their qualitative pitch—seeing what the user sees.
Slides 7-9: Use Cases, Team, and Traction
Slide 7: Customer Success Patterns This slide categorizes how current customers use the tool. It identifies three key areas: Drop-offs (Cart abandonment, Onboarding), Retention (Which level of games are too hard), and Bugs (Crash recordings, Bug reporting). This slide is crucial because it demonstrates that the product has multiple entry points into an organization, from Product Managers to QA Engineers.
Slide 8: Meet the Crew The team slide is divided into Business, Design, and Technology. Kishan is listed as a "3x Entrepreneur." Kij is noted for having "Led large scale team 5+ years." The most significant highlight is Richard , who "Founded & IPO’ed a company." The bottom of the slide features logos for UCL, BBC, Sony, Microsoft Ventures, and 500 (Startups), further cementing their institutional and professional pedigree.
Slide 9: The Closer The final slide returns to the title graphic but adds one critical piece of data: "60% MoM growth." In a seed deck, this single metric can be more persuasive than ten slides of financial projections. It indicates that the product has hit a vein of market demand.
What Works in the UXCam Deck
The most successful element of this deck is its reframing of the competition . By praising Mixpanel and Google Analytics rather than attacking them, UXCam positions itself as a complementary "must-have" rather than a risky replacement. This makes the sales hurdle much lower for potential customers and the investment risk lower for VCs.
Additionally, the social proof is integrated perfectly. Mentioning the BBC Weather app on Slide 2 and the team's past IPO on Slide 8 provides a safety net for investors. It suggests that even if the specific product pivots, the team has the competence to build something valuable.
What is Missing from the UXCam Deck
Despite its success, the deck omits several standard components that many investors require:
Market Size (TAM/SAM/SOM): There is no mention of how large the mobile analytics market is or how much of it UXCam intends to capture. · Business Model: The deck does not explain how they charge (SaaS tiers, per session, per user?). · The Ask: There is no slide detailing how much money they are raising or what the milestones for the next 18 months will be. · Competition Matrix: While they mention quantitative tools, they ignore direct qualitative competitors like Appsee or SeeSaw (active at the time).
What a Founder Should Copy
Founders should emulate the visual simplicity of this deck. Each slide has one job and one primary message. The use of a consistent color palette (yellow/grey) makes the deck feel professional and cohesive despite its short length.
More importantly, founders should copy the 'Problem-Solution-Proof' flow. UXCam identifies the problem (Slide 3), offers the solution (Slide 4), shows the solution in action (Slides 5-6), and then provides the proof of growth (Slide 9). If your traction is as strong as 60% MoM, you don't need a 20-slide deck to convince an investor to take a meeting.
Final Analysis
UXCam’s deck is a "teaser" style presentation designed to generate a meeting, not to serve as a comprehensive due diligence document. It relies on the strength of the team's history and a single, explosive growth metric. For founders with a strong pedigree and early signs of exponential growth, this minimalist approach is often more effective than an over-explained, data-heavy presentation.
Frequently asked questions
- Why is the UXCam deck so short at only 9 slides?
- UXCam focuses on a high-signal-to-noise ratio. At the Seed stage, investors are primarily looking for a clear problem, a functional product, and a capable team. By stripping away fluff like generic market growth charts, UXCam forces the investor to focus on their unique qualitative approach and their impressive 60% month-over-month growth rate.
- How does UXCam handle the 'Competition' slide?
- Instead of a standard 2x2 grid, Slide 3 and 4 reframe the competition. They acknowledge 'great tools' like Mixpanel and Flurry for quantitative data but argue these tools are incomplete. They position UXCam not as a replacement for these giants, but as the necessary qualitative layer that replaces 'inefficient and expensive' lab testing.
- What is the significance of the BBC Weather app mention?
- Slide 2 serves as an immediate credibility booster. By stating 'We built the BBC weather app,' the founders prove they understand the complexities of high-scale mobile development. This reduces the perceived technical risk for investors, showing the team has already delivered world-class products before launching this analytics platform.
- Is the lack of a 'Fundraising Ask' a mistake?
- In a deck used for a first meeting or a teaser, omitting the 'Ask' can be intentional. It allows the founders to tailor the valuation and amount based on the specific investor's appetite. However, for a final pitch, this would typically be included. The catalogue listing confirms they eventually raised $10.1M.
- How does the deck demonstrate product-market fit?
- Slide 7 ('Customers are using us to solve') is the core of their PMF argument. It lists specific, high-value problems: cart abandonment, onboarding drop-offs, and game difficulty levels. Combined with the 60% MoM growth on Slide 9, it suggests that the market is actively pulling the product from the startup.