uThukela GreenEnergyPark’s deck is a technical and financial proposal for a bio-refinery located in the uThukela district of South Africa. The project aims to convert agricultural waste—specifically corn cobs—into furfural, an industrial chemical used in agchem, pharmaceuticals, and fragrances. The deck outlines a clear industrial process: 10kg of cobs produce 1kg of furfural. Financially, the project seeks R90 million to build a plant with a projected EBIT of R36 million per annum and an IRR of 26%. While the deck excels at defining the unit economics of the raw material and the specific geo…
Key takeaways
- The project focuses on producing Furfural, an industrial chemical with a global market of 400,000 tons per annum (Slide 2).
- The conversion ratio is explicitly stated as 10 kg of 5-carbon sugar (cobs) per 1 kg of Furfural (Slide 2).
- Total investment required is R90 million, with a projected payback period of less than 4 years (Slide 4).
- The project estimates creating 15,000 jobs in cob supply, 40 in collection, and 33 in conversion (Slide 3).
- The financial model projects a 26% after-tax IRR, excluding potential carbon credit revenue (Slide 4).
- The site is located in the uThukela district, spanning 11,500km2 with rail accessibility (Slide 5).
- The founders claim a background in the sector since 2001, including a successful VC exit in 2007 (Slide 11).
- The timeline to commissioning is 30 months, with 20 months required to reach construction start (Slide 4).
Slide-by-Slide Analysis
Slide 1: Title Slide
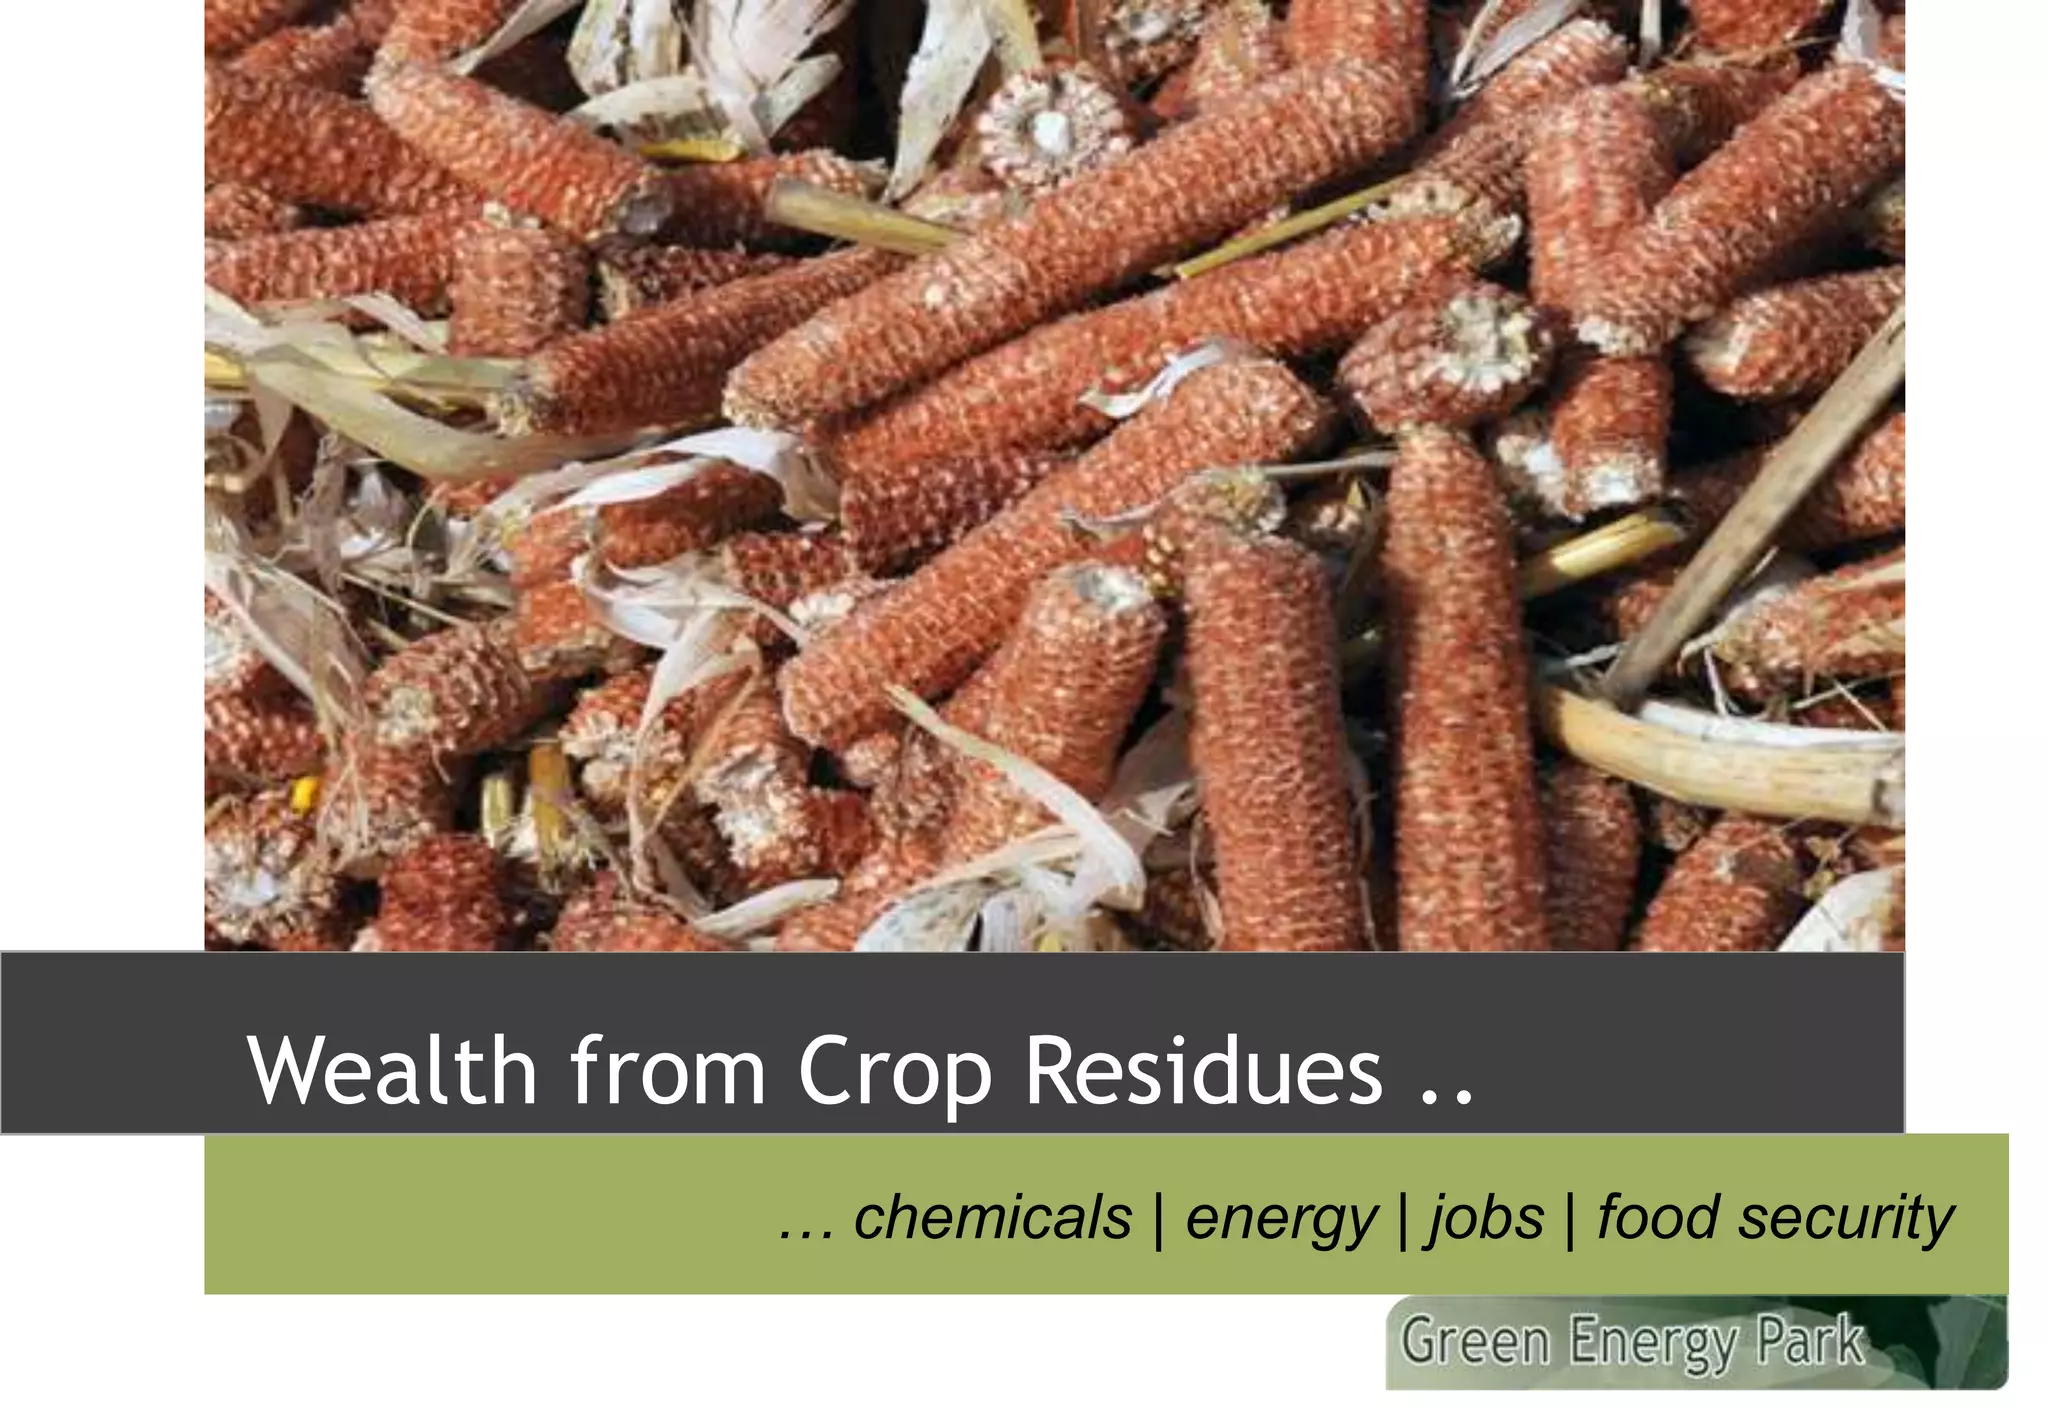
The deck opens with a high-resolution image of corn cobs, immediately identifying the raw material source. The tagline 'Wealth from Crop Residues' is supported by four pillars: chemicals, energy, jobs, and food security. The branding 'Green Energy Park' is visible in the bottom right. This is a functional, if uninspired, opening that clearly communicates the sector (AgTech/CleanTech) and the value proposition (waste-to-wealth).
Slide 2: Bio-renewable Chemicals: Furfural
This slide serves as the product and market definition. It identifies Furfural as the primary output, noting it is an industrial chemical with a 400,000 tpa (tons per annum) market. The slide includes chemical diagrams for 5-Carbon Sugar and Furfural, establishing technical credibility. Crucially, it provides the conversion metric: 10 kg of raw material per 1 kg of Furfural. It also lists end-use cases, including Agchem, Pharmaceutical, and Cosmetics. This slide is effective because it moves from the raw 'waste' shown on Slide 1 to a specific, marketable industrial commodity.
Slide 3: Investment | R/t Cob Cost | # Jobs
This is a supply chain and unit economics slide. It uses a three-stage vertical flow: Cobs, Collection, and Conversion. For each stage, it lists the investment required, the cost per ton, and the number of jobs created. Key figures include: R25 million for collection, R65 million for conversion, and a delivered cob cost of R310/t. The slide also notes the scale of the operation at the bottom: 400,000 tpa of maize leading to 50,000 tpa of cobs, resulting in 5,000 tpa of Furfural. The job creation figures (15,000 in supply, 40 in collection, 33 in conversion) suggest a strong social impact narrative, likely aimed at government or development finance institutions.
Slide 4: Headlines - GreenEnergyPark
This is the executive summary of the financials. It states a total investment of R90 million for the Furfural plant and residue sales. The projected EBIT is R36 million per annum, with a payback period of under 4 years and an IRR of 26%. A chart shows cumulative net cash flow after tax reaching approximately R2,750 million by Year 10. The slide also notes a 30-month timeline to commissioning. By explicitly excluding carbon credits from these calculations, the founders are signaling that the project is economically viable on its own merits, with 'green' incentives acting as a potential bonus.
Slide 5: uThukela GreenEnergyPark & New Crop/Food
This slide focuses on geography and infrastructure. It identifies the uThukela district in South Africa, highlighting its 11,500km2 area and rail accessibility. A map shows the Ingonyama Trust Board Land and various district municipalities. The slide makes a bold claim: an R130 million investment will create a projected R350 million per annum business. Note the discrepancy between the R90 million mentioned on Slide 4 and the R130 million mentioned here; this may imply a larger phase or additional infrastructure costs not captured in the plant-specific slide.
Slide 11: Our Background (Since 2001)
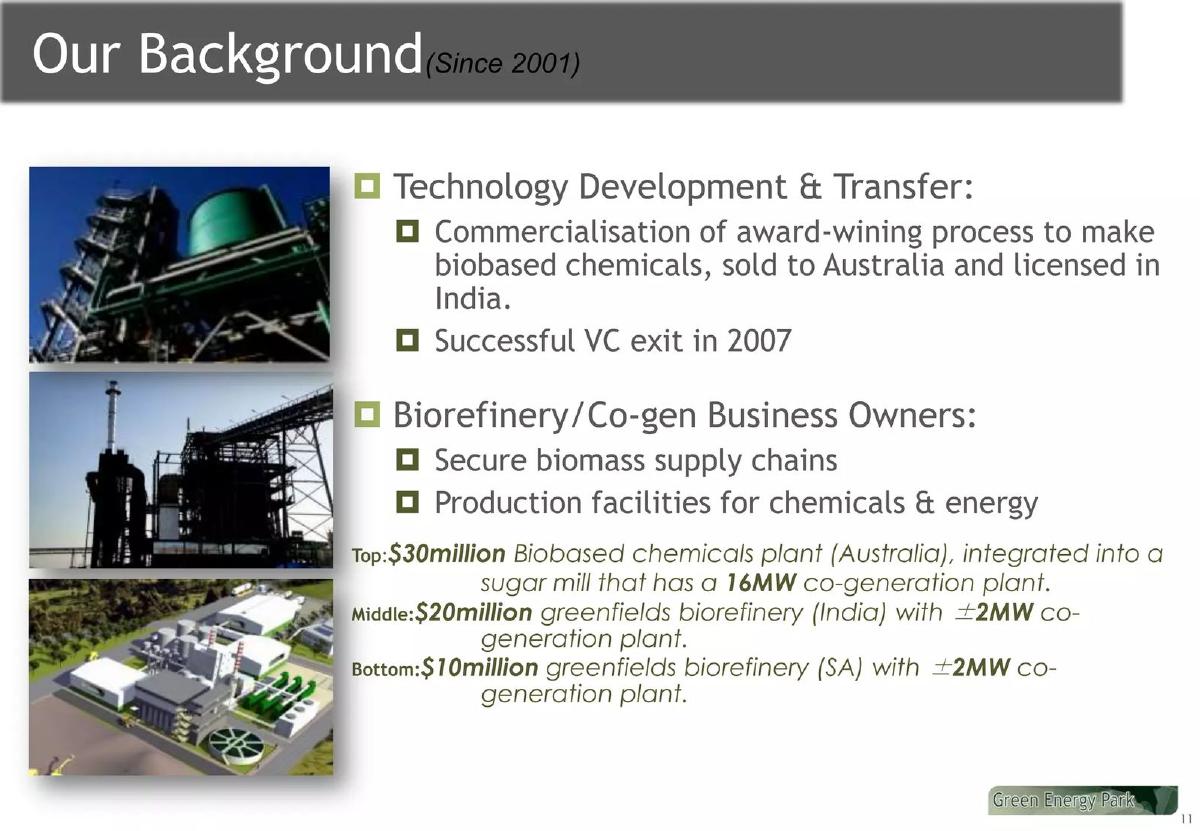
This slide establishes the 'Why Us' by detailing previous projects. It mentions a $30 million biobased chemicals plant in Australia (16MW co-gen), a $20 million biorefinery in India (2MW co-gen), and a $10 million biorefinery in South Africa (2MW co-gen). It also claims a successful VC exit in 2007. This is a strong slide because it demonstrates that the team is not proposing a first-of-its-kind experiment but rather a replication of a model they have executed globally.
Slide 13: The Blueprints Are Ready
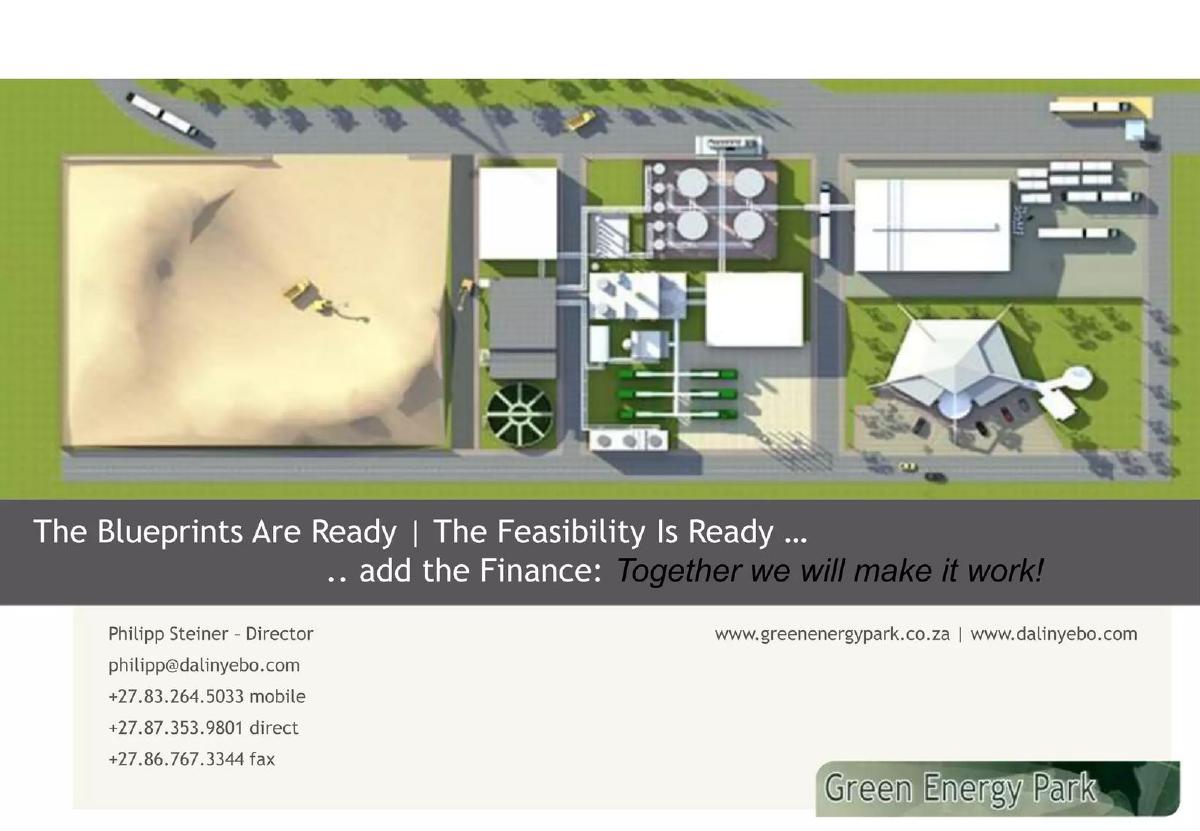
The final slide is a call to action. It features an architectural rendering of the plant layout and states that blueprints and feasibility studies are complete. It provides contact information for Philipp Steiner, Director. The phrase 'add the Finance: Together we will make it work!' frames the project as 'shovel-ready,' reducing the perceived risk of pre-development delays.
What uThukela GreenEnergyPark Does Well
The deck is exceptionally clear on unit economics. By providing the 10:1 conversion ratio and the specific Rand-per-ton costs for collection and conversion, the founders allow a sophisticated investor to stress-test their assumptions immediately. The focus on a specific chemical (Furfural) rather than a vague 'green energy' promise gives the project a concrete market to target. The inclusion of past project values ($10M-$30M) provides a sense of scale and competence that offsets the lack of individual CVs.
What is Missing from the Deck
The most glaring omission is a dedicated Team Slide. While Slide 11 mentions 'Our Background,' it does not name the key personnel (other than the Director on the final slide) or their specific roles. There is also no detailed Market Analysis; while the 400,000 tpa figure is given, there is no mention of current competitors, Furfural price volatility, or off-take agreements. The deck also lacks a clear 'Use of Funds' breakdown. While R90 million is the total, investors would want to see how much is allocated to land, equipment, working capital, and contingency. Finally, the discrepancy between the R90 million and R130 million investment figures across different slides creates unnecessary confusion.
What a Founder Should Copy
Founders in the industrial or infrastructure space should emulate the 'Headlines' slide (Slide 4). It presents the four most important metrics—Investment, EBIT, Payback, and IRR—in a single, easy-to-read list. The 'Background' slide (Slide 11) is also a masterclass in showing rather than telling; by listing the dollar value and megawatt capacity of previous projects, the team proves their ability to handle large-scale capital projects. Finally, the use of a specific conversion ratio (Slide 2) is a great way to ground a complex technical process in simple business logic.
Final Assessment
The uThukela GreenEnergyPark deck is a solid project finance proposal that prioritizes technical and regional feasibility over flashy design. It successfully argues that the project is a low-risk replication of a proven model in a location with a surplus of raw materials. To move to a formal due diligence phase, the founders would need to reconcile their investment figures, provide a detailed team roster, and show evidence of off-take interest from the industries listed on Slide 2.
Frequently asked questions
- What is the primary product of uThukela GreenEnergyPark?
- The primary product is Furfural, a bio-renewable industrial chemical derived from 5-carbon sugars found in crop residues like corn cobs. According to Slide 2, it is used in agriculture, pharmaceuticals, elastomers, fragrances, and cosmetics. The deck notes a global industrial chemical market of 400,000 tons per annum for this specific substance.
- What are the core financial projections for the project?
- Slide 4 outlines the 'Headlines' for the project: an R90 million investment is expected to generate an EBIT of R36 million per year. The projected Internal Rate of Return (IRR) is 26% after tax, with a payback period of less than four years. These figures notably exclude any additional revenue that might be generated from carbon credits.
- How does the company source its raw materials?
- The company sources corn cobs from the uThukela region. Slide 3 breaks down the supply chain costs: the cobs themselves are listed at $0 (residue), collection costs are approximately R310 per ton delivered, and conversion costs are R210 per ton. The project assumes a supply from 40,000 hectares producing 50,000 tons of cobs annually.
- What is the track record of the management team?
- While there isn't a traditional team slide with bios, Slide 11 ('Our Background') highlights experience since 2001. This includes the commercialization of biobased chemical processes sold to Australia and India, and a successful VC exit in 2007. They cite involvement in plants ranging from $10 million to $30 million in value across Australia, India, and South Africa.
- What is the timeline for the investment to become operational?
- According to Slide 4, the project requires 20 months to reach the start of construction, a period that includes the Environmental Impact Assessment (EIA). Total time to commissioning is estimated at 30 months from the point of investment. Slide 13 indicates that blueprints and feasibility studies are already complete.