DRIVE presents a classic marketplace play focused on the Philippine car rental and tourism sector. The deck, dated June 2019, highlights a peer-to-peer model that connects car owners, drivers, and renters through a three-app ecosystem. With a 25% commission per booking and an average booking price of PHP 4,000, the company demonstrates early traction, growing from approximately PHP 80,000 in January revenue to nearly PHP 140,000 by May 2019. The fundraising ask is unconventional, structured as a loan with a convertible note option, seeking between $2,000 and $2M. While the deck provides granu…
Key takeaways
- The business model relies on a 25% commission for every booking made through the peer-to-peer platform (Slide 5).
- DRIVE utilizes a three-app ecosystem: one for renters, one for drivers, and a fleet manager for car owners (Slide 4).
- The company identifies a $83M market opportunity in the Philippine car rental industry with a 10% CAGR (Slide 9).
- Revenue grew from PHP 80,752 in January 2019 to PHP 139,722 in May 2019 (Slide 12).
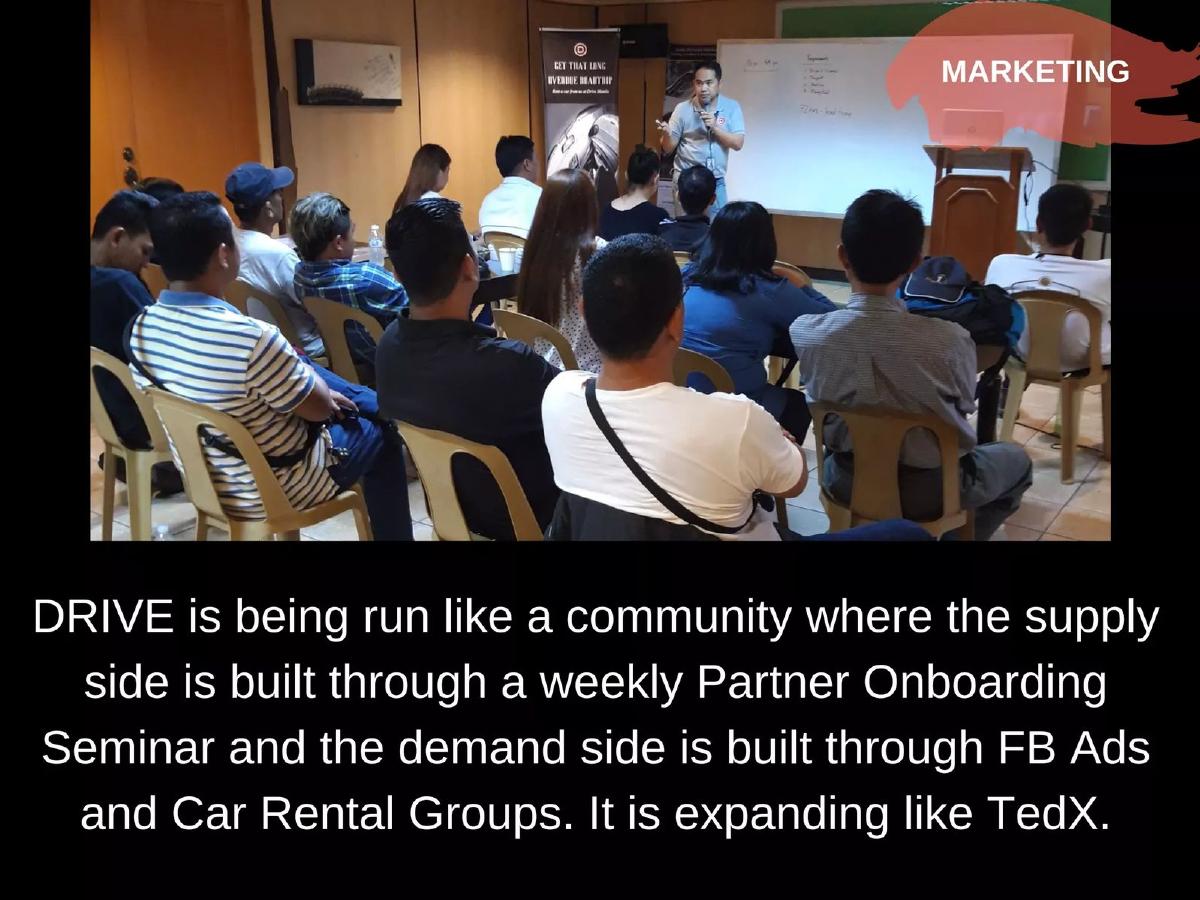
- The supply side is built through weekly 'Partner Onboarding Seminars' held in co-working spaces (Slide 6, Slide 10).
- The team is led by Mike Miranda, who has professional experience at Dell, Google, and Microsoft (Slide 8).
- The fundraising ask is structured as a 5-year loan at 6% p.a. interest, convertible at 1% equity per $20,000 (Slide 17).
- The deck provides a specific cap table showing a current valuation of $80,000 based on $40,000 initial capital and $40,000 additional injection (Slide 11).
Introduction and Company Overview
The DRIVE pitch deck, dated June 2019, introduces a mobile-first marketplace for car rentals and tours in the Philippines. Developed by Drive Manila Transport Services Corp., the company positions itself as a solution to the fragmented and limited availability of vehicles for travelers. The opening slides emphasize accessibility, featuring both App Store and Google Play badges, and provide direct contact information for the founder, Mike Miranda.
Slide 1: Title Slide
The title slide establishes the brand identity with the tagline "Making Travel Easy." It identifies the parent company as Drive Manila Transport Services Corp. and lists Mike Miranda as the President and Founder. A "Netizen's Choice Awarded" badge is displayed, though the specific source or year of the award is not cited on this slide.
Slide 2: The Opportunity
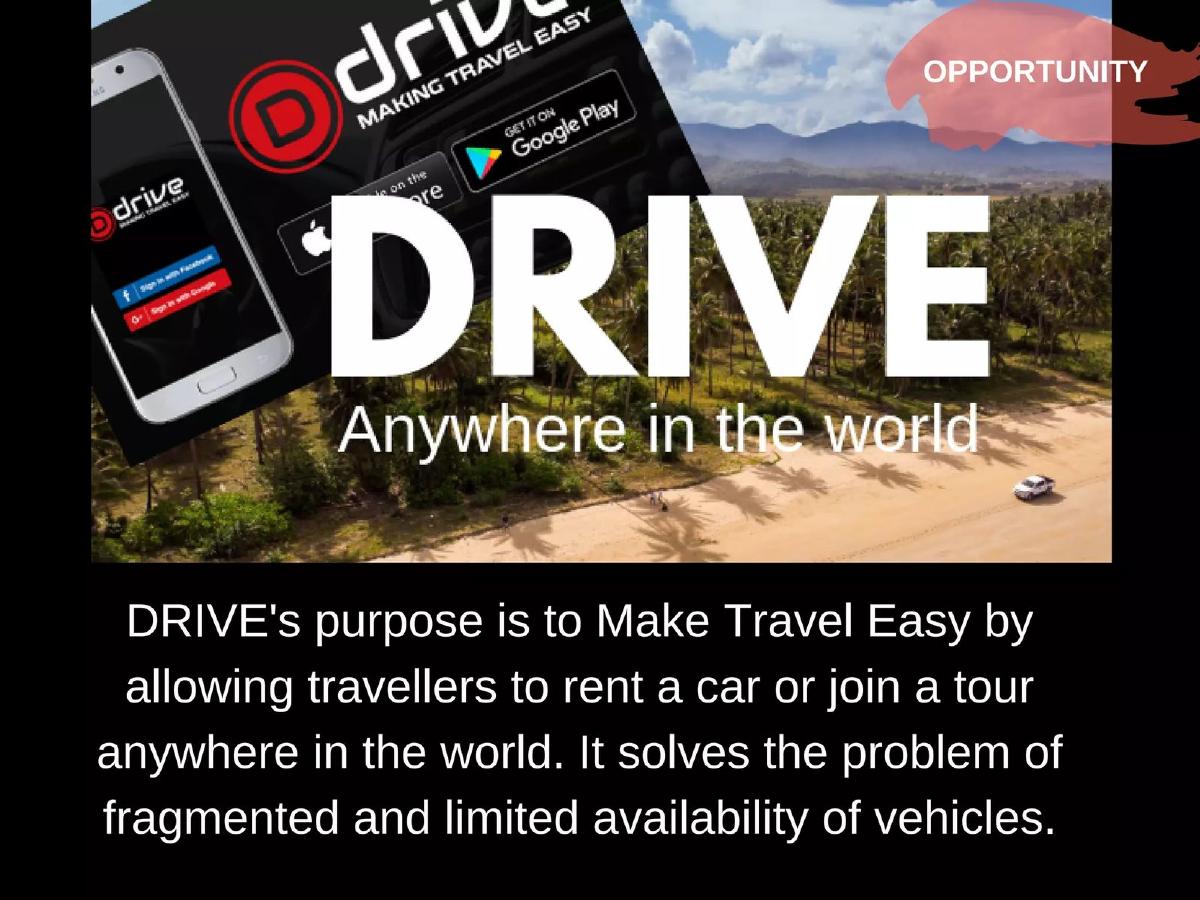
DRIVE defines its purpose as allowing travelers to rent a car or join a tour "anywhere in the world." The core problem identified is the fragmented nature of vehicle availability. While the slide claims a global ambition, the subsequent slides clarify that the immediate focus is the Philippine market.
Slide 3: The Solution
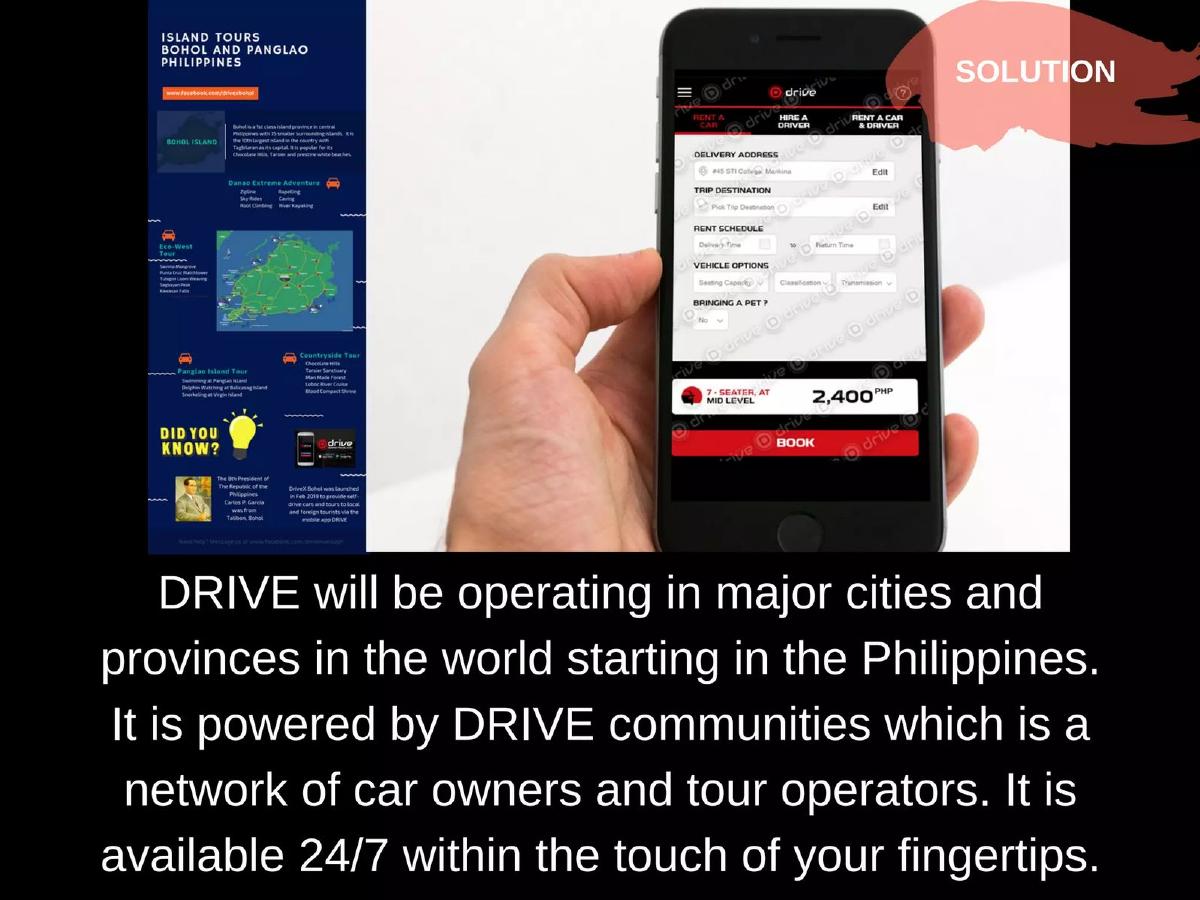
The solution is a mobile platform powered by "DRIVE communities," which is a network of car owners and tour operators. The slide shows a mobile interface where users can select between "Rent a Car," "Hire a Driver," or "Rent a Car & Driver." It also highlights specific tour offerings in Bohol and Panglao, Philippines, indicating a localized service model. A sample booking price of PHP 2,400 for a 7-seater mid-level vehicle is shown.
Slide 4: The "Magic Sauce"
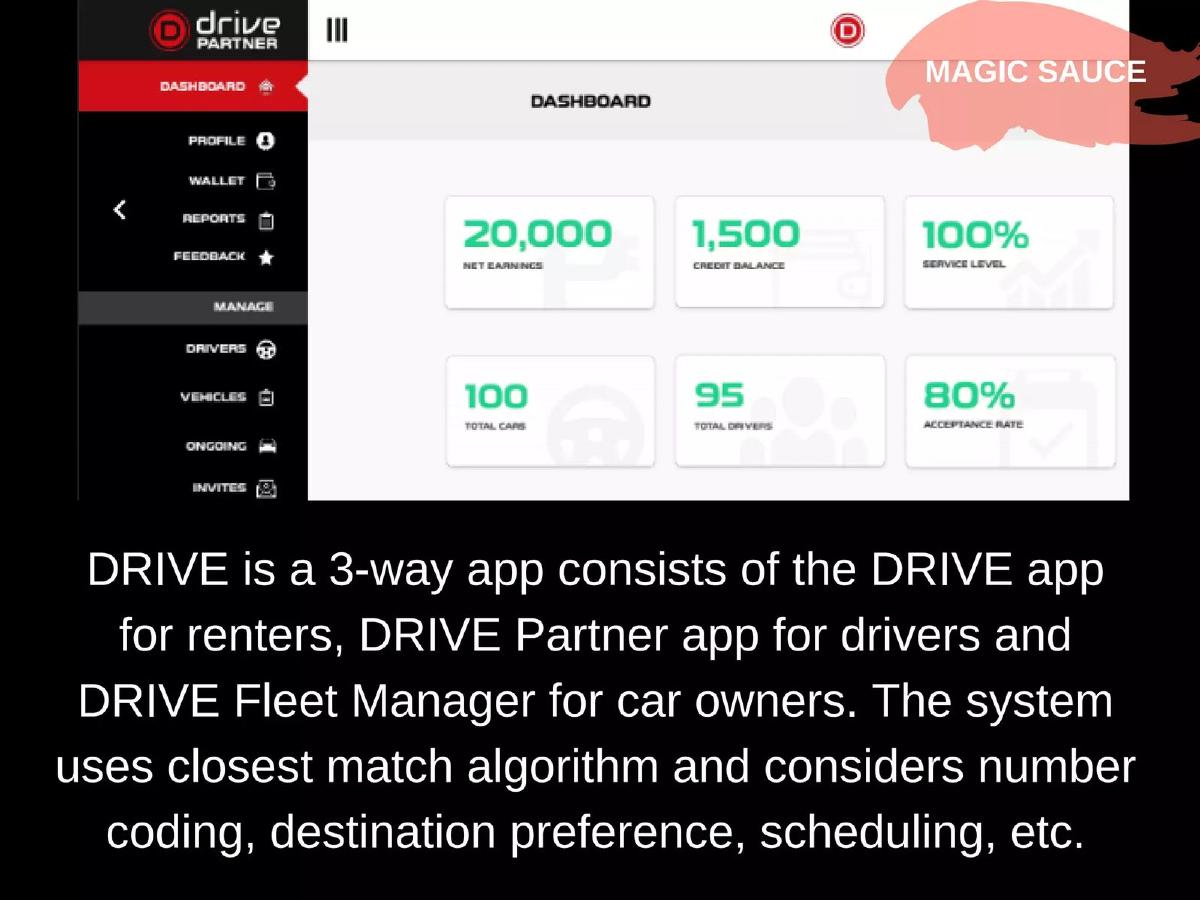
This slide explains the technical structure of the platform. DRIVE is a "3-way app" consisting of a renter app, a partner app for drivers, and a fleet manager app for owners. The matching algorithm considers factors like "number coding" (a specific traffic management system in the Philippines), destination preferences, and scheduling. The dashboard screenshot shows metrics such as 20,000 net earnings, 100 total cars, and an 80% acceptance rate.
Business Model and Market Strategy
DRIVE utilizes a standard marketplace commission structure but employs a unique community-based approach to acquire supply.
Slide 5: Business Model
The model is straightforward: a 25% commission is taken from every booking. The slide describes the service as a "Peer to peer car rental and tours app." No other revenue streams, such as advertising or premium listings, are mentioned here.
Slide 6: Marketing and Supply Acquisition
Supply is built through a "weekly Partner Onboarding Seminar." The slide includes a photo of a classroom-style training session. Demand is generated through Facebook Ads and Car Rental Groups. The founders compare their expansion model to "TedX," suggesting a decentralized or franchise-like growth strategy for local communities.
Slide 7: Competitive Advantage
Rather than comparing fleet size or pricing, DRIVE compares its social media performance against incumbents like Hertz Philippines, National Car Rental PH, Budget, and AVIS. The slide includes a screenshot of "Pages to Watch," showing DRIVE (Drive Manila) with 3.6K likes and 1.7K weekly engagements, which is significantly higher engagement than the larger brands listed.
Team and Financial Performance
The deck provides a look at the founding team and the early financial trajectory of the business during the first half of 2019.
Slide 8: The Team
The leadership team consists of three members of the Miranda family: Mike Miranda (President and Founder), who is credited with experience at Dell, Google, and Microsoft. Grace Miranda (CEO and Co-founder). Mayee Miranda (CHRO and Treasurer).The slide does not provide specific roles or backgrounds for Grace or Mayee Miranda beyond their titles.
Slide 9: Financials and Market Size
The Philippine car rental industry is valued at $83M with a 10% CAGR. The slide notes an average price per booking of PHP 4,000. A bar chart shows "2019 DRIVE Earnings" (gross) growing from approximately PHP 80,000 in January to over PHP 200,000 in May. Note: There is a slight discrepancy between the chart on Slide 9 and the detailed table on Slide 12.
Slide 10: Milestones
Key milestones include the app launch on major stores, establishing local leadership in Manila, Bohol, Cavite, Rizal, and Bataan, and the successful implementation of onboarding seminars in co-working spaces.
Slide 11: Cap Table
The company discloses its valuation and share structure. DRIVE incorporated with $40,000 initial capital (20,000 shares at $4 per share). An additional $40,000 was injected, bringing the total valuation to $80,000. The table shows 100% of the 20,000 shares are currently accounted for, with no new equity raised at the time the slide was created.
Detailed Growth Metrics
Slides 12 through 16 provide granular data on the company's performance from January to June 2019.
Slide 12: Financial Model (Projections vs. Actuals)
This slide contains a detailed table of historical data and projections. January 2019: Revenue of PHP 80,752 against OpEx of PHP 144,064 (EBITDA: -PHP 63,312). May 2019: Revenue of PHP 139,722 against OpEx of PHP 188,292 (EBITDA: -PHP 48,570).The projections suggest the company expected to reach EBITDA positivity by October 2019 (PHP 2,634).
Slide 13: Social Media Growth
A bar chart tracks Facebook followers, showing a steady climb from under 1,000 in early 2019 to nearly 5,000 by mid-year. A 3-month simple moving average (3SMA) is included to show the trend line.
Slide 14: Revenue Growth
This chart visualizes the gross sales revenue in PHP. It shows a dip in February (approx. PHP 63,000) followed by consistent growth through May (approx. PHP 140,000).
Slide 15: User Count Growth
User count grew from approximately 250 in January to 1,750 in June 2019. The growth appears linear rather than exponential during this six-month window.
Slide 16: Partners Growth
The supply side (Partners) shows a significant jump between April and May, rising from roughly 450 partners to over 1,000. By June, the partner count reached 1,250.
The Investment Ask
Slide 17: Invest With Us
The final slide outlines the terms for the Seed Round. The target amount is broad, ranging from USD 2,000 to USD 2,000,000. The investment is structured as a loan at 6% per annum interest, payable in 5 years. It includes a convertible note option where 1% equity is offered for every USD 20,000 invested (the slide text says "USD 200,00" which, given the context of the $80k valuation on slide 11, likely means $20,000.00). The slide is dated March 2019, despite the deck containing data through June 2019.
What Works / What is Missing
What Works: The deck provides excellent transparency regarding early-stage metrics. Including a full cap table and a detailed month-by-month breakdown of revenue, OpEx, and EBITDA is rare and helpful for investors to understand the burn rate. The focus on the "Partner Onboarding Seminars" shows a clear, repeatable strategy for solving the supply-side problem inherent in marketplaces.
What is Missing: The deck lacks a traditional competitive analysis. Comparing social media likes to global giants like Hertz does not address the actual market share or service differentiation. There is no mention of insurance or regulatory compliance, which are critical hurdles for peer-to-peer car rental services. Furthermore, the "Ask" slide is confusing; a range of $2k to $2M is too wide to suggest a focused use-of-funds plan, and the loan structure is unconventional for a high-growth tech startup.
Founder Takeaways
Be specific with your ask: A fundraising range that spans three orders of magnitude ($2k to $2M) suggests the founders don't know exactly what they need to reach the next milestone. Founders should define a specific target based on a 12-18 month runway.
Show, don't just tell, the tech: Slide 4 does a good job of explaining the three-app ecosystem. For marketplace startups, demonstrating how you manage the different stakeholders (renters, drivers, and owners) is vital.
Use relevant competitive metrics: While social media engagement is a nice-to-have, investors in the transport sector care more about fleet size, geographic coverage, and customer acquisition cost (CAC) vs. lifetime value (LTV). Replacing the Facebook chart with a unit economics slide would strengthen the pitch.
Frequently asked questions
- What is the core product of DRIVE?
- DRIVE is a mobile application ecosystem designed for car rentals and tours. It consists of three distinct interfaces: the main DRIVE app for renters, a Partner app for drivers, and a Fleet Manager app for car owners. The system uses a matching algorithm that accounts for scheduling, destination preferences, and local vehicle number coding regulations in the Philippines.
- How does DRIVE generate revenue?
- The company operates on a marketplace commission model. According to slide 5, DRIVE takes a 25% commission on every booking facilitated through the platform. Their financials on slide 9 indicate an average price per booking of PHP 4,000, suggesting a net revenue of PHP 1,000 per transaction for the company.
- What is the company's current scale and growth rate?
- As of mid-2019, the company was in an early growth phase. Monthly revenue increased by approximately 73% between January and May 2019. User counts grew from roughly 250 in January to over 1,750 by June, while the partner (supply) count grew from 250 to 1,250 in the same period.
- Who are the primary competitors mentioned in the deck?
- DRIVE identifies traditional car rental agencies as its primary competition in the Philippines, specifically naming Hertz, National, Budget, and AVIS. Interestingly, the deck uses Facebook engagement and 'Page Likes' as the primary metric for competitive advantage, showing DRIVE having higher weekly engagement than its larger corporate rivals.
- What are the terms of the investment round?
- The investment ask is highly unusual for a tech startup. They are seeking a 'Seed Round' between $2,000 and $2,000,000. The terms are offered as a loan with 6% annual interest payable over 5 years. This loan includes a convertible note option where $20,000 of investment equals 1% equity in the company.