The DOZ pitch deck is an anomaly in the world of fundraising due to its extreme brevity and total lack of traditional explanatory text. Spanning just 8 slides, the deck relies entirely on visual storytelling to explain a complex two-sided marketplace for marketing tasks. By leading with a strong traction curve showing $1.3M in bookings and using a single persona ('Sarah') to illustrate customer value, DOZ bypasses the need for a problem/solution narrative. While it lacks a team slide, a formal 'ask,' and a business model breakdown, the deck successfully communicates a high-growth trajectory a…
Key takeaways
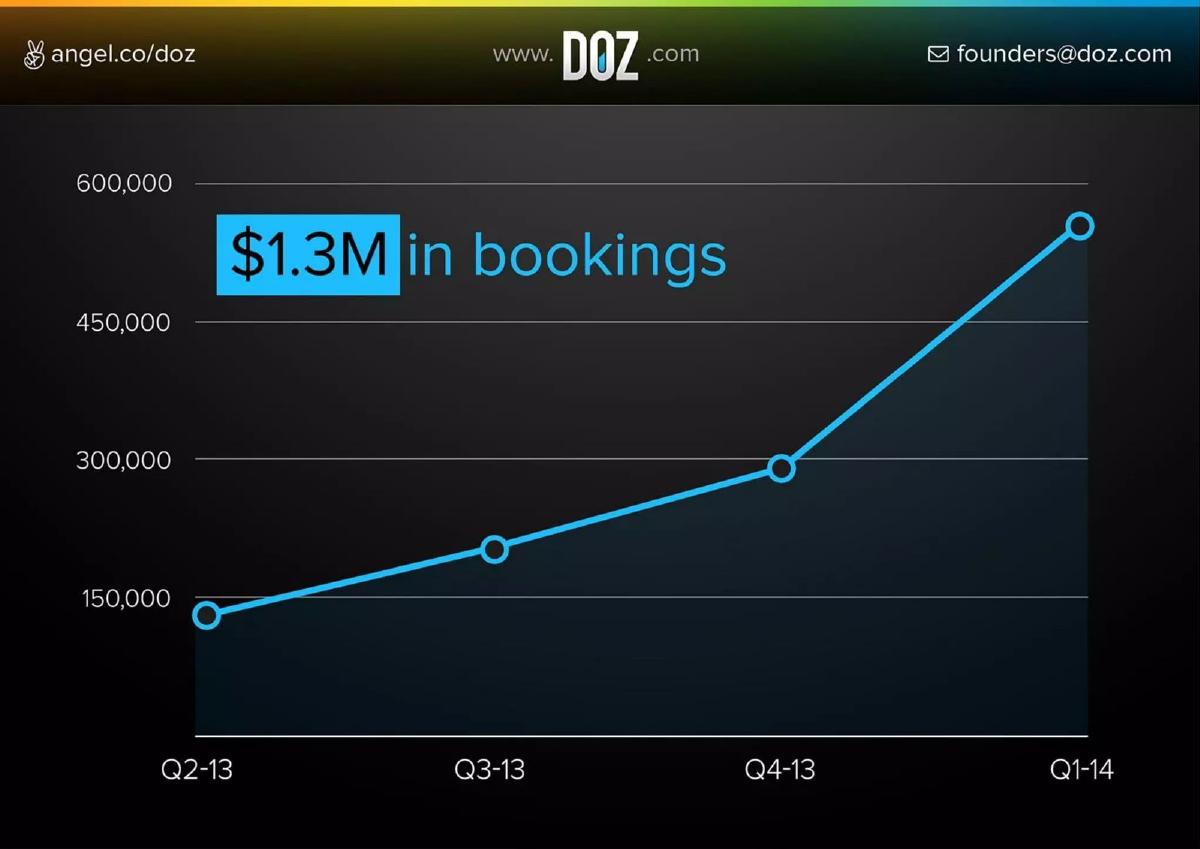
- The deck leads with a high-impact traction slide showing growth from approximately $130,000 to over $550,000 in quarterly bookings between Q2-13 and Q1-14 (Slide 2).
- Total bookings are explicitly stated as $1.3M on Slide 2, providing immediate validation of product-market fit.
- A single customer persona, 'Sarah,' is used to anchor the value proposition, showing a specific spend of $40,000 (Slide 3).
- The product workflow is simplified into a three-step process: Analysis, Tasks, and Matching (Slide 7).
- Market size is visualized as a $30B digital marketing opportunity, with arrows indicating global expansion into Europe, LatAm, and Asia (Slide 8).
- The deck contains zero bullet points, relying instead on full-bleed imagery and large-format numbers to keep the viewer focused.
- Critical fundraising elements are missing, including a team slide, a competitive analysis, and a specific funding request.
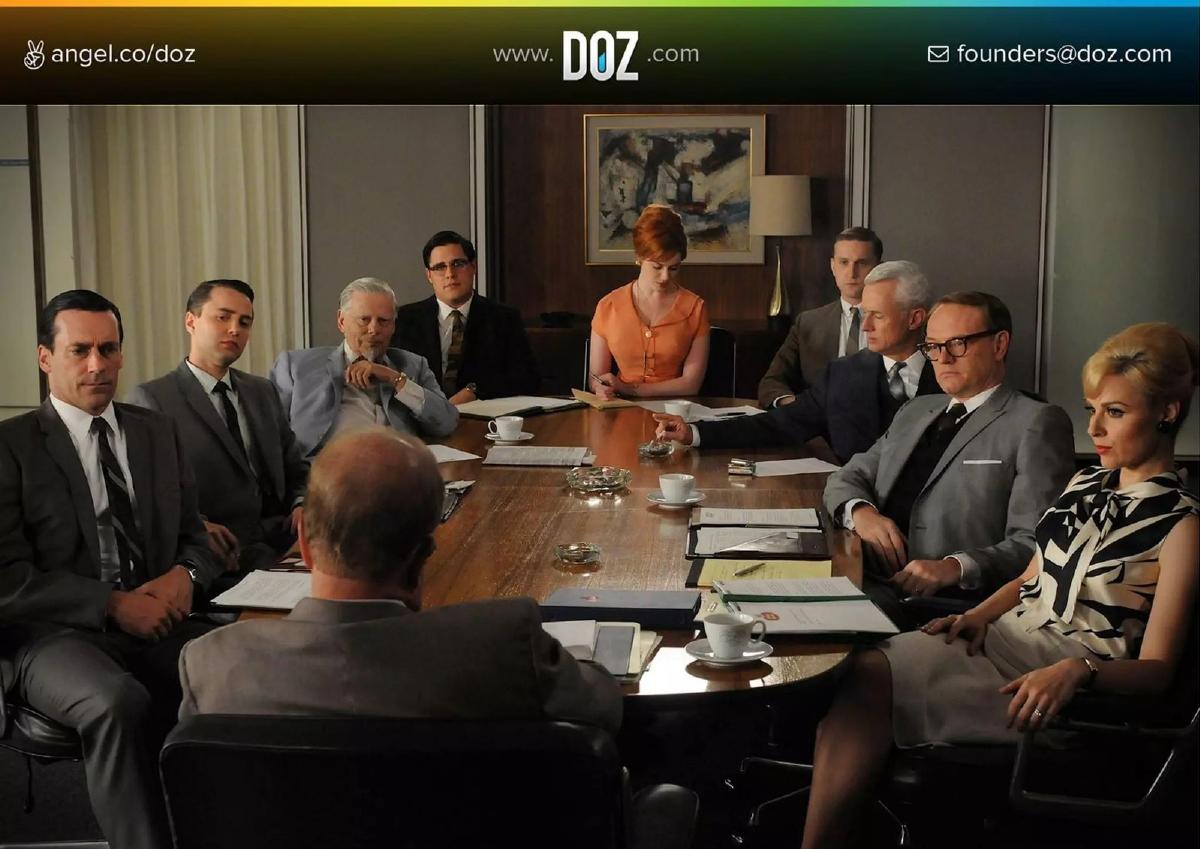
- The use of a Mad Men-era boardroom image (Slide 4) serves as a visual metaphor for the 'old way' of marketing agencies without needing a text-heavy 'Problem' slide.
The Power of Minimalist Fundraising
The DOZ pitch deck, used to raise $1.5M in 2009, is a radical departure from the standard 15-20 slide template. It contains no mission statement, no competitive matrix, and no financial projections. Instead, it functions as a visual narrative of momentum. At only 8 slides, it is designed to be consumed in under a minute, focusing entirely on growth and product interface. For a Seed stage company, this approach works only if the traction is undeniable—which, at $1.3M in bookings, it was.
The Hook: Immediate Traction
Slide 1: Title Slide The deck opens with a clean, dark-themed title slide featuring the DOZ logo and the tagline 'MARKETING TEAM ANYWHERE.' The inclusion of an AngelList link (angel.co/doz) and a direct founder email in the header of every slide suggests this was a deck intended for digital distribution and quick follow-ups.
Slide 2: The Traction Curve DOZ skips the 'Problem' slide entirely and goes straight to the 'Why You Should Care' slide. The graph shows a clear quarterly progression of bookings from Q2-2013 to Q1-2014. The Y-axis scales up to 600,000, and a large callout box highlights $1.3M in bookings . This is a high-conviction move; by leading with revenue, the founders frame the rest of the deck as an explanation of how they achieved this growth, rather than a plea for capital to start it.
The Persona and the Contrast
Slide 3: The Customer Persona We are introduced to 'Sarah,' who spends $40,000 on DOZ . This slide serves two purposes: it humanizes the data from the previous slide and establishes a high Average Contract Value (ACV). It signals to investors that DOZ is not a micro-task platform for $5 logos, but a platform for significant marketing spend.
Slide 4: The Legacy Problem Without using a single bullet point to describe 'high overhead' or 'slow agency cycles,' DOZ uses a still from the show Mad Men . The image of a crowded, smoke-filled boardroom represents the old, inefficient way of doing marketing. It is a clever use of cultural shorthand to establish the 'Problem' without cluttering the slide with text.
Product as the Solution
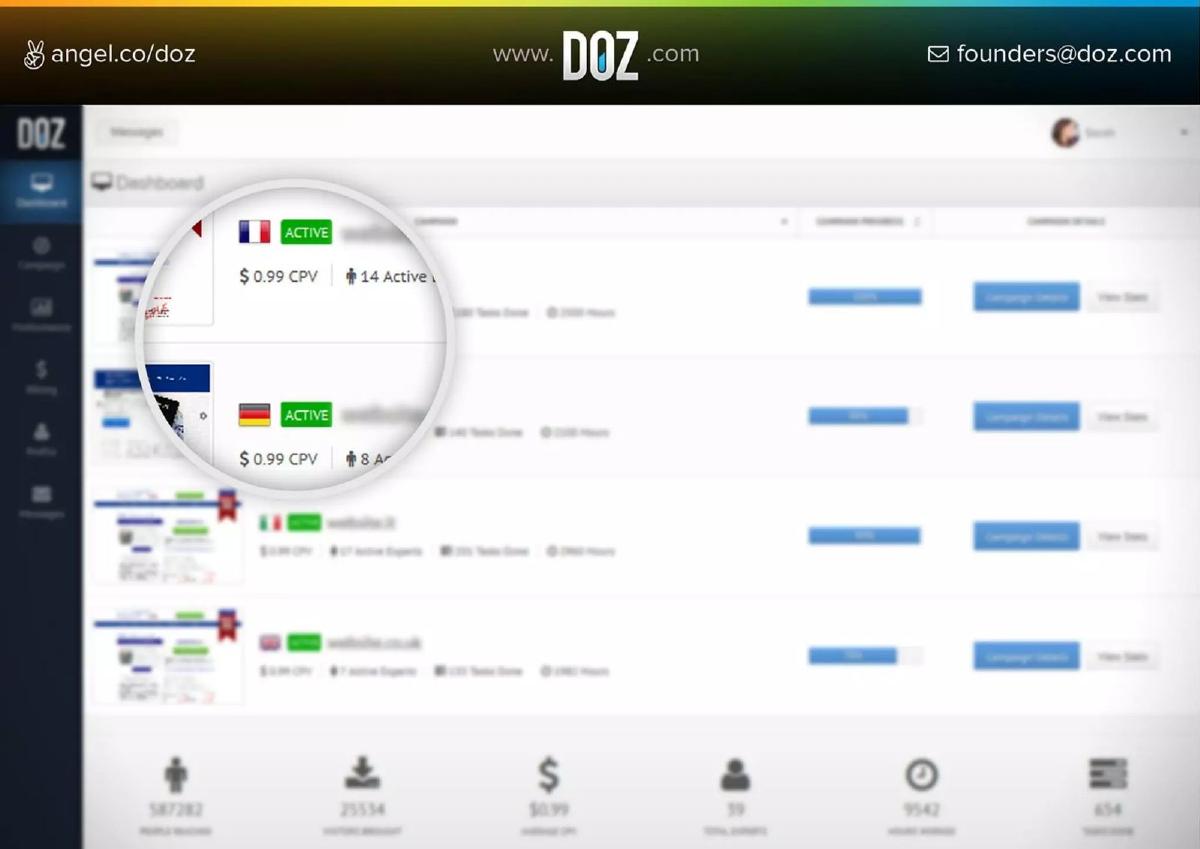
Slide 5: The Global Dashboard The deck moves into product screenshots. Slide 5 shows a dashboard with a magnifying glass hovering over French and German flags. The text $0.99 CPV (Cost Per View) and 14 Active Experts are visible. This confirms the 'Marketing Team Anywhere' tagline by showing real-time global execution.
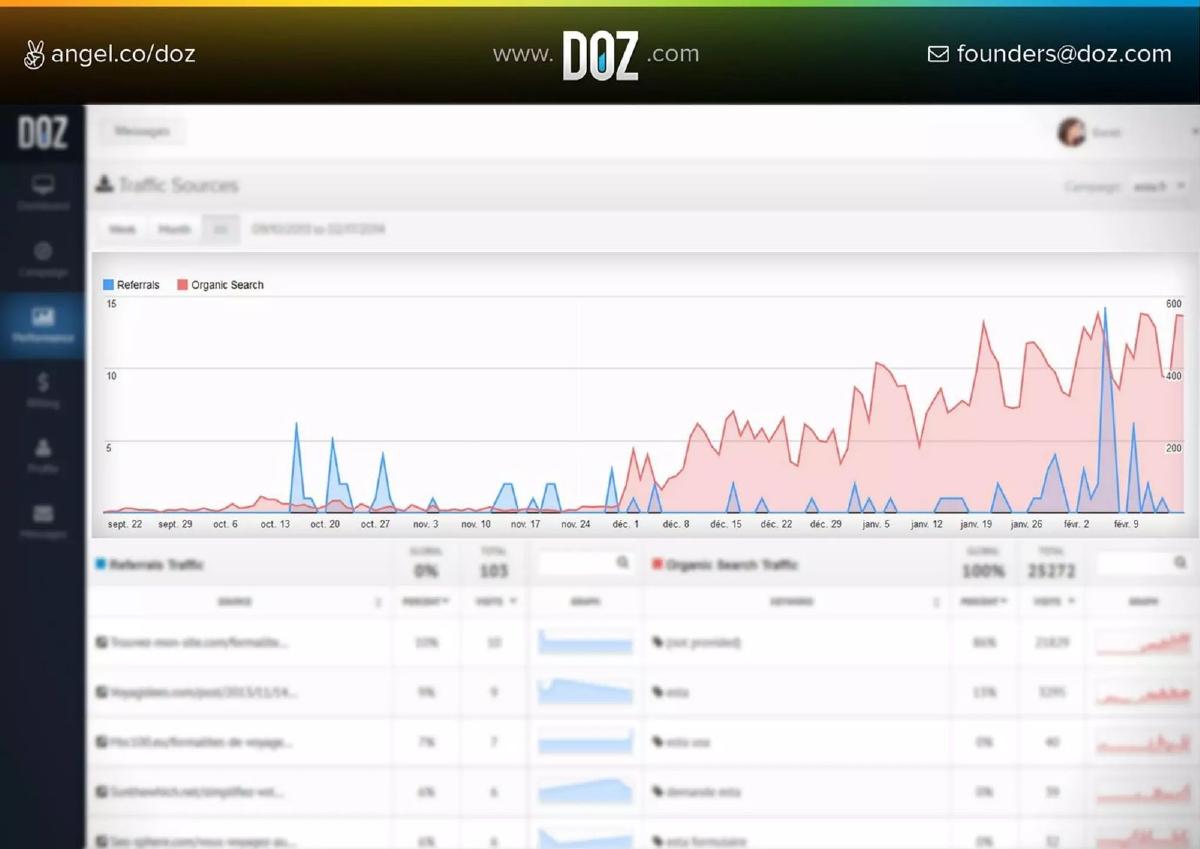
Slide 6: Performance Analytics This slide shows a detailed traffic source graph, contrasting 'Referrals' with 'Organic Search.' The data shows a significant spike in organic search traffic over a five-month period. This proves that the 'experts' mentioned in the previous slide are actually delivering results, providing a 'Proof of Value' for the software.
Slide 7: The Workflow Slide 7 breaks down the DOZ engine into three steps: 1. Analysis , 2. Tasks , and 3. Matching . The visual shows a website URL being entered, tasks being generated for social media, SEO, and content marketing, and then being matched to vetted experts (represented by German flags). This is the closest the deck gets to a 'How it Works' slide, and it manages to explain a complex algorithmic matching process using only icons and arrows.
The Market Opportunity
Slide 8: Market Size and Expansion The final slide features a map of the United States with a $30B digital marketing label. Large blue arrows point toward Japan, China, India, Malaysia, LatAm, Europe, the Middle East, and Africa. This slide serves as the 'Vision' slide, suggesting that while they have already captured $1.3M in bookings, the global opportunity is orders of magnitude larger. It is a classic 'Total Addressable Market' (TAM) slide, but again, delivered with minimal text.
What Works in the DOZ Deck
The primary strength of this deck is its brevity . In a sea of 40-page decks, an 8-page deck that leads with a million dollars in revenue is impossible to ignore. The use of full-screen imagery and high-contrast text makes the deck highly readable on mobile devices, which is where many initial investor reviews happen.
The visual metaphors are also highly effective. Using a recognizable image from Mad Men to represent the 'Problem' is more memorable than a list of agency pain points. Furthermore, the product slides (5 and 6) are not just static mockups; they show data and activity, which reinforces the traction shown on Slide 2.
What is Missing from the DOZ Deck
While the deck is excellent as a 'teaser,' it leaves several critical questions unanswered for a formal Seed round evaluation:
No Team Slide: There is zero information about the founders' backgrounds, their technical expertise, or their experience in the marketing industry. Investors at the Seed stage typically bet on the team as much as the traction. · No Business Model: While we see 'Sarah' spending $40,000, we don't know DOZ's take rate. Is it a 10% marketplace fee? A SaaS subscription? A markup on expert labor? The unit economics are completely absent. · No Competitive Landscape: The deck assumes there are no other ways to hire global marketing experts. It fails to mention competitors like Upwork (then oDesk/Elance) or specialized agencies. · No Clear 'Ask': The deck ends on a market map rather than a slide detailing how much they are raising and what the milestones for that capital will be.
What Founders Should Copy
Founders should emulate DOZ's 'Traction First' approach. If you have significant revenue or user growth, do not bury it on Slide 12. Put it on Slide 2. It changes the psychology of the investor from 'Should I believe this problem exists?' to 'How do I get a piece of this growth?'
Additionally, the 'One Idea Per Slide' rule is executed perfectly here. Each slide has a singular focus: Traction, Persona, Problem, Product, Performance, Workflow, and Market. This prevents cognitive overload and ensures that the investor remembers the key takeaways. Finally, the use of specific numbers (like $0.99 CPV and $40,000 spend) adds a layer of authenticity that vague marketing speak ('cost-effective,' 'scalable') can never achieve.
Conclusion
The DOZ deck is a high-risk, high-reward presentation. It relies on the strength of a single metric ($1.3M in bookings) to carry the entire narrative. For most startups, a bit more detail on the team and the 'Ask' would be necessary, but DOZ proves that if the core business engine is humming, you don't need a hundred slides to prove it. It is a masterclass in efficiency, proving that in fundraising, sometimes less truly is more.
Frequently asked questions
- How does DOZ explain its business model without a dedicated slide?
- DOZ relies on Slide 7 to imply its model. By showing a workflow that moves from 'Analysis' to 'Tasks' to 'Matching' with global experts (represented by country flags), the deck suggests a marketplace or managed service model. The $40,000 spend figure on Slide 3 further implies that they handle significant enterprise-level marketing budgets rather than small, one-off tasks.
- Is the lack of a team slide a dealbreaker for a Seed round?
- In 2009, and especially for a company with $1.3M in bookings, traction often speaks louder than resumes. While a team slide is standard, DOZ likely used this deck as a visual aid for a live presentation where the founders were already present, or as a follow-up to an initial meeting where the team's background was already established.
- What is the significance of the 'Sarah' slide?
- Slide 3 is a 'Proof of Concept' slide. By naming a specific user and a specific high-dollar spend ($40,000), DOZ demonstrates that their platform is capable of handling large accounts. It moves the conversation from 'what is this?' to 'who else is spending this much?', which is a much stronger position for a founder.
- Why did the deck include a slide from the TV show Mad Men?
- Slide 4 is a visual shorthand for the traditional, expensive, and slow advertising agency model. By contrasting this image with the modern SaaS dashboard shown on Slides 5 and 6, DOZ creates a 'Before vs. After' narrative without writing a single word about the inefficiencies of the legacy marketing industry.
- What is the most effective part of this 8-slide deck?
- The traction slide (Slide 2) is the most effective. It uses a clear line graph with four data points (Q2-13 to Q1-14) showing an accelerating upward trend. The bold '$1.3M in bookings' text ensures that even if an investor only looks at the deck for 10 seconds, they walk away with the most important metric.