Who pays in education, and for what: learners, parents, teachers, schools or employers.
Edtech Business Model Slide: Who Pays, and Per What
In education the person who learns is often not the person who pays. Students, parents, teachers, schools and employers each buy differently, at different prices and on different cycles. This guide compares eight real edtech business model slides on one question: does the slide name who pays, what they pay for (a course, a seat, a month, a booking, a placement), and at what price and period?
TL;DR
Name each payer, the unit they buy and the price with its period. DataCamp does this in two lines: consumers pay $29 a month or $300 a year, businesses $300 per seat per year. Careerist shows two payers for the same student: the student (up to $12,500, upfront or deferred) and the employer (10–20% recruiting fees). Coding Autism prices tuition per student and multiplies it out; one of its three yearly totals is $5,000 off. Apprentus, Tinker Bot and Afriblock price some plans but leave gaps. Kanpur Tech's revenue lines add up but never show how many students pay which fee. I Don't Serve Coffee multiplies every humanities undergraduate in Australia by $10 a month.
Edtech business model slides from real pitch decks
Each example shows the slide above its analysis and links to the full teardown. Slides that name each payer with a unit, price and period come first. Claims are as shown on the slides; checks and comments are ours.
DataCamp business model slide — slide 8
Online data science courses. Another page of this deck appears in the AI team guide.
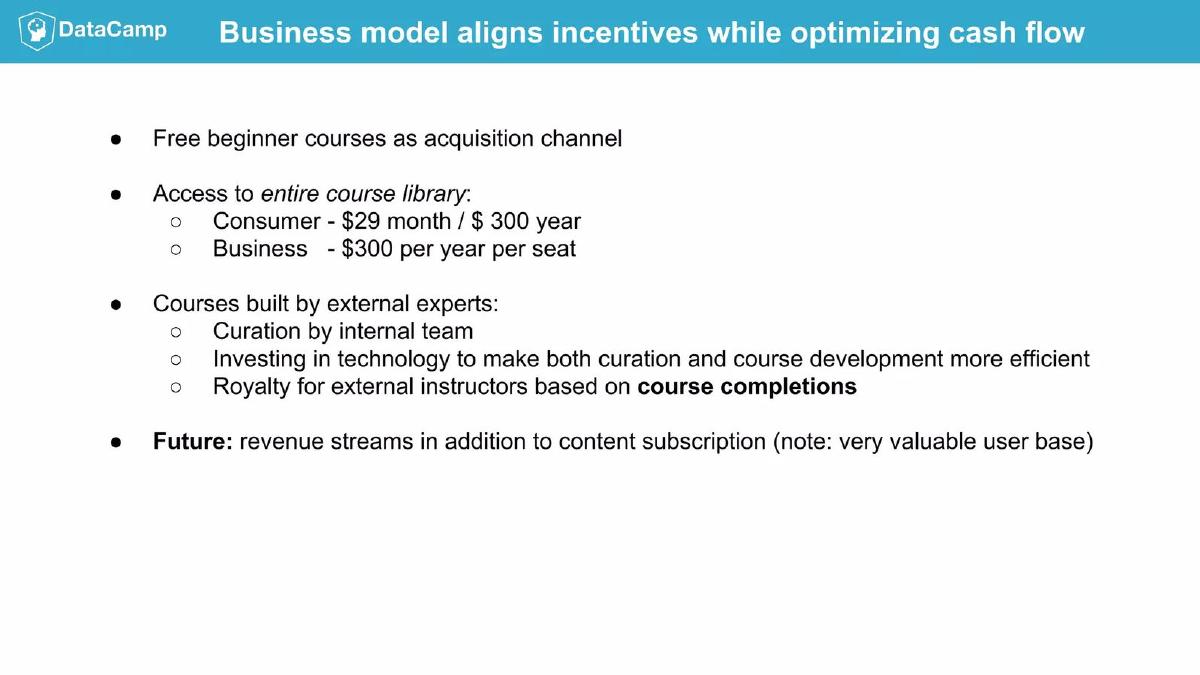
DataCamp deck, slide 8. Exact stored slide matched to this analysis.
Our analysis: One library sold two ways, with the free courses feeding both. Linking royalties to completions ties instructors' pay to learners finishing.
Evidence and limitation: Two payers, each with a unit and a period. The yearly consumer plan is about $25 a month, a discount of roughly 14% on monthly billing. The slide explains the main cost (instructor royalties tied to completions) but gives no royalty rate, and no split of revenue between consumer and business.
What a founder can adapt: Add the split and the rate: "[X]% of revenue from business seats; royalty [Y]% of [base]".
Supporting analysis
What the deck claims: "Business model aligns incentives while optimizing cash flow." "Free beginner courses as acquisition channel." "Access to entire course library: Consumer – $29 month / $300 year; Business – $300 per year per seat." "Courses built by external experts: curation by internal team… Royalty for external instructors based on course completions." "Future: revenue streams in addition to content subscription."
Presentation choice: It is the only slide here that prices every payer with a period and names the main cost.
When it does not fit: Vague "future revenue streams" lines on a slide that is otherwise specific.
Career training that places graduates in tech jobs. Other pages of this deck appear in the financials, growth-rate and profitability guides.
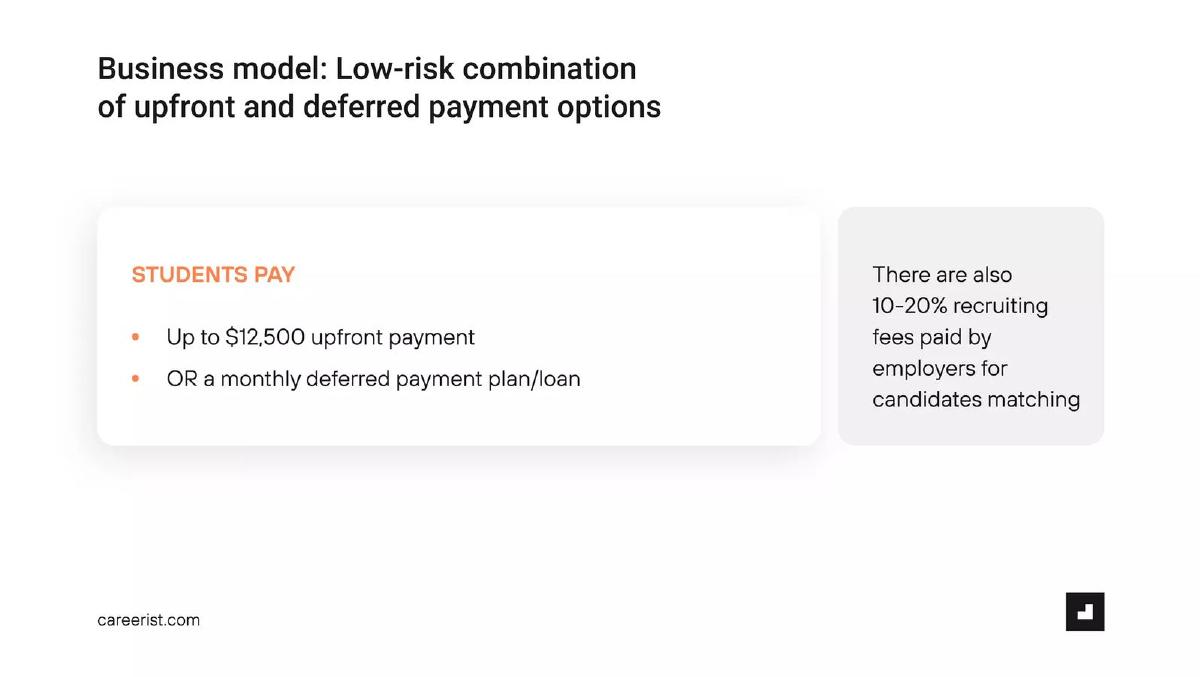
Careerist deck, slide 8. Exact stored slide matched to this analysis.
Our analysis: The employer fee is extra revenue from the same student and a signal that graduates get hired.
Evidence and limitation: Two payers for one student. The student price is a ceiling ("up to"), and the slide doesn't give the typical price, the deferred plan's terms, or what the 10–20% is charged on (usually first-year salary in recruiting, but the slide doesn't say). No share of graduates placed with paying employers.
What a founder can adapt: "Average price $[X]; [Y]% choose deferred; employer fee [10–20]% of [first-year salary], paid for [Z]% of graduates".
Supporting analysis
What the deck claims: "Business model: Low-risk combination of upfront and deferred payment options." "Students pay: Up to $12,500 upfront payment; OR a monthly deferred payment plan/loan." "There are also 10–20% recruiting fees paid by employers for candidates matching."
Presentation choice: It separates the learner payment from the employer payment and offers a deferred option, which matters when the price is high.
When it does not fit: A ceiling price with no typical price.
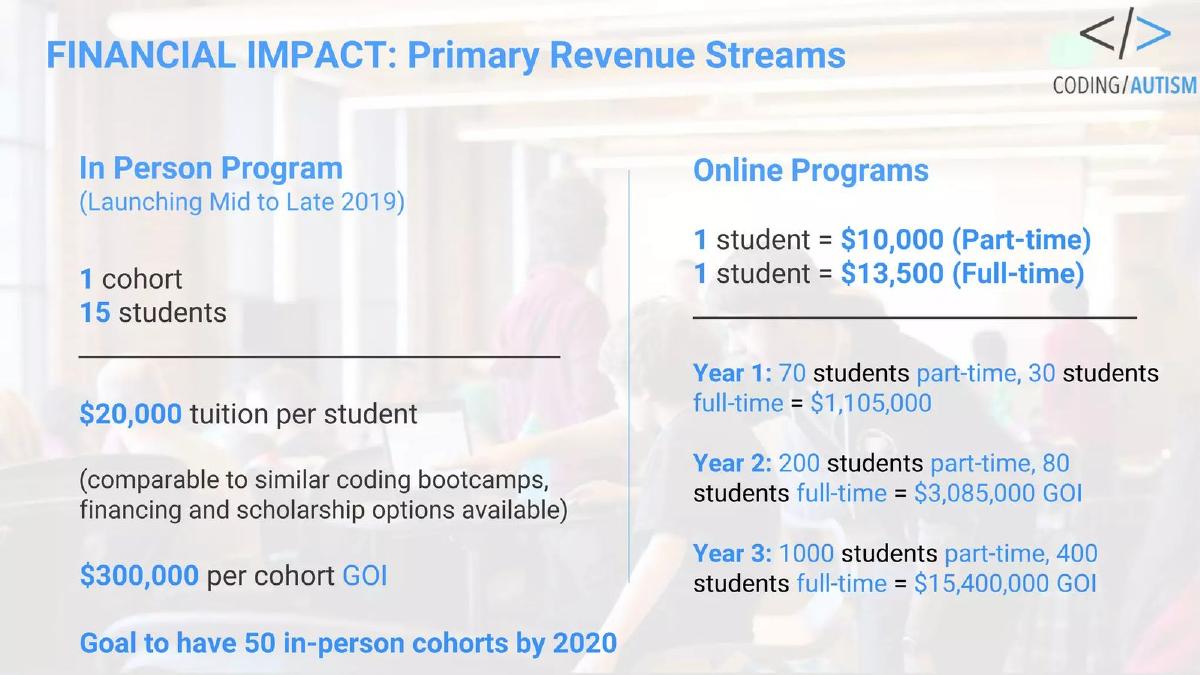
Coding Autism deck, slide 13. Exact stored slide matched to this analysis.
Our analysis: Price per student times students, with a clear split between formats.
Evidence and limitation: The cohort figure holds (15 × $20,000 = $300,000), as do Years 1 and 3. Year 2 works out to $3,080,000 (200 × $10,000 + 80 × $13,500), $5,000 less than shown. The slide doesn't say who pays the tuition: students, families, scholarships or public funding, which matters for a price of $10,000 to $20,000.
What a founder can adapt: Name the payer: "[X]% self-pay, [Y]% through [funding programme or employer]", and correct Year 2 to $3,080,000.
Supporting analysis
What the deck claims: "Financial impact: Primary revenue streams." In-person programme (launching mid to late 2019): "1 cohort, 15 students", "$20,000 tuition per student", "$300,000 per cohort", "Goal to have 50 in-person cohorts by 2020". Online: "1 student = $10,000 (part-time); 1 student = $13,500 (full-time)"; "Year 1: 70 students part-time, 30 students full-time = $1,105,000"; "Year 2: 200 part-time, 80 full-time = $3,085,000"; "Year 3: 1000 part-time, 400 full-time = $15,400,000". Tuition is "comparable to similar coding bootcamps, financing and scholarship options available".
Presentation choice: Every total can be recomputed from the figures on the slide.
When it does not fit: Leaving the payer out when the price is high.
Marketplace for private lessons. A different page of this deck appears in the edtech solution guide.
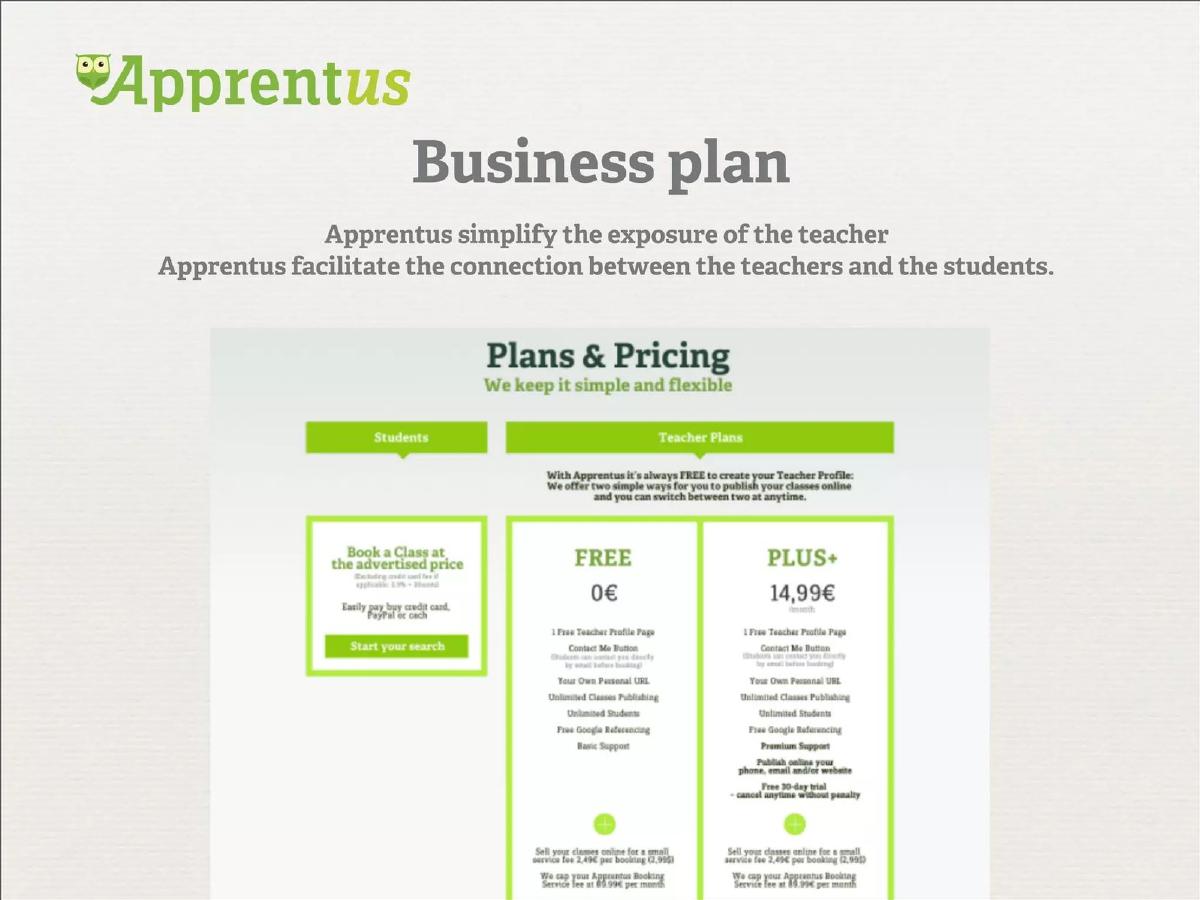
Apprentus deck, slide 9. Exact stored slide matched to this analysis.
Our analysis: Teachers are the paying side; students pay the teacher's price.
Evidence and limitation: Three revenue lines are visible: a teacher subscription, a per-booking fee and a monthly cap. The page is a website screenshot and the small text is hard to read at slide size. The slide doesn't say who pays the booking fee (the teacher's column suggests teachers), and gives no bookings or subscriber numbers.
What a founder can adapt: Put the model in one sentence above the screenshot: "Teachers pay €2.49 per booking (capped at €89.99 a month) or €14.99 a month for Plus".
Supporting analysis
What the deck claims: "Business plan. Apprentus simplify the exposure of the teacher. Apprentus facilitate the connection between the teachers and the students." A pricing page: students "Book a Class at the advertised price" with a card fee note; teacher plans "FREE 0€" and "PLUS+ 14,99€/month"; "Sell your classes online for a small service fee 2,49€ per booking (2,99$)"; "We cap your Apprentus Booking Service fee at 89,99€ per month".
Presentation choice: It prices both the subscription and the per-booking fee, and the cap tells heavy users what they'll pay at most.
When it does not fit: Relying on a website screenshot as the business model slide.
Tinker Bot deck, slide 6. Exact stored slide matched to this analysis.
Our analysis: A software subscription split by customer size.
Evidence and limitation: Two payer groups with starting prices and a period. "Starting at" gives the floor only, and the slide doesn't say what the price scales with (students, teachers or features).
What a founder can adapt: "Schools: $30 a month for up to [N] students, then $[X] per [unit]".
Supporting analysis
What the deck claims: "Revenue Model." "Tutors and Small Institution plans starting at $12/month." "Schools and College plans starting at $30/month."
Presentation choice: Short and clear about who pays and how often.
When it does not fit: Starting prices with no scaling unit.
Afriblock deck, slide 13. Exact stored slide matched to this analysis.
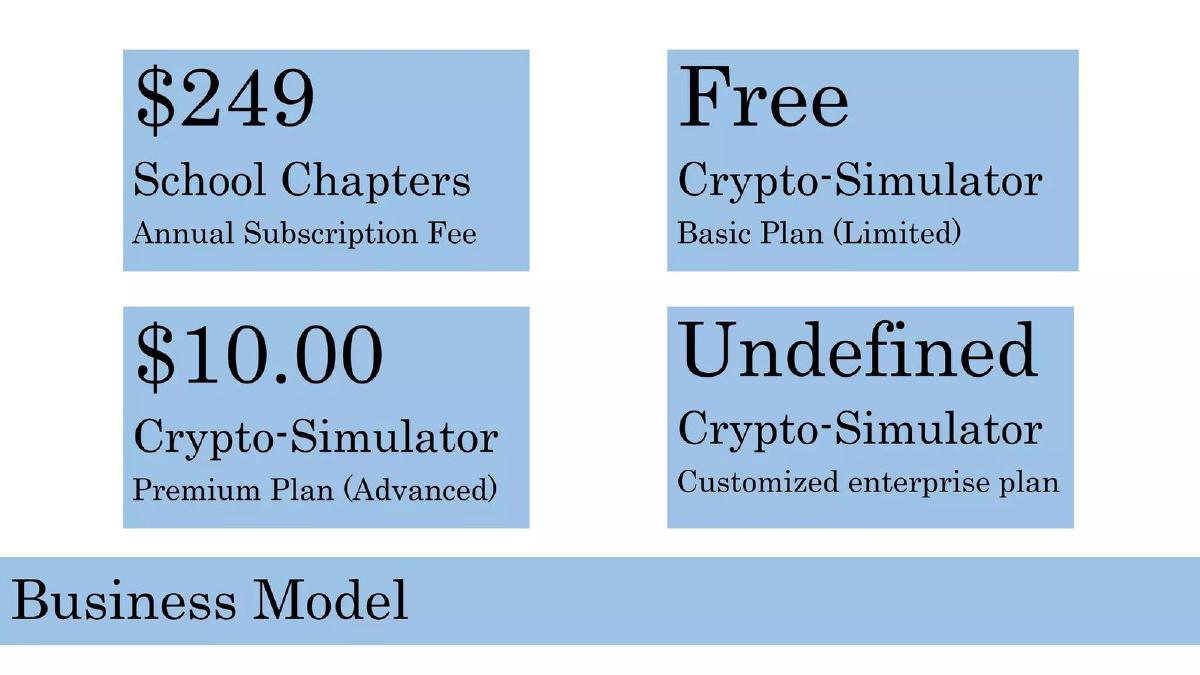
Our analysis: Schools pay yearly for chapters; individuals get a free tier and an upgrade.
Evidence and limitation: The school fee has a period (annual); the $10 premium plan doesn't say per month, per year or one-off. "Undefined" for the enterprise plan is honest but gives no range.
What a founder can adapt: "Premium $10 per [month]; enterprise from $[X] per year".
Supporting analysis
What the deck claims: "Business Model." "$249 School Chapters Annual Subscription Fee." "Free Crypto-Simulator Basic Plan (Limited)." "$10.00 Crypto-Simulator Premium Plan (Advanced)." "Undefined Crypto-Simulator Customized enterprise plan."
Presentation choice: It separates the institutional payer from individual users.
Skills training in India. Included as a weaker example.
Kanpur Tech deck, slide 12. Exact stored slide matched to this analysis.
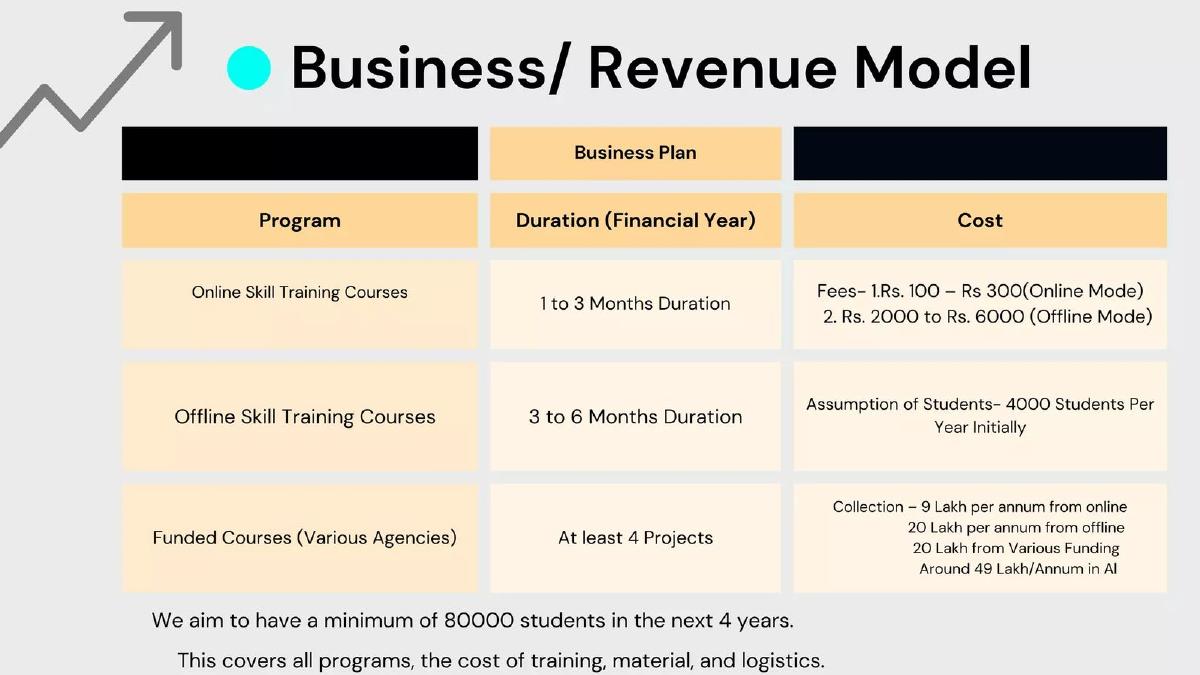
Our analysis: Three income sources, with grants carrying a large share.
Evidence and limitation: The collection lines add up to 49 lakh (4.9 million rupees). The slide doesn't split the 4,000 students between online and offline. The figures fit one split: 3,000 online students at the top price (Rs 300) and 1,000 offline students at the bottom price (Rs 2,000). If that is the assumption, the slide should say so. About 41% of the total comes from agency funding, which is not course sales.
What a founder can adapt: "[X] online students × Rs [price] = Rs [A]; [Y] offline × Rs [price] = Rs [B]; funded projects Rs [C] (grants, not repeatable)".
Supporting analysis
What the deck claims: "Business/Revenue Model." Online courses 1–3 months, offline 3–6 months, funded courses ("at least 4 projects"). Fees "Rs. 100 – Rs 300 (Online Mode)" and "Rs. 2000 to Rs. 6000 (Offline Mode)". "Assumption of Students – 4000 Students Per Year Initially." "Collection – 9 Lakh per annum from online, 20 Lakh per annum from offline, 20 Lakh from Various Funding, Around 49 Lakh/Annum in All." "We aim to have a minimum of 80000 students in the next 4 years."
Presentation choice: Included to show totals that can only be traced back by guessing the split.
When it does not fit: Fee ranges and totals with no student split.
I Don't Serve Coffee business model slide — slide 6
Career help for humanities students in Australia. Included as a weaker example.
I Don't Serve Coffee deck, slide 6. Exact stored slide matched to this analysis.
Our analysis: A market-size figure presented as revenue.
Evidence and limitation: 200,000 × $10 = $2 million, so the arithmetic holds, but it assumes every humanities undergraduate in Australia pays. The slide gives no expected paying share, and doesn't say whether students, parents or universities would pay.
What a founder can adapt: "200,000 students × [X]% paying × $10 a month = $[Y] a month; [X]% is based on [pilot or comparable]".
Supporting analysis
What the deck claims: "Business Model. Charging $10 per month for Premium access." "200K Undergraduate Humanities Students in Australia" · "$10 Cost per month for Premium access" · "$2M Monthly Revenue".
Presentation choice: Included to show the most common error in edtech revenue slides.
When it does not fit: Multiplying the whole student population by the price.
Whether each slide names the payer, the unit bought, and a price with a period.
Example
Payer(s)
Unit
Price and period
Main gap
DataCamp
Consumers; businesses
Subscription; seat
$29/month, $300/year; $300/seat/year
Revenue split
Careerist
Students; employers
Programme; placement
Up to $12,500; 10–20%
Typical price; fee base
Coding Autism
Not stated
Student
$10,000–$20,000
Payer; Year 2 total
Apprentus
Teachers
Booking; month
€2.49/booking; €14.99/month
Volumes
Tinker Bot
Tutors; schools
Month
From $12 and $30/month
Scaling unit
Afriblock
Schools; individuals
Chapter; plan
$249/year; $10 (period?)
Premium period
Kanpur Tech
Students; agencies
Course; project
Rs 100–300; Rs 2,000–6,000
Student split
I Don't Serve Coffee
Not stated
Month
$10/month
Paying share
Key Takeaways
Name each payer separately: learner, parent, teacher, school, employer or funder.
Give the unit they buy: per course, per seat, per month, per booking or per placement.
State the period for every price.
Multiply price by the number who pay, not by the whole population.
Say when a school or employer pays, and how long that sale takes.
Keep grants and funded programmes apart from sales.
Build your edtech business model slide
One line per payer.
Payers. Who pays: learner, parent, teacher, school, employer, funder?
Unit. What does each buy: course, seat, month, booking, placement?
Price and period. Price per unit, and per month, year or one-off?
Paying count. How many pay today, or what share do you assume, and why?
Non-sales income. Grants or funded programmes, listed separately.
Copyable framework: [Payer] pays $[price] per [unit] per [period]; [N] paying today ([date]). Grants: $[X] ([funder], not repeatable).
Illustrative example 1 — written by us
Before: Schools and students can buy premium plans.
After: Schools: $[X] per seat per year, [N] schools signed ([date]). Students: $[Y] a month, [Z]% of active users pay.
What improved: Our illustrative rewrite; bracketed figures are placeholders, not company facts. It names each payer with a unit, a period and a count.
What this guide adds
The edtech problem and solution guides cover what the product fixes and how. The consumer app business model guide covers freemium plans. This guide covers the payer question specific to education: when the learner, the institution and sometimes an employer or funder all sit in the model, the slide has to say which one pays for what.
Payers and units
Learners and parents usually pay per course or per month. Schools and companies usually pay per seat or per site per year, and often on a budget cycle. Employers in career-training models pay a placement fee. Grants and agency funding are income but not repeatable sales.
The unit matters because it sets how revenue grows: per seat grows with headcount, per booking with activity, per placement with job outcomes.
How we read each slide
We quote the text on the slide images and redid every multiplication shown. We have not checked company claims. None of these pages was in our stored image set, so we rendered each from the original deck file in our library; the pages shown are the ones quoted.
Common mistakes
Population as customers. Multiply by the share who pay, not all students.
Payer missing. Say who pays when the learner may not be the buyer.
Price without a period. Per month, per year or one-off.
Ceiling prices only. Give the typical price, not just "up to".
Grants mixed with sales. Show funded income on its own line.
Totals without the split. Show how many students pay each fee.
Diagnostic checklist
Names every payer.
Gives each payer's unit, price and period.
Multiplies by paying customers, not the whole market.
Separates grants and funding from sales.
Totals can be recomputed from the slide.
Frequently asked questions
What should an edtech business model slide show?
Who pays (learner, parent, school, employer), what unit they buy, and the price with its period. DataCamp's slide prices consumers at $29 a month or $300 a year and businesses at $300 per seat per year.
Can I multiply the number of students by my price?
Only by the number you expect to pay. I Don't Serve Coffee multiplies all 200,000 humanities undergraduates in Australia by $10 a month, which assumes every one of them pays.
How we chose these examples
Corpus: published pitch deck teardowns on StartupFundraising.com. Founder-uploaded private decks are excluded.
Selection (2026-09-26): we searched teardowns in education for business model, revenue model, pricing and monetization slides, and for per-student, per-school, per-teacher and per-seat pricing. We rendered 16 candidate pages from 14 decks (two deck files were not in the library) and read each.
Kept eight. Excluded: Imblaze p11 (an ask slide, not a model), Alpe p6 (the page read was a product overview), Chalkable p7 (a section divider), Innovamat p3 (positioning), Kinjo p15 (a product launch), Laoshi p13 (text too faint to quote reliably).
None of the chosen pages was in our stored image set; we rendered them from the original deck PDFs in our library and stored them with the existing slide-image workflow. All eight decks were confirmed as published teardowns on 2026-09-26.
Review: slide images were checked on 2026-09-26 and matched to company, deck and page (editorial model review). No person has yet completed an editorial review of this page. We make no claim that any slide caused a fundraising outcome.