DataCamp’s April 2017 pitch deck is a metrics-heavy presentation that successfully argues for the scalability of specialized online education. The deck highlights a 2.6x growth in registered users to 908,000 and a 5x increase in quarterly cash-in to $1.7M within a single year. By positioning themselves as the 'second wave' of online education—moving away from generic video-based training toward interactive, personalized learning—DataCamp justifies its focus on the data science niche. The inclusion of granular unit economics, such as a $26.82 CAC per subscriber, provides the financial transpar…
Key takeaways
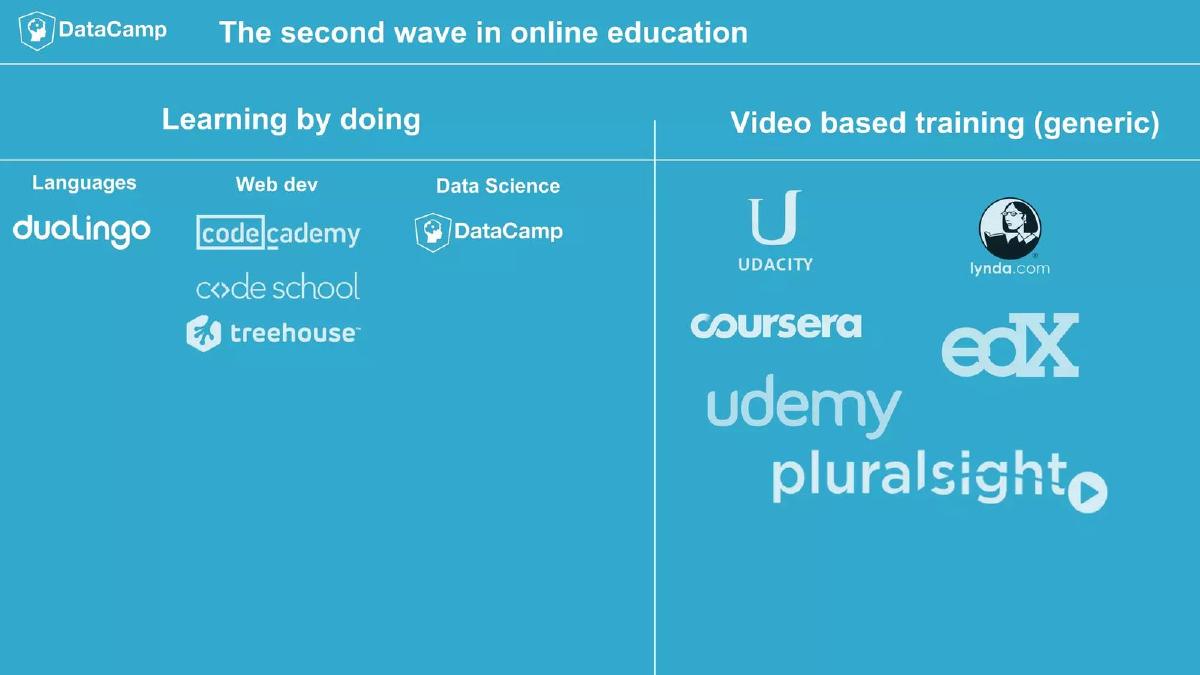
- The company positions itself in the 'second wave' of online education, prioritizing interactive learning over generic video training (Slide 3).
- Registered users grew 2.6x in 12 months, reaching 908,000 with a growth rate of over 2,000 students per day (Slide 10).
- The subscriber base reached approximately 21,500 by March 2017, doubling in less than four months (Slide 12).
- Quarterly cash-in increased 5x year-over-year to $1.7M by April 2017 (Slide 13).
- The business model utilizes free beginner courses for acquisition, with consumer subscriptions at $29/month or $300/year (Slide 8).
- DataCamp leverages external experts to build courses, paying royalties based on course completions (Slide 8).
- Unit economics are highly detailed, showing a total CAC per subscriber of $26.82 as of February 2017 (Slide 21).
- The team grew 3x in 12 months to 30 people, with a heavy 50% concentration in engineering (Slide 17).
DataCamp Pitch Deck Teardown: The Shift to Interactive Vertical Learning
The DataCamp April 2017 investor pitch deck represents a pivotal moment for the company as it transitioned from a niche tool for R programmers into a comprehensive data science education platform. With 24 slides, the deck is comprehensive, data-driven, and focused heavily on growth metrics and unit economics.
Slides 1-2: The Vision
The deck opens with a simple title slide (Slide 1) featuring the name DataCamp and the date 11/4/2017. Slide 2 immediately establishes the mission: "BUILD THE BEST LEARNING EXPERIENCE FOR DATA SCIENCE." This is a clear, vertical-specific goal that sets the stage for the competitive positioning that follows.
Slides 3-5: Market Positioning and the 'Second Wave'
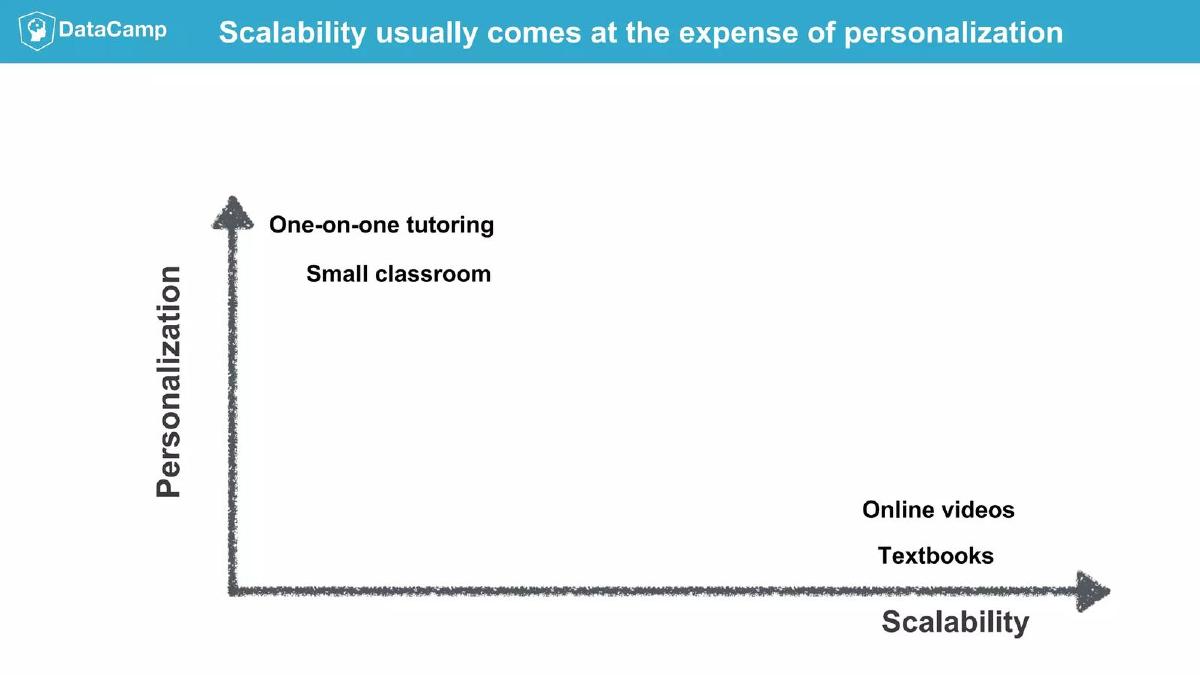
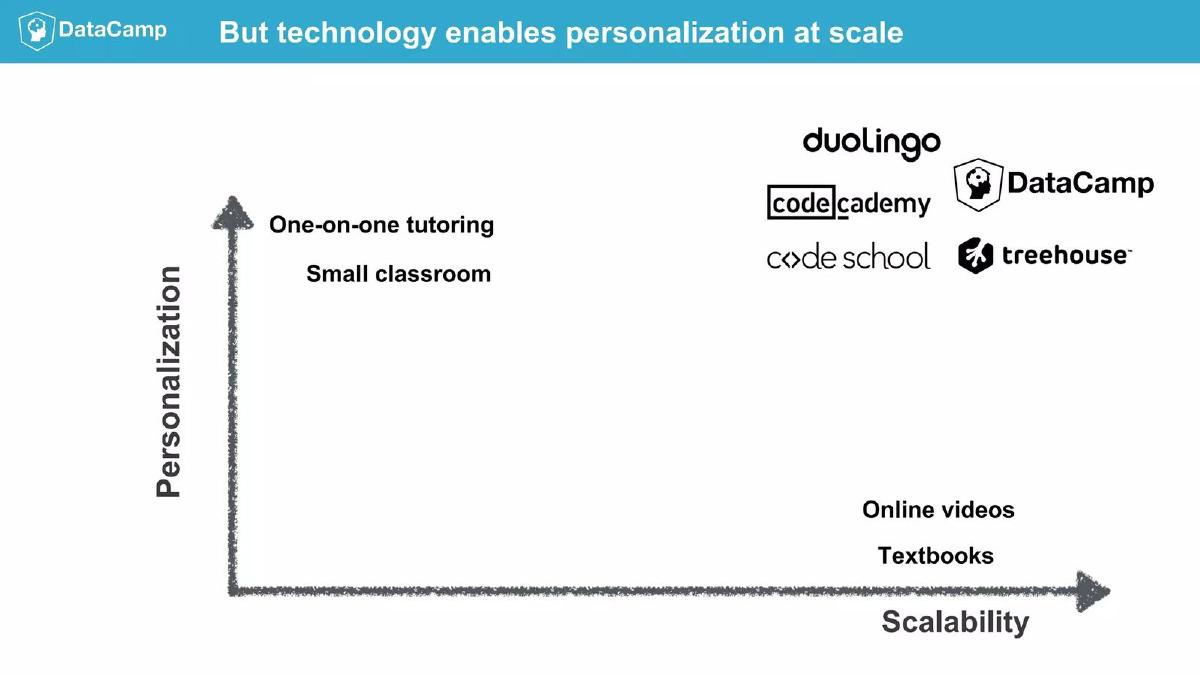
Slide 3 is one of the most strategic in the deck. It categorizes the online education market into two segments: "Learning by doing" and "Video based training (generic)." By placing themselves alongside Duolingo and Codecademy, and distancing themselves from MOOC giants like Coursera, Udacity, and Udemy, DataCamp frames itself as a modern, high-engagement alternative to passive learning. Slides 4 and 5 use a 2x2 matrix to argue that while textbooks and videos scale, they lack personalization. DataCamp claims to use technology to bridge this gap, offering "personalization at scale."
Slides 6-7: Product Demonstration
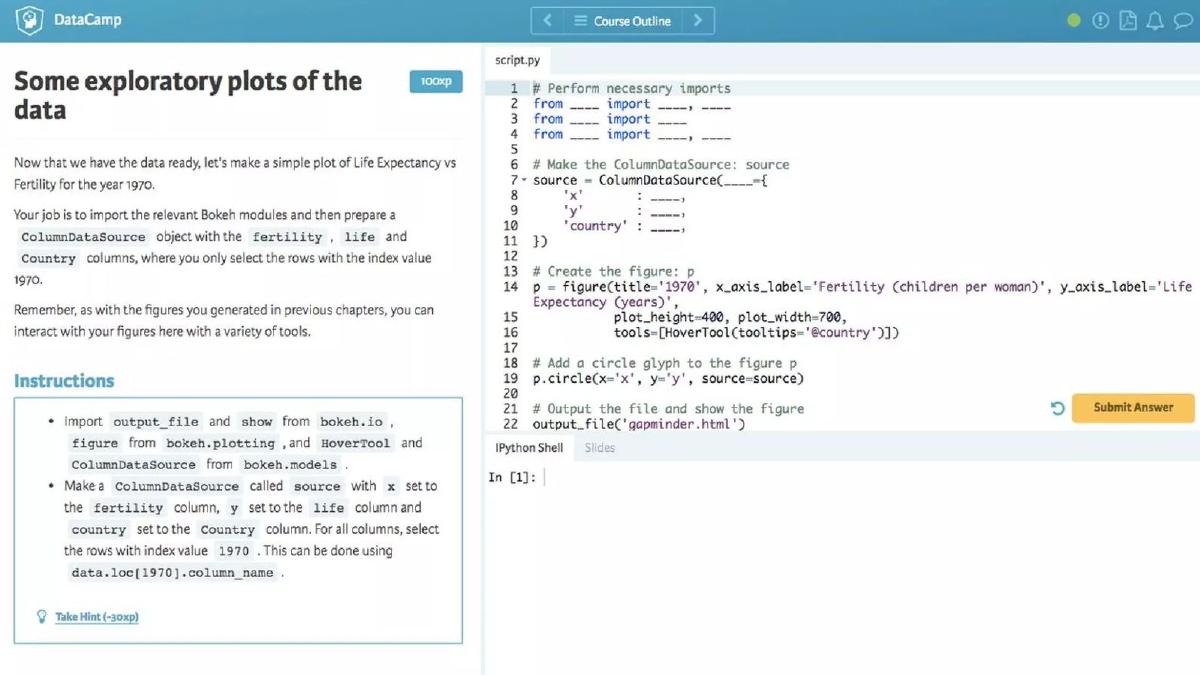
Rather than just talking about the product, Slides 6 and 7 provide screenshots of the actual learning interface. Slide 6 shows a Python coding exercise with instructions, a script editor, and an IPython Shell. Slide 7 shows the "Exercise Completed" state with a data visualization output. This proves the product is functional and delivers on the "learning by doing" promise mentioned earlier.
Slide 8: The Business Model
DataCamp outlines a clear, three-pronged business model on Slide 8:
Acquisition: Free beginner courses. · Subscription: $29/month or $300/year for consumers; $300/year per seat for businesses. · Content Production: Courses built by external experts with royalties paid based on course completions .
This model is particularly strong because it aligns instructor incentives with student success (completions) rather than just views.
Slides 9-13: Traction and Growth Metrics
This section is the core of the deck's persuasive power. Slide 10 shows that the user base grew 2.6x in 12 months to 908,000 , with a current growth rate of over 2,000 students per day. Slide 11 notes that 70% of these users are professionals, listing logos from major firms like Google, Facebook, JPMorgan Chase, and Pfizer to demonstrate enterprise appeal. Slide 12 highlights that the subscriber base reached 21,500 , doubling in less than four months. Finally, Slide 13 shows quarterly cash-in hitting $1.7M , a 5x increase in 12 months.
Slides 14-17: Content and Team Scaling
Slide 14 shows the course library growing 3.2x to 70 courses, with 45 more in development. This indicates a healthy content pipeline. Slides 15 and 16 document the team's growth from a handful of people to 30. Slide 17 breaks down the team by function: 50% Engineering, 27% Course Development, and 17% Marketing/Sales. This breakdown suggests a product-led company that is just beginning to lean into sales.
Slides 18-20: Roadmap and Market Myth-Busting
Slide 19 outlines the next 12 months, focusing on library expansion, mobile applications, and assessment/certification. Slide 21 addresses a common investor concern: is data science a niche? DataCamp "debunks the myth" by citing 2.4M daily active sessions for RStudio and 13M YTD downloads for Anaconda (Python), as well as the 500M users of Excel who may eventually transition to open-source data tools.
Slide 21: Granular Unit Economics
Slide 21 is perhaps the most impressive slide for a sophisticated investor. It provides a full acquisition breakdown for February 2017. It lists channels (SEO, Word of Mouth, Paid, etc.) and calculates the CAC for both registered users and subscribers. The total CAC per subscriber is listed as $26.82 . Given their $300 annual subscription price, this represents an incredibly healthy LTV/CAC ratio, even without knowing the exact churn rate.
Slides 22-24: Community and Technology Focus
Slide 22 showcases their "best instructors," featuring well-known figures in the R and Python communities like Hadley Wickham and Max Kuhn. This serves as a "moat"—if the top experts are already teaching on DataCamp, it is harder for competitors to enter the space. Slide 23 visualizes the "Data Science Process" (Importing, Manipulation, Visualization, etc.) across different technologies, signaling their intent to cover the entire workflow for R, Python, SQL, and potentially Excel.
What DataCamp Got Right
Metric Transparency: Including a full CAC breakdown by channel (Slide 21) is rare in pitch decks and demonstrates high financial literacy and operational control. · Strategic Categorization: By defining the "Second Wave" of education (Slide 3), they successfully framed their competitors as outdated without being disparaging. · Incentive Alignment: The mention of paying royalties based on course completions (Slide 8) shows a sophisticated understanding of how to maintain content quality at scale. · Vertical Focus: They didn't try to be a general coding school. They stayed focused on Data Science, which allowed them to capture the community's top experts (Slide 22).
What Was Missing
The Ask: There is no slide stating how much money they are looking for or what the terms are. This information might have been reserved for the verbal pitch or a separate document. · Retention Data: While they show subscriber growth, they don't explicitly show churn or net revenue retention. For a subscription business, this is a critical missing piece. · Competitive Feature Comparison: While they categorize competitors, they don't show a feature-by-feature comparison to explain why their "interactive" environment is technically superior to others.
Founder Takeaways
Focus on Unit Economics Early: If you can show a $26 CAC against a $300 product with a 2.6x growth rate, the investment case almost writes itself. DataCamp’s Slide 21 is a gold standard for growth-stage decks. Use 'Wave' Theory to Position: If you are entering a crowded market, don't just say you are better. Say the market has shifted to a new "wave" and your competitors are stuck in the old one. Leverage Community Authority: If your business relies on content, showing that the industry's most respected figures are your partners (Slide 22) creates an immediate competitive moat that is difficult to disrupt with capital alone.
Frequently asked questions
- What is DataCamp's core value proposition according to the deck?
- DataCamp focuses on 'learning by doing' rather than generic video-based training. Slide 3 and 5 argue that while traditional online videos and textbooks scale well, they lack personalization. DataCamp uses technology to provide a personalized, interactive coding environment at scale, specifically for data science.
- How does DataCamp acquire and monetize users?
- The company uses a freemium model where free beginner courses act as the primary acquisition channel (Slide 8). They monetize through a subscription model: $29/month or $300/year for consumers, and $300/year per seat for businesses. Slide 21 shows that Word of Mouth is their strongest acquisition channel, accounting for 30% of registered users.
- What are the key financial metrics shared in the 2017 deck?
- The deck highlights significant growth: quarterly cash-in reached $1.7M (Slide 13), and the subscriber base grew to 21,500 (Slide 12). Most importantly, they disclose a blended CAC of $1.69 per registered user and $26.82 per subscriber, demonstrating efficient marketing spend relative to their $300 annual subscription price.
- Who builds the content for DataCamp?
- DataCamp uses a decentralized content creation model. While they have an internal curation team, the courses are built by external experts from the R and Python communities (Slide 8). These instructors receive royalties based on course completions, and Slide 22 showcases prominent community figures like Hadley Wickham and Max Kuhn.
- What was missing from this pitch deck?
- The deck is notably missing a specific 'Ask' slide detailing how much capital they are raising and the intended valuation. It also lacks a traditional 'Competition' slide that compares features directly, choosing instead to categorize competitors by 'wave' (Slide 3). Finally, there is no detailed exit strategy or long-term financial forecast beyond a mention of an external Excel file.