Datasembly’s 9-slide deck is a masterclass in brevity and problem-solution alignment. By focusing on the transition from manual, 'sparse' data collection to an automated, real-time platform, the company successfully targeted a $10 billion market across grocery, CPG, and retail sectors. The deck relies heavily on visual storytelling, using a simple bar chart to show revenue growth from near-zero to over $22,500 in less than a year. While it lacks detailed unit economics and a specific 'ask' slide, the clarity of its value proposition—standardized, scalable, and comprehensive data—provided a co…
Key takeaways
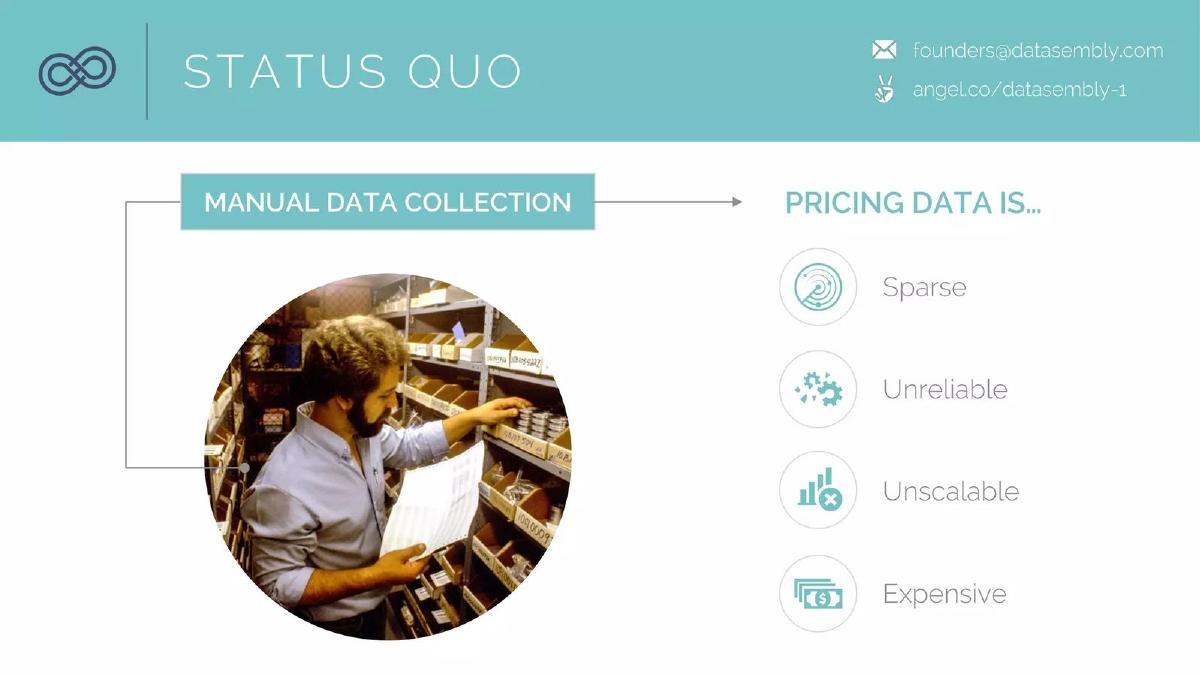
- The deck identifies four specific pain points in current pricing data: Sparse, Unreliable, Unscalable, and Expensive (Slide 3).
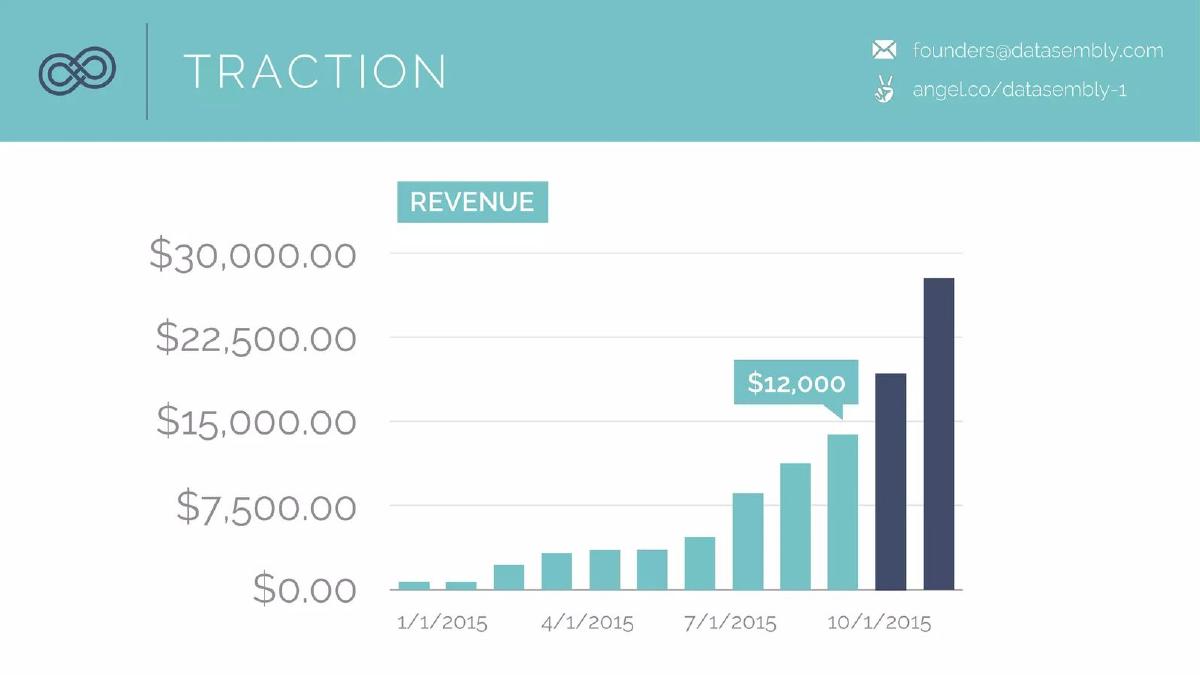
- Revenue traction is shown through a month-over-month bar chart peaking at approximately $27,000 by late 2015 (Slide 2).
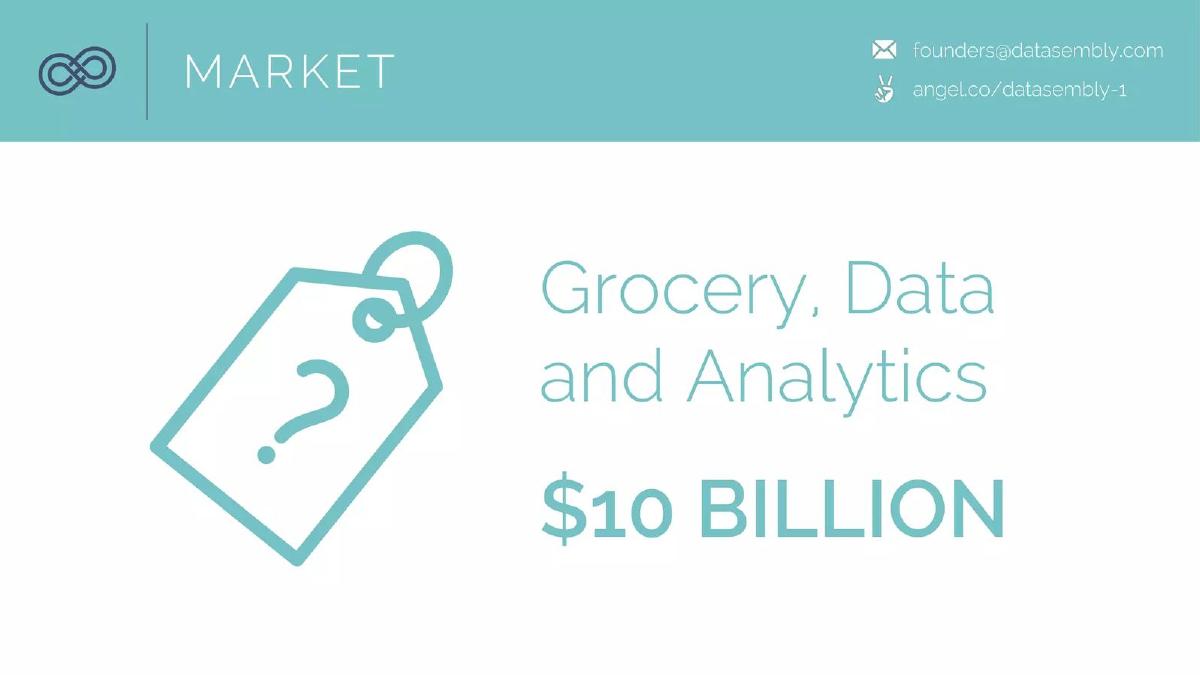
- The total addressable market for Grocery, Data, and Analytics is explicitly valued at $10 Billion (Slide 4).
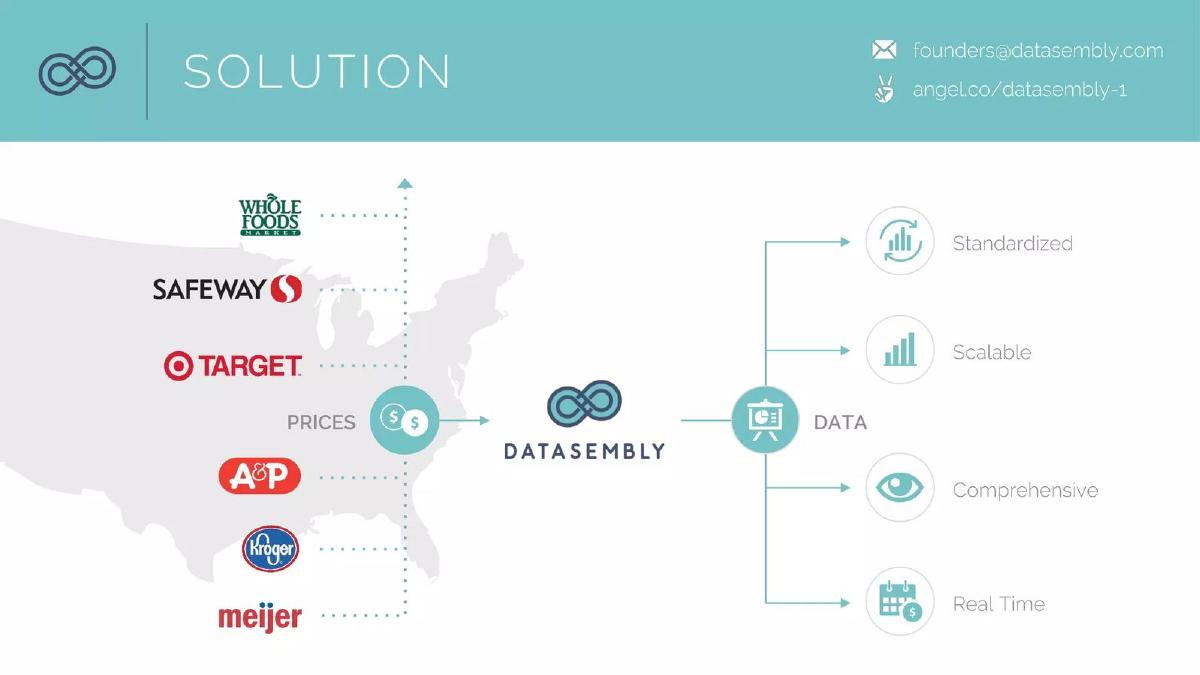
- The solution slide highlights partnerships or data sources including Target, Whole Foods, Kroger, Safeway, Meijer, and A&P (Slide 6).
- Datasembly defines its product value through four pillars: Standardized, Scalable, Comprehensive, and Real Time (Slide 6).
- The 'Growth Markets' slide expands the vision beyond grocery into Finance, Housing, Hospitality, Travel, and Pharmaceuticals (Slide 7).
- The team slide emphasizes a lean founding duo with credentials from Cornell University and Applied Predictive Technologies (Slide 8).
- The deck omits a formal 'The Ask' slide, choosing to end on contact information and social handles instead (Slide 9).
The Narrative of Automated Intelligence
Datasembly’s pitch deck is a concise 9-slide presentation that focuses on the friction of data collection in the retail sector. In an era where 'Big Data' is often a buzzword, Datasembly narrows the scope to a very specific, high-value problem: the inability of brands and retailers to see real-time, hyper-local pricing across the entire market. The deck used for their 2020 Series A (which raised $10.3M according to catalogue facts) is notable for its minimalist design and aggressive focus on the 'Status Quo' versus the 'Solution.'
Slide 1: The Vision Statement
The title slide sets a massive scope: "The price of every product, in every store, every day." This is a classic 'North Star' statement. It doesn't describe the software; it describes the ultimate state of the world that the company intends to create. The imagery is a blurred grocery store aisle, grounding the tech company in a physical, multi-trillion-dollar industry.
Slide 2: Traction and Revenue Growth
Interestingly, Datasembly moves 'Traction' to the very front of the deck. The bar chart shows monthly revenue starting at near-zero on 1/1/2015 and growing steadily. A callout highlights a $12,000 revenue month around August 2015, with the final bar in October 2015 appearing to approach $27,000 . By leading with this, they prove that customers are already paying for a solution to the problem they haven't even described yet.
Slide 3: The Status Quo and Pain Points
This slide uses a circular image of a worker manually checking inventory on shelves to represent "Manual Data Collection." It lists four specific failures of the current system: Sparse, Unreliable, Unscalable, and Expensive. This is a highly effective way to frame the problem because it covers both the quality of the data and the business cost of acquiring it.
Slide 4: Market Sizing
The market slide is extremely simple. It features a price tag icon with a question mark and the text "Grocery, Data and Analytics: $10 BILLION." While it lacks a bottom-up breakdown (TAM/SAM/SOM), it serves its purpose of showing that the 'prize' is large enough to justify a venture-scale investment.
Slide 5: The Core Problem Statement
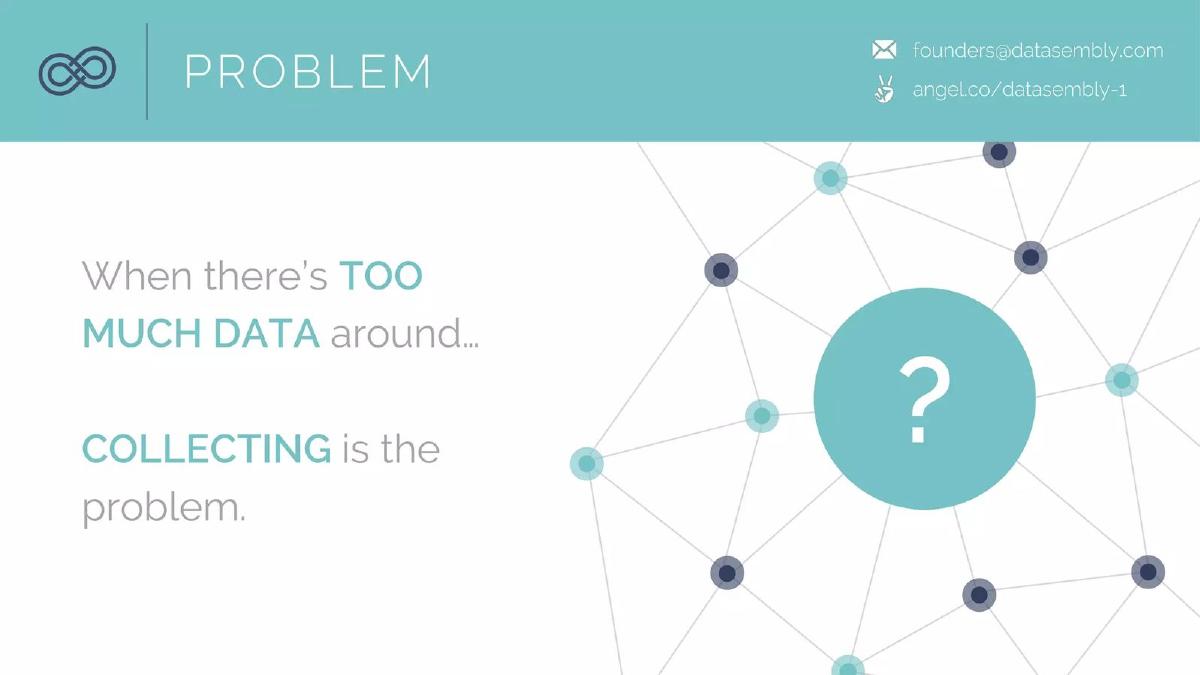
Slide 5 clarifies the technical bottleneck: "When there's TOO MUCH DATA around... COLLECTING is the problem." This distinguishes Datasembly from 'Analytics' companies that just process data. Datasembly is positioning itself as the 'Plumbing' or the 'Collection' layer, which is often a more defensible position in the data value chain.
Slide 6: The Solution and Data Sources
The solution slide is the most information-dense in the deck. It shows a map of the United States with logos for Whole Foods, Safeway, Target, A&P, Kroger, and Meijer. It illustrates 'Prices' flowing into the Datasembly logo and being output as Standardized, Scalable, Comprehensive, and Real Time data. This directly mirrors the four pain points from Slide 3, showing a perfect product-market fit.
Slide 7: Growth Markets and Horizontal Potential
To prevent investors from thinking this is 'just a grocery tool,' Slide 7 lists CPGs, Pharmaceuticals, Finance, Housing, Hospitality, and Travel. By adding an "And More" button, they signal that their data collection engine is industry-agnostic, even if their current traction is in retail.
Slide 8: The Founders
The team slide is limited to the two co-founders, Ben Reich (CEO) and Dan Gallagher (CTO). They highlight two key logos: Cornell University and APT (Applied Predictive Technologies). Given that APT was a major player in retail analytics (acquired by Mastercard), this provides the founders with immediate 'Founder-Market Fit' in the eyes of a VC.
Slide 9: Conclusion and Contact
The deck ends with a simple 'Thank You' and contact details. Notably, there is no slide detailing how much money they are raising or what the specific milestones for the next 18 months are. This suggests the deck may have been used as a teaser or as part of a presentation where the 'Ask' was delivered verbally.
What Works in This Deck
Symmetry: The way the solution (Slide 6) perfectly mirrors the problems (Slide 3) is excellent. It creates a closed loop in the investor's mind: Problem A is solved by Feature A.
Visual Simplicity: There are no walls of text. Each slide has one job and one primary takeaway. This is ideal for a deck that is meant to be presented live rather than read as a standalone document.
Focus on 'Collection': By identifying 'Collecting' as the problem on Slide 5, they avoid competing with the hundreds of 'Dashboard' or 'BI' companies. They are the source of the data, which is a much more powerful position.
What Is Missing
The Ask: There is no mention of the $10.3M Series A or how the funds will be used. For a fundraising deck, this is a significant omission that usually requires a dedicated slide on hiring, R&D, and sales expansion.
Competition: The deck ignores incumbents like Nielsen or IRI. While Datasembly’s tech might be superior, investors want to know how the company intends to displace these multi-billion-dollar legacy players.
Unit Economics: There is no mention of CAC (Customer Acquisition Cost) or LTV (Lifetime Value). While the revenue chart is nice, it doesn't show if the business is efficient or if it loses money on every data point collected.
Founder's Guide: What to Copy
The 'Status Quo' Slide: Use a real-world image of the 'old way' of doing things. It makes the problem feel visceral and human, rather than just a theoretical business inefficiency.
The Logo Strategy: Even if you don't have formal 'partnerships' with the companies listed on Slide 6, showing that your technology interacts with major brands (Target, Kroger) provides immediate scale and credibility.
The Traction Lead: If you have a growth curve as consistent as the one on Slide 2, put it at the front. It changes the investor's mindset from 'Is this possible?' to 'How big can this get?'
Frequently asked questions
- What is the primary problem Datasembly is solving?
- According to Slide 3 and Slide 5, the problem is that while there is 'too much data' around, the actual collection of hyper-local pricing data is currently manual. This manual process results in data that is sparse, unreliable, unscalable, and expensive, preventing retailers and CPGs from having a real-time view of the market.
- How does Datasembly demonstrate market validation?
- Validation is shown through two lenses: financial traction and market size. Slide 2 shows a clear upward revenue trend throughout 2015, reaching a milestone of $12,000 in mid-year and ending significantly higher. Slide 4 then anchors the opportunity in a $10 billion grocery and analytics market.
- Which industries does Datasembly target beyond retail?
- While the core focus is on grocery and CPGs, Slide 7 outlines 'Growth Markets' including Finance, Housing, Hospitality, Travel, and Pharmaceuticals. This suggests the underlying technology is a horizontal data collection engine applicable to any sector requiring real-time pricing intelligence.
- What is missing from the Datasembly pitch deck?
- The deck is remarkably lean at only 9 slides. It lacks a detailed 'Ask' slide (valuation or amount sought), a competitive landscape matrix, a deep dive into unit economics (LTV/CAC), and a product roadmap. It functions more as a high-level narrative deck than a comprehensive data room.
- Who are the founders and what is their background?
- Slide 8 identifies Ben Reich (CEO) and Dan Gallagher (CTO) as the co-founders. Their credentials include Cornell University and experience at APT (Applied Predictive Technologies), which is a well-known retail analytics firm, providing them with significant domain expertise.