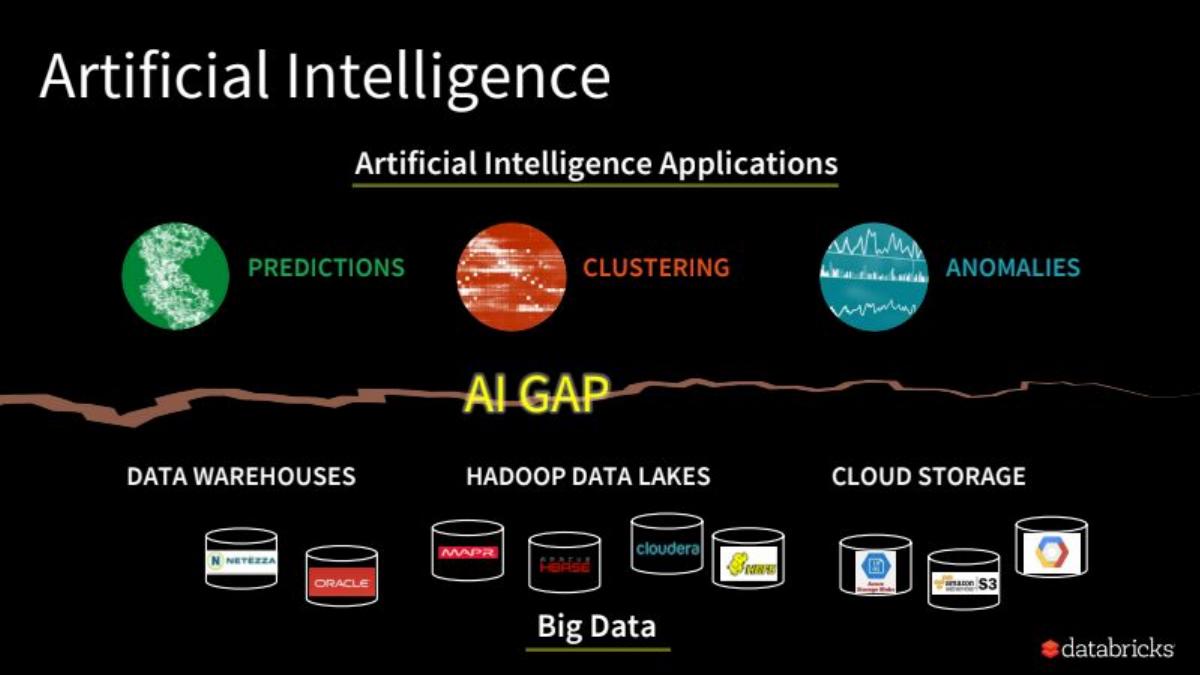
The Databricks Series D deck is a high-conviction narrative built on the foundation of open-source dominance. By 2017, the company had successfully transitioned from being the creators of Apache Spark to a commercial powerhouse with $21.9M in ARR and a 136% net dollar retention rate. The deck focuses heavily on the 'AI Gap'—the friction between big data storage and actionable machine learning—positioning Databricks as the essential bridge. With a team comprised of academic pioneers and seasoned enterprise executives from Alteryx, AppDynamics, and Tableau, the deck presents a low-risk, high-re…
Key takeaways
- Databricks reported an ARR of $21.9M as of March 31, 2017, with a staggering 248% annual growth rate (Slide 20).
- The company achieved a net dollar retention of 136%, indicating extremely strong expansion within their existing customer base (Slide 20).
- The deck identifies the 'AI Gap' as the primary market friction, sitting between data warehouses/lakes and actual AI applications (Slide 6).
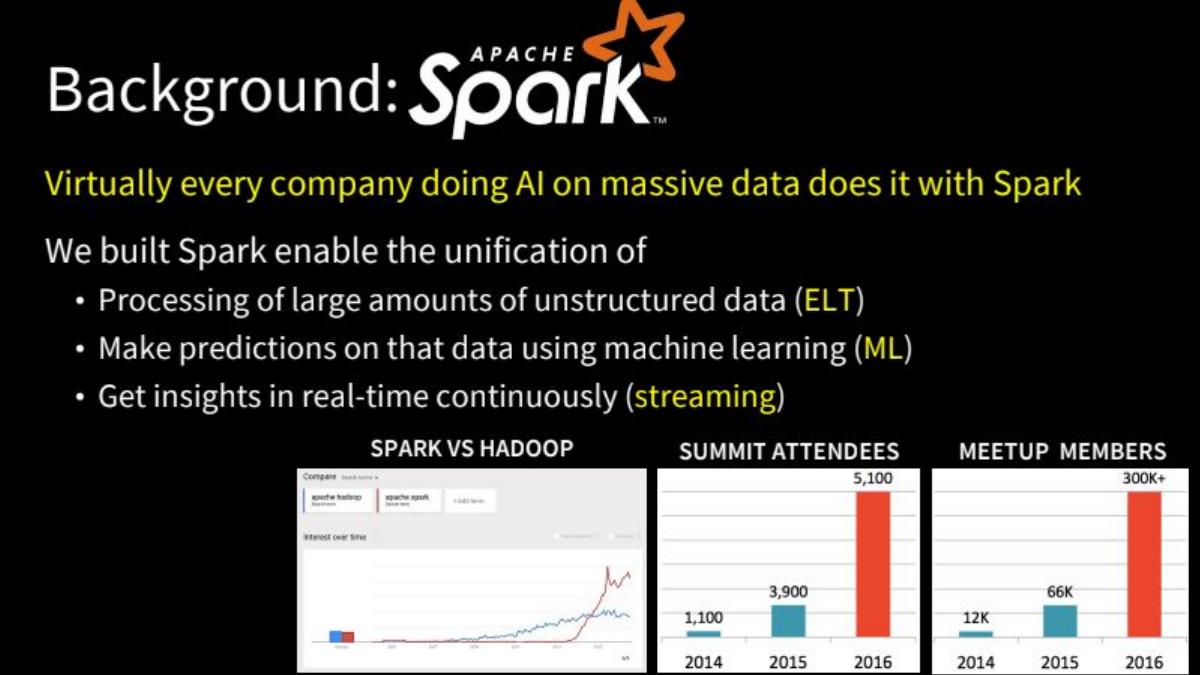
- Apache Spark's community growth is used as a proxy for market demand, showing meetup membership jumping from 66k in 2015 to over 300k in 2016 (Slide 5).
- Databricks positions itself as a cloud-agnostic 'killer app' that sits atop AWS, Azure, and Google Cloud Platform (Slide 15).
- The platform delivers significant performance gains, claiming a 10-40x speedup compared to standard Apache Spark (Slide 11).
- The team slide highlights a mix of academic founders from UC Berkeley and executives with IPO experience from companies like AppDynamics and Alteryx (Slide 22).
- The company explicitly compares its growth to the T2D3 benchmark, showing they exceeded the target ARR of $18M by reaching $25.6M in Q2 2017 (Slide 21).
Introduction: The Power of Open Source Commercialization
The Databricks Series D deck from 2017 is a masterclass in late-stage fundraising. At this stage, investors are no longer looking for just a 'good idea'; they are looking for a machine that converts capital into growth with predictable efficiency. Databricks, founded by the creators of Apache Spark, had the unique advantage of owning the most popular open-source data processing engine in the world. This deck shows how they leveraged that community dominance into a high-margin enterprise SaaS business.
Slides 1-4: The Vision and the Juggernaut
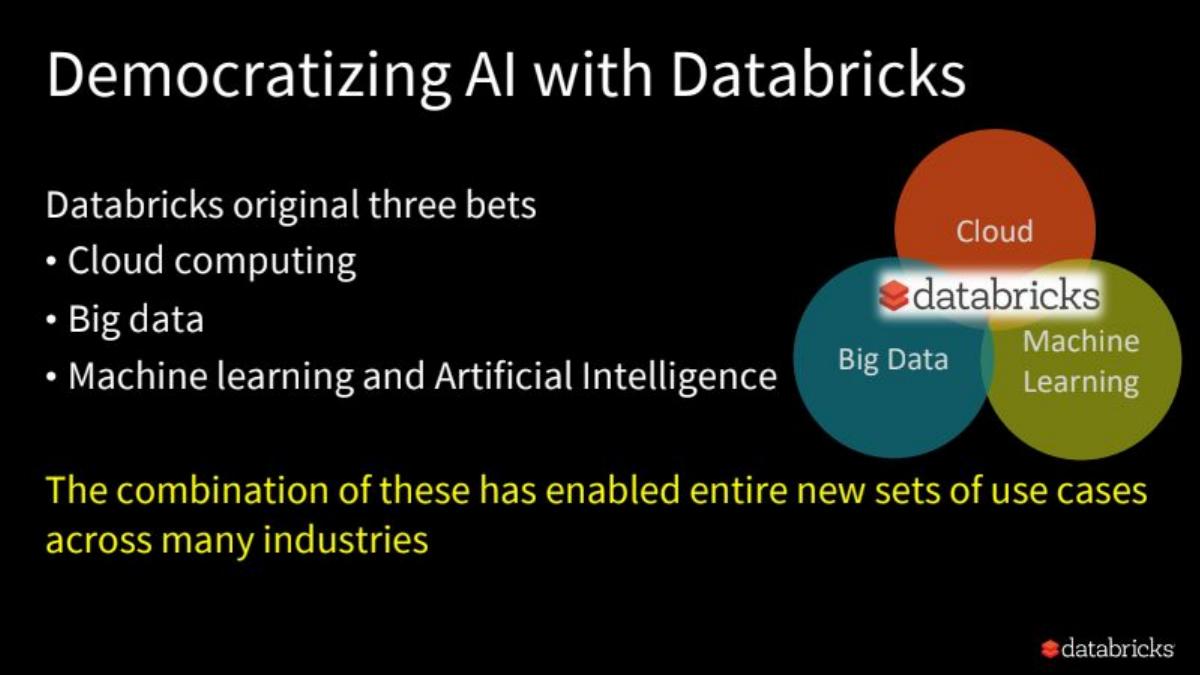
Slide 1 opens with the title 'Democratizing AI with Databricks,' presented by CEO Ali Ghodsi. The date, May 9, 2017, places this at a time when 'Big Data' was transitioning into the 'AI' era. Slide 2 outlines the company's 'original three bets': Cloud computing, Big data, and Machine learning/AI. This slide uses a Venn diagram to show Databricks at the intersection of these three massive trends, claiming this combination enables new use cases across all industries.
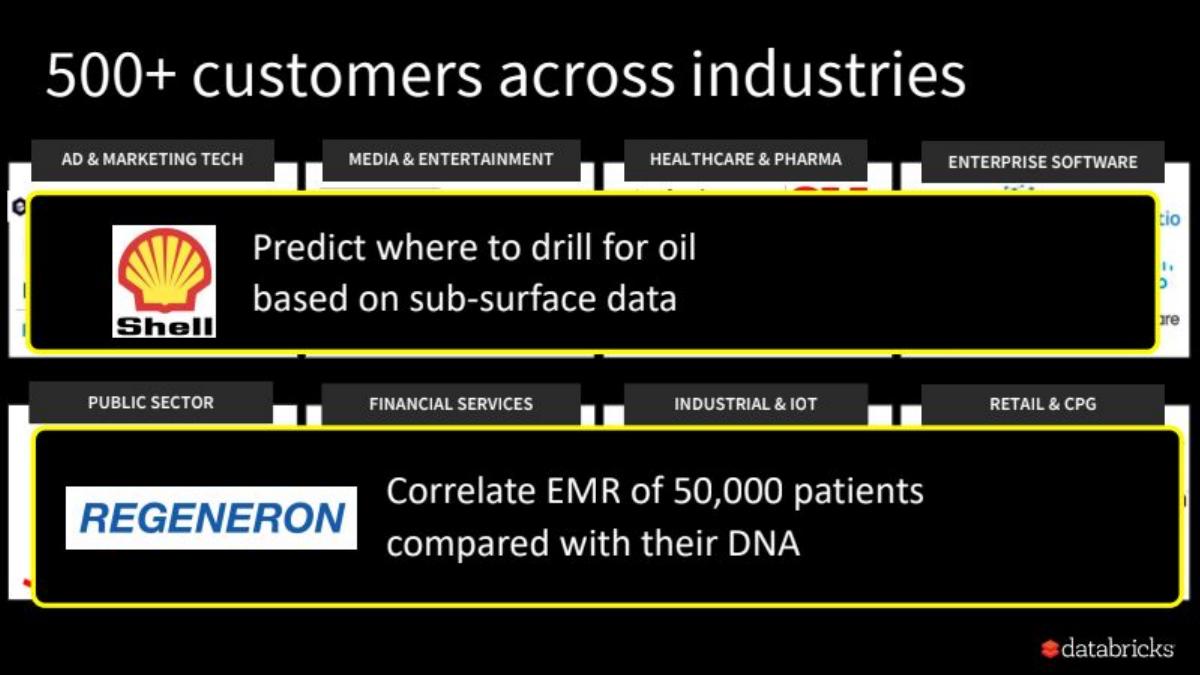
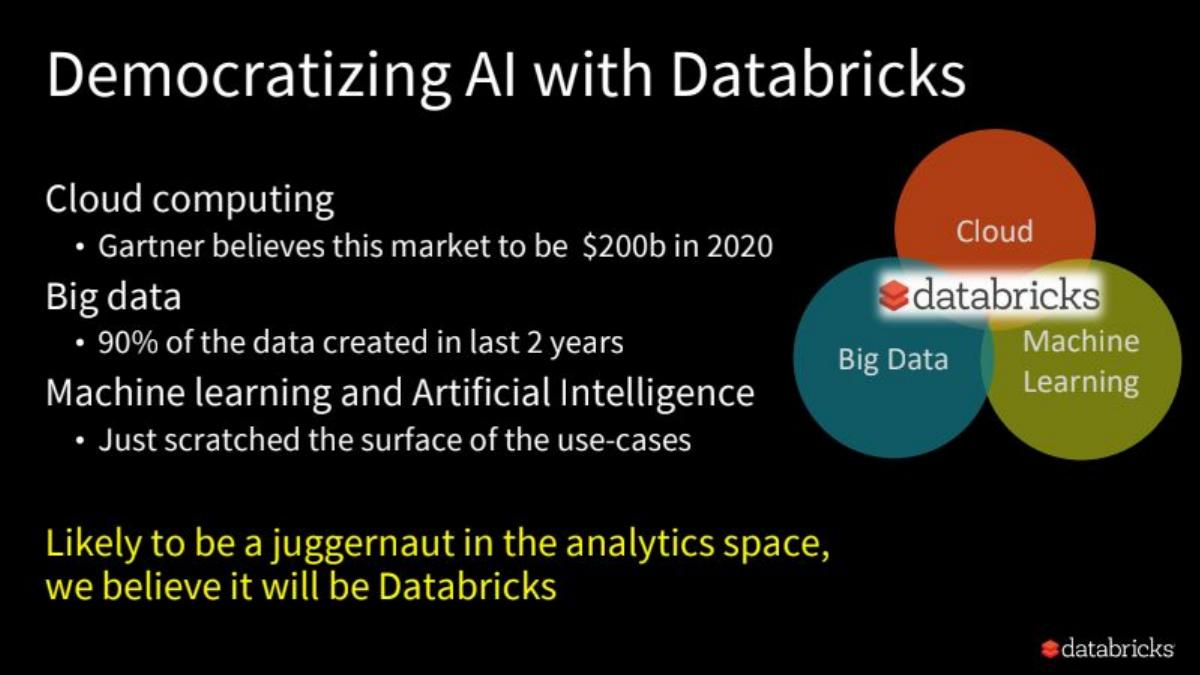
Slide 3 provides immediate social proof, stating they have '500+ customers across industries.' It highlights two specific high-value use cases: Shell using the platform to predict oil drilling locations and Regeneron correlating DNA with EMR data for 50,000 patients. This move from broad vision to specific, high-stakes enterprise applications is a strong way to build credibility early. Slide 4 reinforces the market opportunity, citing Gartner's $200b cloud market projection for 2020 and the fact that 90% of the world's data was created in the last two years. The slide concludes with a bold claim: 'Likely to be a juggernaut in the analytics space, we believe it will be Databricks.'
Slides 5-9: Defining the AI Gap
Slide 5 focuses on the 'Background' of Apache Spark. It asserts that 'Virtually every company doing AI on massive data does it with Spark.' The slide includes three charts showing explosive growth: Spark vs. Hadoop search interest, Summit attendees (growing from 1,100 in 2014 to 5,100 in 2016), and Meetup members (growing from 12k to 300k+ in the same period). This establishes Spark—and by extension, Databricks—as the industry standard.
Slide 6 introduces the core problem: the 'AI GAP.' It shows a chasm between data storage (Data Warehouses, Hadoop, Cloud Storage) and AI applications (Predictions, Clustering, Anomalies). Slide 7 quotes a 2015 Google NIPS paper, 'Hidden Technical Debt in Machine Learning Systems,' to argue that the 'hardest part of AI isn't AI'—it's the surrounding infrastructure. Slide 8 and Slide 9 conclude this section by stating that while Big Data is the missing link for AI, few companies are successful because data infrastructure is hard to manage, teams can't collaborate, and analytics are hard to put into production.
Slides 10-13: The Databricks Platform Solution
Slide 10 serves as a transition to the solution. Slide 11 introduces the 'Databricks Serverless Spark Platform,' highlighting auto-tuning, a 10-40x speedup over Apache Spark, and enterprise-grade security (SOC2 & HIPAA). This is a critical distinction; they aren't just selling Spark; they are selling a significantly faster, safer, and easier version of it. Slide 12 adds the 'Collaborative Workspace' layer, featuring Notebooks, Dashboards, and Reports. This addresses the 'collaboration' pain point mentioned earlier. Slide 13 is a simple transition slide titled 'Databricks Strategy.'
Slides 14-18: Strategic Positioning and Cloud Agnosticism
Slide 14 explains the business model: Data Science Workspace as SaaS and the Serverless Spark Platform as PaaS, all running on demand via AWS. Slide 15 is one of the most important in the deck, positioning Databricks as a 'cloud-agnostic killer app.' It shows the platform sitting on top of AWS, Microsoft Azure, and Google Cloud Platform. This signals to investors that Databricks is not tied to the fate of a single cloud provider but is instead an essential layer across the entire cloud ecosystem.
Slide 16 addresses the 'On-prem market for Spark,' noting that while storage has been commoditized, enterprises still struggle with Spark on-prem. Slide 17 summarizes the 'Unified Analytics Platform' as a layer that sits on top of cloud and on-prem storage (including YARN, Cloudera, Hortonworks, and Kubernetes). Slide 18 transitions to the 'Finance' section.
Slides 19-21: The Financial Engine
Slide 19 is a transition. Slide 20 , titled 'Great Metrics All Around,' is the 'money slide.' It lists seven key figures as of 3/31/17: ARR of $21.9M, ARR Annual Growth of 248%, Average Customer ARR of $118k (up 112% year-over-year), Net $ Retention of 136%, 69% Gross Margin, LTV:CAC of 4.1, and $56.1M in Cash. These are elite-tier SaaS metrics that justify a massive Series D valuation.
Slide 21 visualizes the 'Incredible ARR Growth' with a bar chart showing a 5x growth from Q1 16 to Q4 17 (projected). Slide 22 compares Databricks to the 'T2D3' (Triple, Triple, Double, Double, Double) growth framework. It shows that Databricks was actually beating the benchmark, reaching $25.6M in Q2 17 against a T2D3 target of $18M. This slide is designed to remove any doubt about the company's growth trajectory.
Slides 22-24: The Team and The Close
Slide 22 (misnumbered in the sequence but titled 'The Team') showcases a high-pedigree leadership group. It includes Ali Ghodsi (CEO/Co-founder), Ron Gabrisko (CRO, ex-Cyclone), Rick Schultz (CMO, ex-Alteryx), John Winkenbach (SVP Finance, ex-Jobvite), Hatim Shafique (CCO, ex-AppDynamics), Patrick Wendell (VP Engineering/Co-founder), and Michael Hoff (SVP BD, ex-Tableau/MSFT). The mix of academic founders and 'hired gun' executives with IPO experience is a strong signal for a late-stage round. Slide 23 and Slide 24 are a call to action to try the platform and a 'Thank You' slide.
What Works in the Databricks Deck
The deck's greatest strength is its inevitability narrative . By starting with the massive community growth of Apache Spark, Databricks frames itself not as a startup trying to find a market, but as the commercial steward of a market that has already arrived. The 'AI Gap' problem is well-defined and creates a logical vacuum that only their 'Unified Analytics Platform' can fill.
The financial transparency on Slide 20 is also exceptional. Providing Net Dollar Retention (136%) and LTV:CAC (4.1) alongside raw ARR growth gives investors a complete picture of the business's health. The 136% retention rate is particularly powerful, as it proves that once an enterprise starts using Databricks, they don't just stay—they spend significantly more every year.
Finally, the T2D3 comparison is a brilliant piece of psychological anchoring. By measuring themselves against the gold standard of venture-backed growth and showing they are exceeding it, they make the investment seem like a 'safe bet' for a Series D investor looking for a clear path to an IPO.
What is Missing from the Databricks Deck
The most glaring omission is a Competitor Slide . While they mention Hadoop and Cloudera in the context of storage, they don't explicitly address other analytics platforms or the native tools being built by AWS and Google. At Series D, investors usually want to know how a company will defend its margins against incumbents. Databricks likely felt their open-source moat was sufficient, but a teardown must note the lack of a formal competitive matrix.
There is also no Use of Funds slide. While $140M is a large sum, the deck doesn't specify if this capital is for international expansion, R&D for new products, or an aggressive sales and marketing push. In late-stage decks, this is sometimes omitted if the 'why' is obvious (scaling what already works), but it remains a missing piece of the strategic puzzle.
Lastly, the deck is design-heavy on text and light on product visuals . There are no screenshots of the 'Collaborative Workspace' or the 'Notebooks' mentioned on Slide 12. For a platform that claims to 'democratize' AI through ease of use, showing the interface would have been a strong addition.
What Founders Should Copy
The 'Problem as a Gap' Framework: Slide 6 is a perfect example of how to visualize a market opportunity. By showing two established islands (Storage and Apps) and a chasm in between, you make your product's necessity self-evident. · Community as a Proxy for Demand: If you have an open-source component, use community metrics (Slide 5) to prove market pull before you even show your revenue. It proves that the 'world' has already chosen your technology. · Benchmark Comparison: Don't just show your growth; compare it to a recognized standard like T2D3 (Slide 21). It provides context and makes your numbers more impressive. · Pedigree Pairing: Notice how Slide 22 pairs the technical founders with executives who have 'pre-revenue to IPO' experience. This tells investors the company has the brains to build the tech and the hands to build the business. · Specific Use Cases: Instead of saying 'we work for everyone,' Slide 3 names Shell and Regeneron and describes exactly what they do. This makes the abstract concept of 'Unified Analytics' concrete and valuable.
Frequently asked questions
- What was the primary value proposition of Databricks in this deck?
- The primary value proposition was 'Democratizing AI' by bridging the gap between massive data storage and machine learning applications. Databricks positioned itself as the commercial, enterprise-grade version of Apache Spark, offering a unified platform that simplified data engineering, collaborative science, and production-grade deployment. They emphasized a 10-40x performance increase over open-source Spark and full enterprise governance.
- How did Databricks demonstrate market traction?
- Traction was demonstrated through three lenses: community, customer logos, and financial metrics. They showed the explosive growth of the Apache Spark ecosystem (300k+ meetup members), highlighted 500+ enterprise customers including Shell and Regeneron, and provided hard SaaS metrics like 248% ARR growth and 136% net dollar retention. This multi-layered approach proved both market interest and commercial viability.
- Why did the deck focus so much on the 'AI Gap'?
- The 'AI Gap' (Slide 6) served as the 'Problem' slide. It illustrated that while companies had invested heavily in data warehouses and Hadoop data lakes, they were failing to extract value through predictions or clustering. By defining this gap, Databricks created a clear need for their 'Unified Analytics Platform' as the only solution capable of connecting raw data to business outcomes.
- What was the significance of the T2D3 slide?
- The T2D3 slide (Slide 21) is a classic venture capital benchmark for 'world-class' SaaS growth (Triple, Triple, Double, Double, Double). By showing that Databricks was actually outperforming this aggressive growth curve—reaching $25.6M ARR when the benchmark was $18M—they signaled to Series D investors that they were a top-tier, outlier investment with predictable scaling mechanics.
- What is missing from this pitch deck?
- Notably missing are a detailed 'Ask' slide (specifying the exact amount and terms) and a 'Use of Funds' slide. At Series D, these details are often handled in the data room or through verbal negotiations with lead investors like Andreessen Horowitz. The deck also omits a detailed competitive landscape, likely because they viewed themselves as the category creators for unified analytics.