DataCamp’s April 2015 investor deck serves as a focused roadmap for a verticalized EdTech platform. At a time when massive open online courses (MOOCs) like Coursera and Udacity were pursuing broad horizontal catalogs, DataCamp doubled down on the 'sexy job' of the decade: data science. The deck highlights a significant talent shortage, with median incomes for data scientists reaching up to $144k (Slide 2). With 120,000 registered users and a 30% course completion rate—far exceeding industry averages for online learning—the company demonstrated strong product-market fit. While the deck lacks e…
Key takeaways
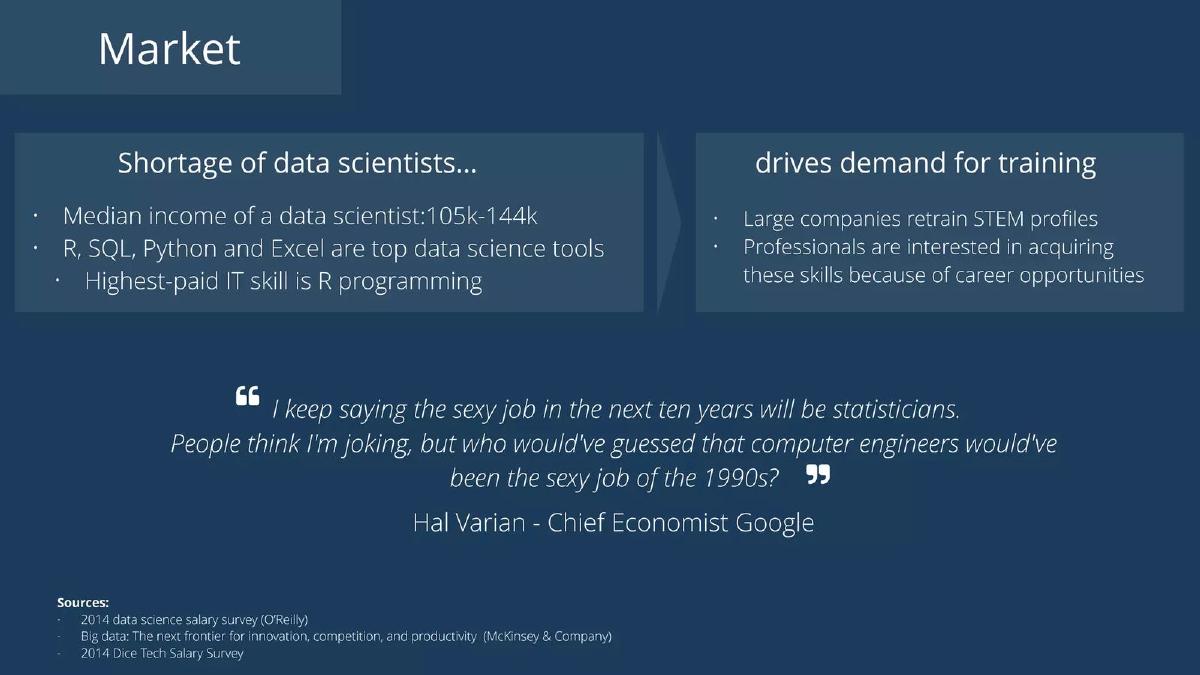
- DataCamp identifies R programming as the highest-paid IT skill to justify their curriculum focus (Slide 2).
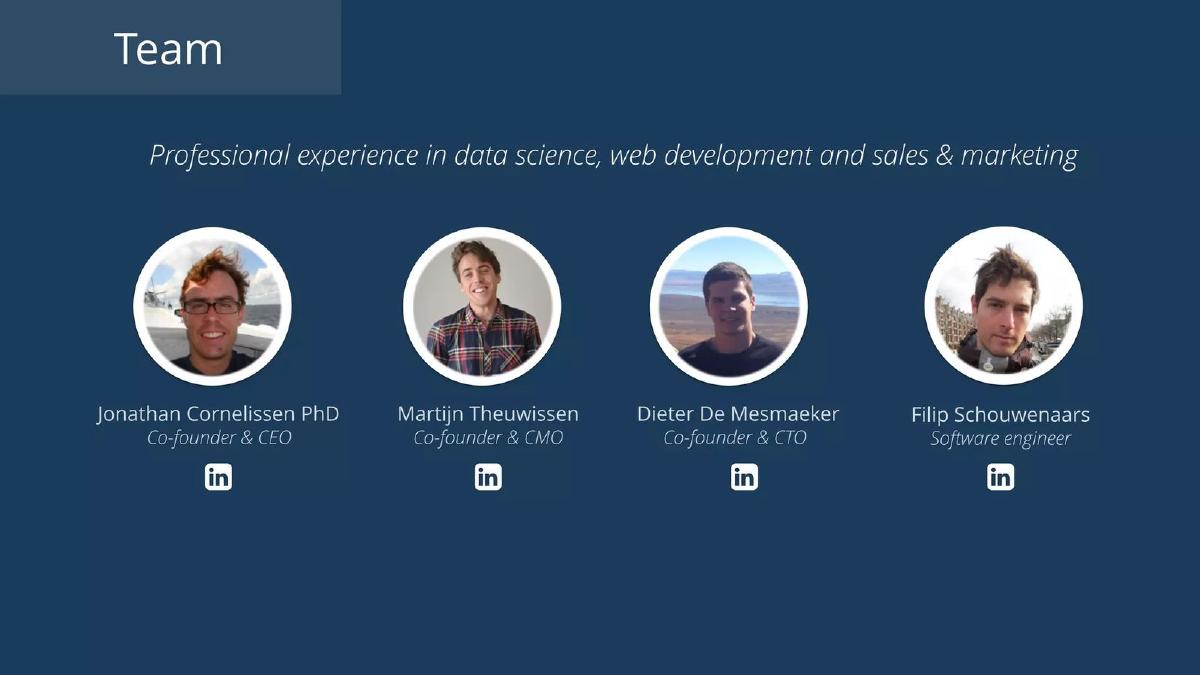
- The team slide emphasizes a blend of academic credentials (PhD) and technical execution (Slide 3).
- Traction is anchored by a massive user base of 120,000+ registered users as of Q1 2015 (Slide 4).
- A 30% course completion rate is presented as a key engagement metric, contrasting with typical low MOOC completion rates (Slide 4).
- The deck reports a Net Promoter Score of 60, indicating high user satisfaction (Slide 4).
- Approximately 2% of the user base converts to paid accounts, providing a baseline for their freemium model (Slide 4).
- Competitive positioning places DataCamp alone in the high-interaction, high-data-science-focus quadrant (Slide 5).
- The deck lists funding and acquisition data for competitors, such as Lynda.com's $1.5B acquisition, to signal market heat (Slide 5).
The Power of Verticalization in EdTech
The DataCamp investor deck from April 2015 is a quintessential example of a 'niche-down' strategy. In a period where the education technology sector was obsessed with scale and broad course catalogs, DataCamp focused on the specific, high-value problem of the data science talent gap. This teardown examines how they used specific metrics and competitive mapping to convince investors that being the best at one thing was better than being average at everything.
Slide 1: Title and Contact
The deck opens with a clean, minimalist title slide. It features the DataCamp logo—a head with a gear inside a shield—and provides direct contact information for Jonathan Cornelissen. Notably, it includes links to a Techstars Demo Day pitch and a live demo. This suggests the deck was used as a follow-up to a public presentation, where the goal was to move from a high-level pitch to a deeper due diligence conversation.
Slide 2: Market Opportunity
DataCamp frames the market not just as 'education,' but as a solution to a labor shortage. Slide 2 highlights that the median income of a data scientist is between $105k and $144k. By identifying R, SQL, Python, and Excel as the 'top data science tools,' they define their curriculum's boundaries. The inclusion of a quote from Hal Varian, Chief Economist at Google, adds significant social proof, framing data science as the 'sexy job' of the decade. This slide effectively argues that the demand for training is driven by professionals seeking high-paying career opportunities and large companies needing to retrain STEM profiles.
Slide 3: The Team
The team slide ( Slide 3 ) presents a four-person core. Jonathan Cornelissen is highlighted as having a PhD, which is critical for an education company focused on a highly technical field like data science. The roles are clearly divided among marketing (Martijn Theuwissen), technology (Dieter De Mesmaeker), and engineering (Filip Schouwenaars). The slide claims 'Professional experience in data science, web development and sales & marketing,' covering the three pillars necessary for a SaaS-based education platform to scale.
Slide 4: Traction and Engagement
This is the strongest slide in the deck. Slide 4 shows a bar chart of registered users growing from near zero in Q3 2013 to over 120,000 by Q1 2015. However, the secondary metrics are even more compelling:
4.6MM exercises completed: Demonstrates high platform utility. · 30% course completion rate: This is a massive outlier in EdTech, where MOOC completion rates often hover below 10%. · 60 Net Promoter Score: Indicates strong organic word-of-mouth potential. · ~2% conversion to paid: Provides a clear, albeit conservative, revenue baseline for their freemium model.
Slide 5: Positioning and Competition
Slide 5 uses a standard 2x2 matrix but adds a unique 'Total funding' sidebar. By listing the massive funding rounds and acquisitions of competitors—such as Lynda.com's $1.5B acquisition and Coursera's $85M raise—DataCamp signals to investors that this is a high-exit-value space. They position themselves in the top-right quadrant: the only player that is both highly interactive and exclusively focused on data science. This 'white space' strategy is a classic way to justify why a new player can win against entrenched, better-funded incumbents.
Slide 6: Closing and Social
The final slide repeats the contact information but adds a Twitter handle (@datacampcom). It serves as a simple bookend to the presentation, maintaining the professional and focused tone established in the previous slides.
What Works in This Deck
Specificity of Metrics: DataCamp doesn't just talk about 'users.' They talk about exercise completions and completion rates. In EdTech, engagement is the leading indicator of long-term retention and monetization. By highlighting a 30% completion rate, they prove their 'interactive learning' hook isn't just a marketing buzzword—it actually works. Market Validation: Using salary data (Slide 2) to justify the product is brilliant. It shifts the conversation from 'learning is good' to 'learning this specific skill leads to a $140k salary.' This makes the product feel like an investment with a clear ROI for the user, which in turn makes the business model feel more robust to an investor. Competitive Context: The 'Total funding' list on Slide 5 is a bold move. It tells the investor, 'Our competitors are worth billions or have raised hundreds of millions; we are the specialized version of them.' It frames DataCamp as a high-upside opportunity in a proven category.
What Is Missing
The Business Model Details: While Slide 4 mentions a 2% conversion to paid, the deck does not explain the pricing tiers, enterprise vs. individual splits, or Average Revenue Per User (ARPU). Investors would need to know if that 2% is paying $10/month or $500/year to understand the scale of the revenue. Financial Projections: There are no forward-looking financial statements or 'burn' metrics. The deck shows where they have been, but not exactly where they are going in terms of headcount or revenue targets over the next 18-24 months. The Ask: The provided slides do not include a specific funding request. We don't know how much they were raising in April 2015 or what they intended to do with the capital (e.g., hire more content creators, expand into Python faster, or build an enterprise sales team). Unit Economics: There is no mention of Customer Acquisition Cost (CAC) or Lifetime Value (LTV). Given the 2% conversion rate, understanding how much it costs to acquire those 120,000 free users is vital to determining if the business is sustainable.
What You Should Copy
The 'White Space' Matrix: If you are entering a crowded market, do exactly what DataCamp did on Slide 5. Don't just list features; find the two axes that matter most to your specific users and show that you are the only one at that intersection. The Engagement-First Traction Slide: If your revenue is still early, lead with engagement. DataCamp's '4.6MM exercises completed' is a vanity metric that actually means something—it shows the product is 'sticky.' If you can prove people use your product more than the industry average, you can always figure out how to charge them later. Macro-Trend Alignment: Align your startup with a 'sexy' macro trend. DataCamp didn't just say they teach coding; they aligned themselves with the 'Data Science' revolution and backed it up with salary data and expert quotes. This makes your success feel inevitable because it is tied to a larger market shift.
Frequently asked questions
- What is DataCamp's core value proposition according to the deck?
- DataCamp positions itself as the premier interactive learning platform specifically for data science. Unlike broad platforms, they focus on high-demand skills like R, SQL, and Python. Slide 2 emphasizes the shortage of data scientists and the high salaries associated with these skills, suggesting that DataCamp is the most efficient bridge for professionals looking to transition into these lucrative roles.
- How does DataCamp differentiate itself from competitors like Coursera or Codecademy?
- On Slide 5, DataCamp uses a 2x2 matrix to plot 'Interactive learning' against 'Focus on data science.' They place Codecademy and Duolingo high on interactivity but low on data science focus, while Coursera and Udacity are high on data science but lower on interactivity. DataCamp claims the top-right quadrant, offering the best of both worlds: specialized content delivered through an engaging, hands-on interface.
- What are the key engagement metrics shared in the traction slide?
- Slide 4 highlights several impressive engagement figures: 4.6 million exercises completed, a 30% course completion rate, and a Net Promoter Score (NPS) of 60. Additionally, they show strong retention with 60% of visitors being returning users. These metrics are designed to prove that their interactive model actually keeps students learning longer than traditional video-based platforms.
- Who were the key members of the founding team in 2015?
- The team consisted of Jonathan Cornelissen (PhD, Co-founder & CEO), Martijn Theuwissen (Co-founder & CMO), and Dieter De Mesmaeker (Co-founder & CTO), supported by software engineer Filip Schouwenaars. The slide emphasizes their collective experience in data science, web development, and sales, providing a balanced mix of academic authority and technical capability.
- What market data does DataCamp use to justify its existence?
- Slide 2 cites a 'Shortage of data scientists' and notes that median incomes range from $105k to $144k. They also reference a quote from Google's Chief Economist, Hal Varian, predicting that statisticians would have the 'sexy job' of the next ten years. By citing sources like O'Reilly and McKinsey, they ground their business model in macroeconomic trends rather than just speculation.