Databook’s 2020 Seed deck is a masterclass in category positioning. Rather than competing directly with crowded CRM or sales enablement markets, the company frames itself as a new layer: Enterprise Customer Intelligence. The deck leans heavily on qualitative validation from C-level executives and a compelling visual representation of their 'Land and Expand' model. While it lacks traditional financial tables and a specific 'Ask' slide, the strength of its Net Dollar Retention (NDR) claims—stated as 1.5x the industry average—clearly signaled product-market fit to investors. The narrative moves…
Key takeaways
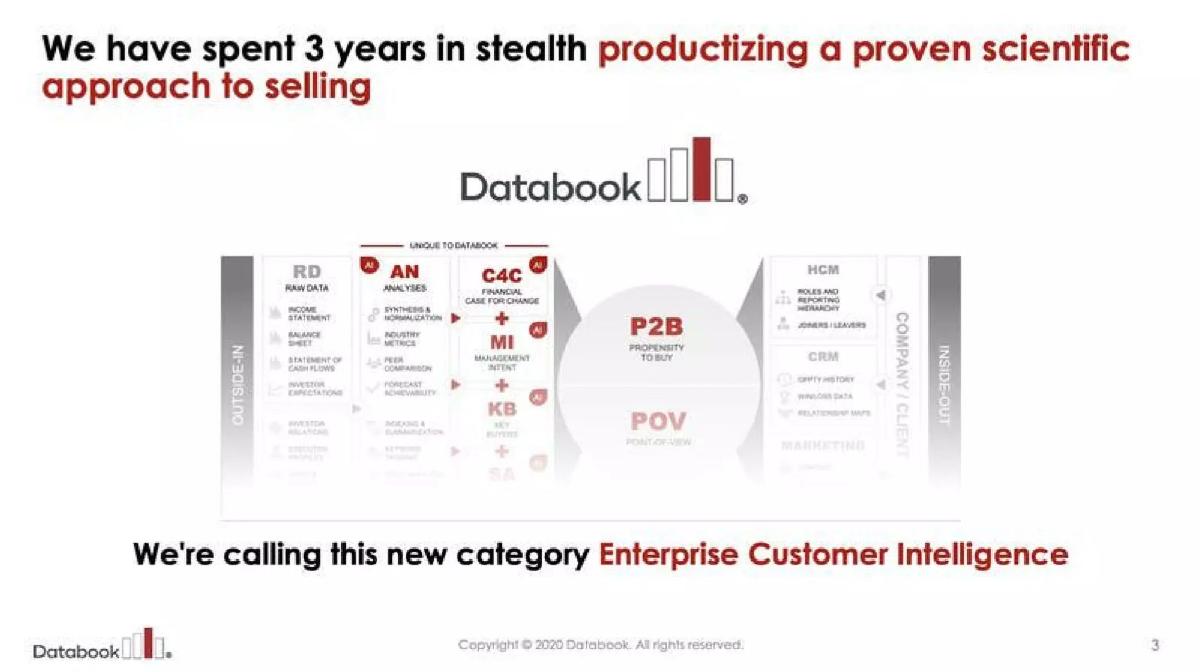
- The deck explicitly attempts to create a new category called 'Enterprise Customer Intelligence' rather than competing in existing buckets (Slide 3).
- Databook claims a Net Dollar Retention Rate that is 1.5x the industry average, visualized through a bubble chart of customer expansions (Slide 9).
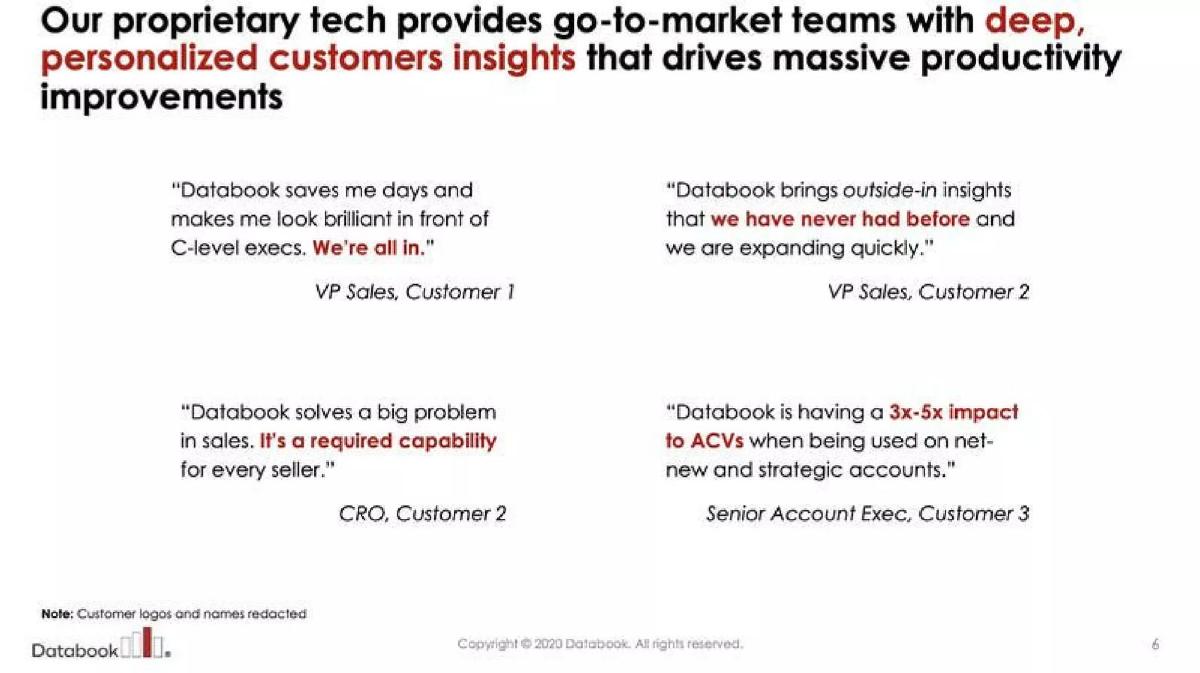
- The platform is positioned as a way to increase Annual Contract Value (ACV) by 3x to 5x on strategic accounts (Slide 6).
- The Total Addressable Market (TAM) for the Americas alone is segmented into a $6B opportunity across Enterprise, Commercial, and SMB tiers (Slide 10).
- The company spent three years in stealth mode to productize what they call a 'scientific approach to selling' (Slide 3).
- The deck lacks a specific funding ask or a breakdown of how the $5M Seed capital would be allocated.
- Customer validation is provided through redacted C-suite testimonials rather than a logo wall, emphasizing the depth of executive-level impact (Slide 6).
- The team slide features 10 individuals, including two co-founders, but omits their professional histories or previous company exits (Slide 13).
Introduction: The Category Creation Play
Databook’s 2020 Seed deck, which secured $5M in funding, is a focused narrative on the evolution of enterprise sales. The deck does not lead with a problem-solution framework in the traditional sense; instead, it leads with a shift in market dynamics. By January 2020, the sales tech stack was already crowded with CRM extensions and lead-gen tools. Databook’s strategy was to rise above the noise by defining a new category: Enterprise Customer Intelligence. This teardown examines how they used stealth-mode development and high retention metrics to justify a $5M Seed round.
The Narrative Foundation (Slides 1-3)
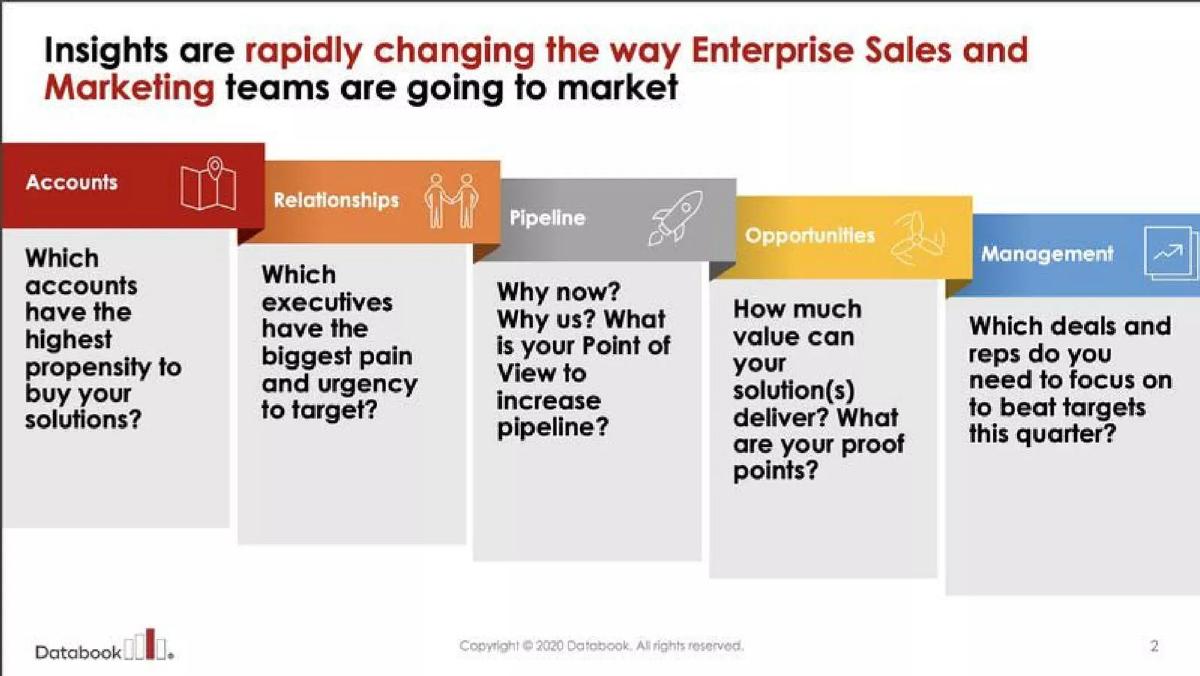
Slide 1 is a standard title slide, identifying the company as a 'Customer Intelligence Platform.' The imagery of a professional handshake reinforces the enterprise focus. Slide 2 introduces the 'Why Now' by illustrating how insights are changing the GTM (Go-To-Market) process. It breaks the sales funnel into five stages: Accounts, Relationships, Pipeline, Opportunities, and Management. Each stage is paired with a critical question, such as 'Which accounts have the highest propensity to buy?' and 'Which executives have the biggest pain?' This sets the stage for a tool that answers these questions systematically.
Slide 3 is the 'Stealth' reveal. The company claims to have spent three years productizing a 'proven scientific approach to selling.' This is a high-conviction statement intended to explain why a Seed-stage company already has a complex product architecture. The slide introduces the term 'Enterprise Customer Intelligence' in bold red text, signaling that this isn't just a tool, but a new way of working. The central graphic, though somewhat cluttered, shows an 'Outside-In' vs. 'Inside-Out' data flow, positioning Databook as the bridge between raw market data and internal CRM/HCM systems.
Product and Value Proposition (Slides 4-6)
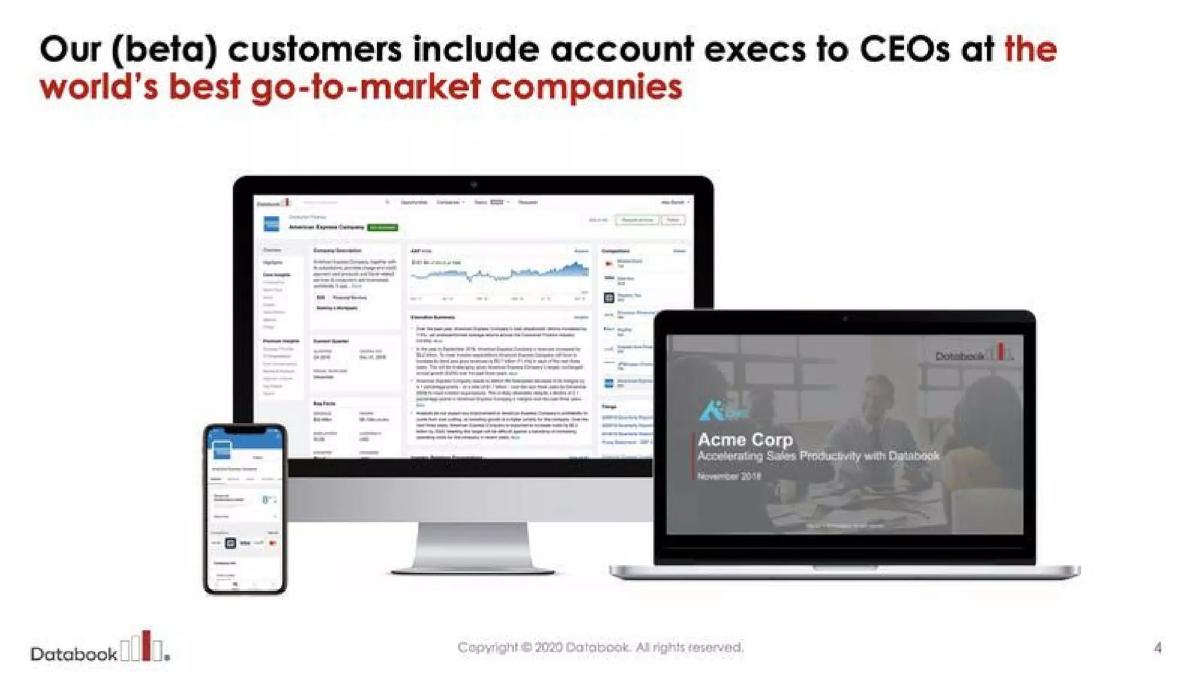
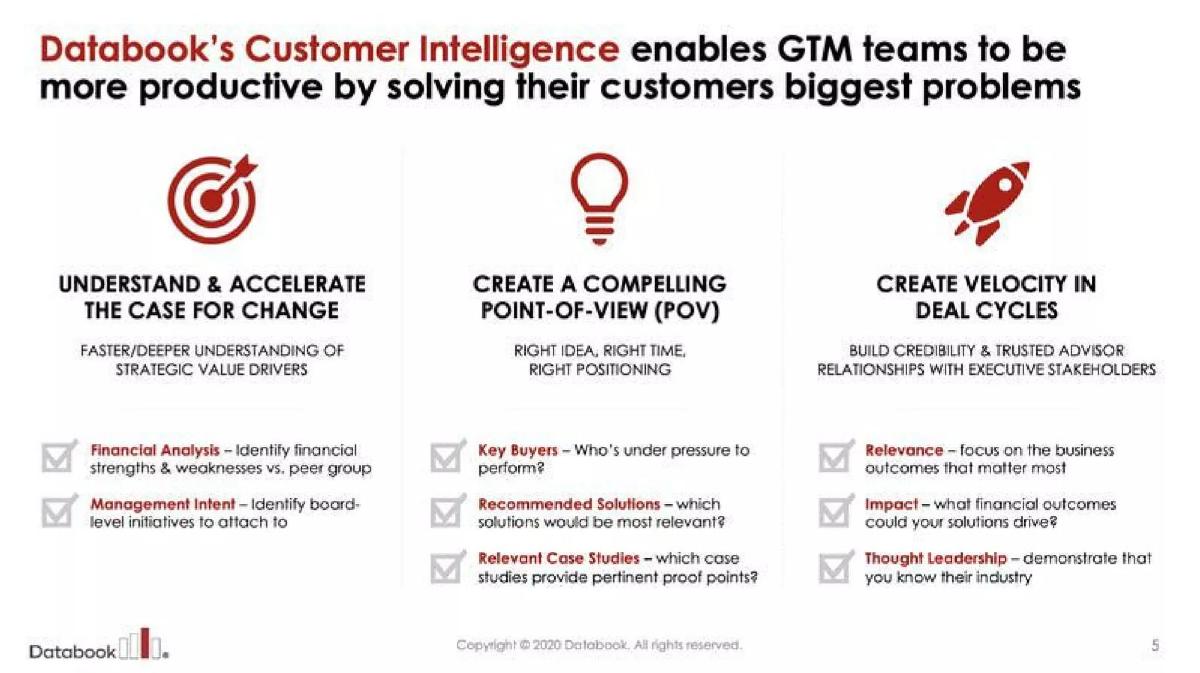
Slide 4 shows the product interface across desktop, tablet, and mobile. Notably, it mentions '(beta) customers' including account execs and CEOs, suggesting the tool has utility across the entire hierarchy. Slide 5 dives into the 'How.' It categorizes the platform’s utility into three buckets: Understanding the Case for Change, Creating a Compelling POV, and Creating Velocity. The use of checkmarks next to features like 'Financial Analysis' and 'Management Intent' suggests a completed, robust feature set rather than a roadmap.
Slide 6 is one of the most effective slides in the deck. Instead of a standard logo wall (which might have been restricted due to NDAs), Databook uses 'redacted' customer testimonials. The quotes are high-impact: one VP of Sales says they are 'all in,' and a Senior Account Exec claims a '3x-5x impact to ACVs.' For a Seed investor, seeing that a tool can triple the size of a deal is a powerful motivator. The note at the bottom confirms that logos and names were redacted, which adds an air of 'enterprise-grade' secrecy to the proceedings.
Technical Architecture and Data Strategy (Slides 7-8)
Slide 7 attempts to visualize the 'Decades of enterprise selling experience' baked into the platform. It shows a layered cylinder representing the tech platform, intelligence engine, and strategy layer, integrated with Slack, PPT, CRM, and Web. This slide is meant to reassure investors that the product is not a silo but a deeply integrated part of the existing workflow. Slide 8 lists six 'unique' sets of proprietary data, including an 'Intent Graph' and 'Sales Methodology.' While the slide notes that 'Detailed definitions [are] redacted,' the icons serve as placeholders for a deeper technical due diligence conversation.
Traction and Market Opportunity (Slides 9-10)
Slide 9 is the 'Money Slide.' It visualizes Net Dollar Retention (NDR) through a bubble chart. Each row represents a customer, and the size of the bubble represents their spend over time. The chart shows clear 'Land and Expand' behavior, with Customer 1 growing significantly from Q4 FY17 to Q3 FY19. The headline claim—that NDR is 1.5x the industry average—is a massive signal of product-market fit. Even without showing raw revenue numbers, this visualization proves that once an enterprise buys Databook, they buy more of it.
Slide 10 addresses the Total Addressable Market (TAM). Databook calculates a $6B opportunity in the Americas alone. They intelligently segment this into Enterprise (~$1B), Commercial (~$2B), and SMB (~$3B). By highlighting the Enterprise tier as their 'near-term focus,' they demonstrate a disciplined go-to-market strategy. They aren't trying to boil the ocean; they are targeting 5,500 high-value accounts first. The note at the bottom defines TAM as '# of accounts x ACV,' providing transparency into their math.
Competitive Landscape and GTM Strategy (Slides 11-12)
Slide 11 is the competitive positioning slide. Rather than a standard 'X vs. Y' feature grid, Databook uses three circles representing Account Based Marketing, Sales Intelligence, and Sales Enablement. They place themselves above these circles, stating that 'Enterprise Customer intelligence has never been done at scale.' By framing competitors as 'point solutions,' they position Databook as the overarching intelligence layer. Slide 12 illustrates their repeatable GTM approach as an infinity loop, moving from Lead Gen to Proof of Concept, Land, In-Year Expansion, Enterprise Wide, and Customer Success. This reinforces the 'Land and Expand' narrative from slide 9.
Team and Mission (Slides 13-14)
Slide 13 introduces the team. It features 10 headshots, led by Co-founders Anand Shah (CEO) and Alex Barrett (CPO). While the slide is clean, it is missing the 'pedigree' markers usually found in successful Seed decks—there are no logos of previous companies (e.g., 'Ex-Google' or 'Ex-Salesforce') and no short bios. For a $5M round, investors usually want to see the specific 'right to win' of the founding team. Slide 14 is a simple closing slide with the company logo and website.
What Works in This Deck
The NDR Visualization: Slide 9 is the strongest piece of evidence in the deck. It moves beyond 'we have customers' to 'our customers grow with us,' which is the holy grail for SaaS investors. · Category Positioning: By refusing to be labeled as 'Sales Enablement,' Databook avoids the downward price pressure and high churn associated with that crowded market. · Executive Validation: The testimonials on Slide 6 focus on C-suite impact. In enterprise software, if the CRO and VP of Sales say the tool is 'required,' the deal is much easier to close. · Clear TAM Segmentation: Slide 10 shows a sophisticated understanding of their market, acknowledging that while SMB is a large dollar opportunity, the Enterprise tier is the strategic starting point.
What Is Missing
The Ask: There is no slide stating how much money is being raised, the valuation target, or the specific milestones the $5M will help them achieve. · Founder Pedigree: Slide 13 is a 'who's who' of faces but lacks the 'why them' of their professional backgrounds. In a Seed round, the team is often 50% of the investment decision. · Unit Economics: While NDR is mentioned, there is no mention of Customer Acquisition Cost (CAC), LTV/CAC ratios, or gross margins, which are standard for a Seed-stage SaaS deck. · Case Studies: The deck mentions 'Relevant Case Studies' on slide 5, but does not actually present one. A single slide detailing a specific customer journey from 'Land' to 'Enterprise-wide' would have added significant weight.
What a Founder Should Copy
The 'Why Now' Funnel: Use Slide 2's approach of mapping your solution to specific questions at every stage of the customer journey. It proves you understand the user's daily pain. · The Redacted Testimonial: If you have big enterprise customers but can't name them yet, use the Slide 6 format. Focus on the result (e.g., 3x ACV) rather than just the feature. · The Expansion Bubble Chart: If your retention is strong, copy the layout of Slide 9. It is a much more intuitive way to show growth than a standard line graph or a table of numbers. · Stealth Narrative: If you have been building for a long time before raising, use the 'productizing a proven scientific approach' angle from Slide 3 to justify why you are 'Seed' in stage but 'Series A' in product maturity.
Frequently asked questions
- What is the primary value proposition of Databook according to the deck?
- Databook positions itself as a 'Customer Intelligence Platform' that helps Go-To-Market (GTM) teams increase productivity. Specifically, slide 5 highlights three core pillars: understanding the 'case for change' through financial analysis, creating a compelling point-of-view for buyers, and creating velocity in deal cycles by building credibility with executive stakeholders.
- How does Databook justify its market size?
- On slide 10, the company presents a tiered TAM for the Americas totaling $6 billion. They break this down into Enterprise (~$1B from 5,500 accounts), Commercial (~$2B from 55k accounts), and SMB (~$3B from 850k accounts). They note that their near-term focus is exclusively on the Enterprise tier, specifically in Tech, Finance, and Life Sciences.
- What evidence of traction is provided in the 2020 Seed deck?
- Traction is demonstrated primarily through retention and expansion metrics rather than raw revenue figures. Slide 9 shows a 'Land and Expand' chart for six customers over ten quarters, claiming a Net Dollar Retention (NDR) rate 1.5x higher than the industry average. Slide 6 adds qualitative weight with a quote stating a 3x-5x impact on ACVs.
- How does Databook differentiate itself from competitors like LinkedIn or ZoomInfo?
- Slide 11 addresses this by grouping existing players into 'Account Based Marketing,' 'Sales Intelligence,' and 'Sales Enablement.' Databook argues these are 'point solutions focused on a narrow area,' whereas their 'Enterprise Customer Intelligence' platform provides a holistic, scaled approach that has 'never been done at scale' before.
- What is missing from this pitch deck that investors usually expect?
- The deck is notably missing a slide detailing the specific investment 'Ask' (how much they are raising and on what terms) and a 'Use of Funds' slide. Additionally, while the team is shown on slide 13, there are no bios or logos of former employers, which is unusual for a Seed round where founder pedigree is a primary filter.