Darling International’s 2012 Investor and Analyst Forum deck is a comprehensive 104-slide document detailing the company's evolution from a traditional rendering business to a diversified green energy and recycling leader. The presentation focuses heavily on the Diamond Green Diesel (DGD) joint venture, which is projected to consume over 1.1 billion pounds of fats and greases annually (Slide 11). The deck provides a rare level of transparency for a public company, including a detailed balance sheet showing $1.479 billion in total assets as of Q2 2012 (Slide 55) and a granular breakdown of the…
Key takeaways
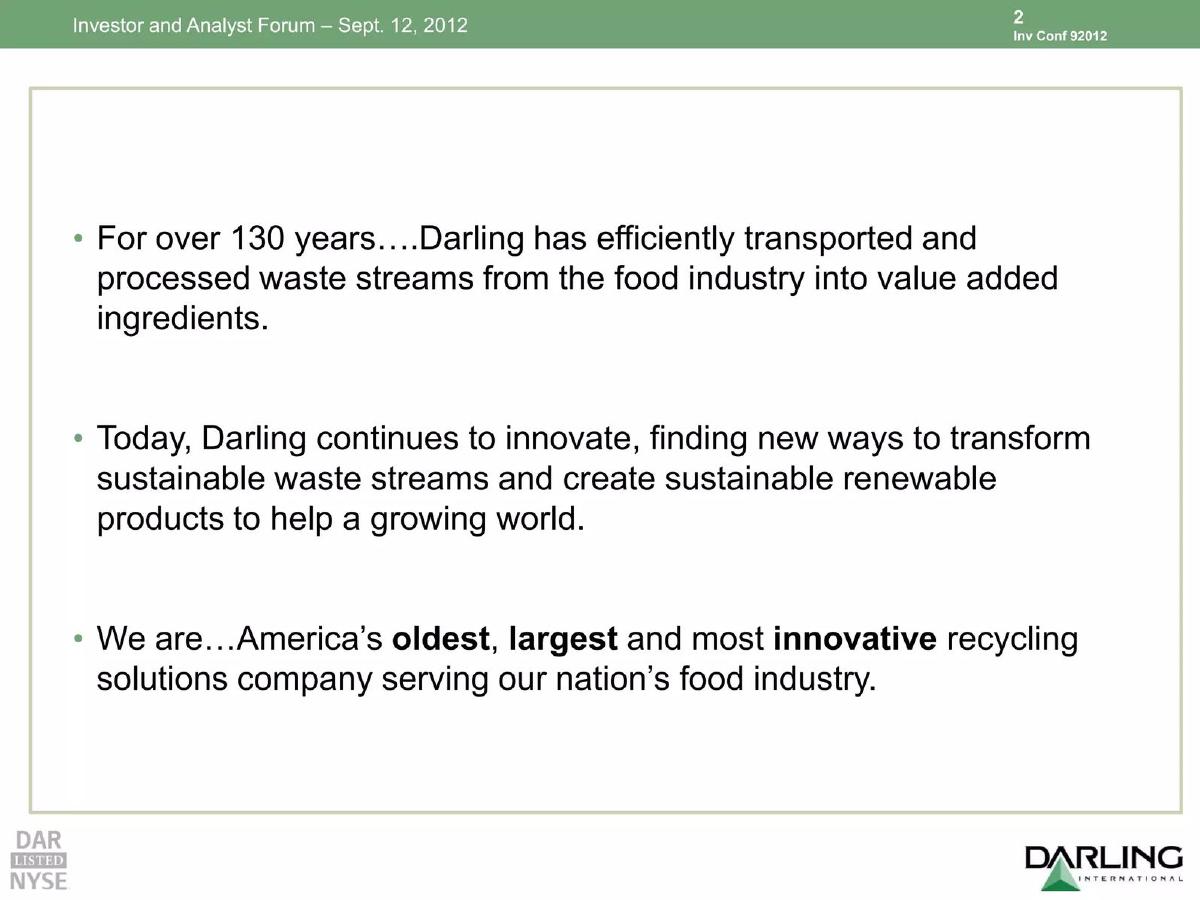
- The company positions itself as North America’s oldest and largest recycling solutions provider for the food industry (Slide 1).
- A primary strategic shift is the Diamond Green Diesel (DGD) plant, designed to consume 1.1 billion pounds of feedstock annually (Slide 11).
- Organic growth is driven by new bakery waste recycling locations and integrated oil delivery systems (Slide 22).
- The company consolidated its market presence under the DAR PRO Solutions brand to unify Darling and Griffin services (Slide 33).
- Financial health is transparently reported, with total stockholder equity reaching $995.2 million by June 2012 (Slide 55).
- Renewable diesel is marketed as a superior product to biodiesel due to its ability to use existing infrastructure and higher energy content (Slide 77).
- The deck emphasizes operational safety as a core value, dedicating specific slides to employee safety gear and protocols (Slide 88).
- Visual evidence of scale is provided through photography of 'Tank Farms' and industrial processing facilities (Slide 99).
Introduction and Strategic Positioning
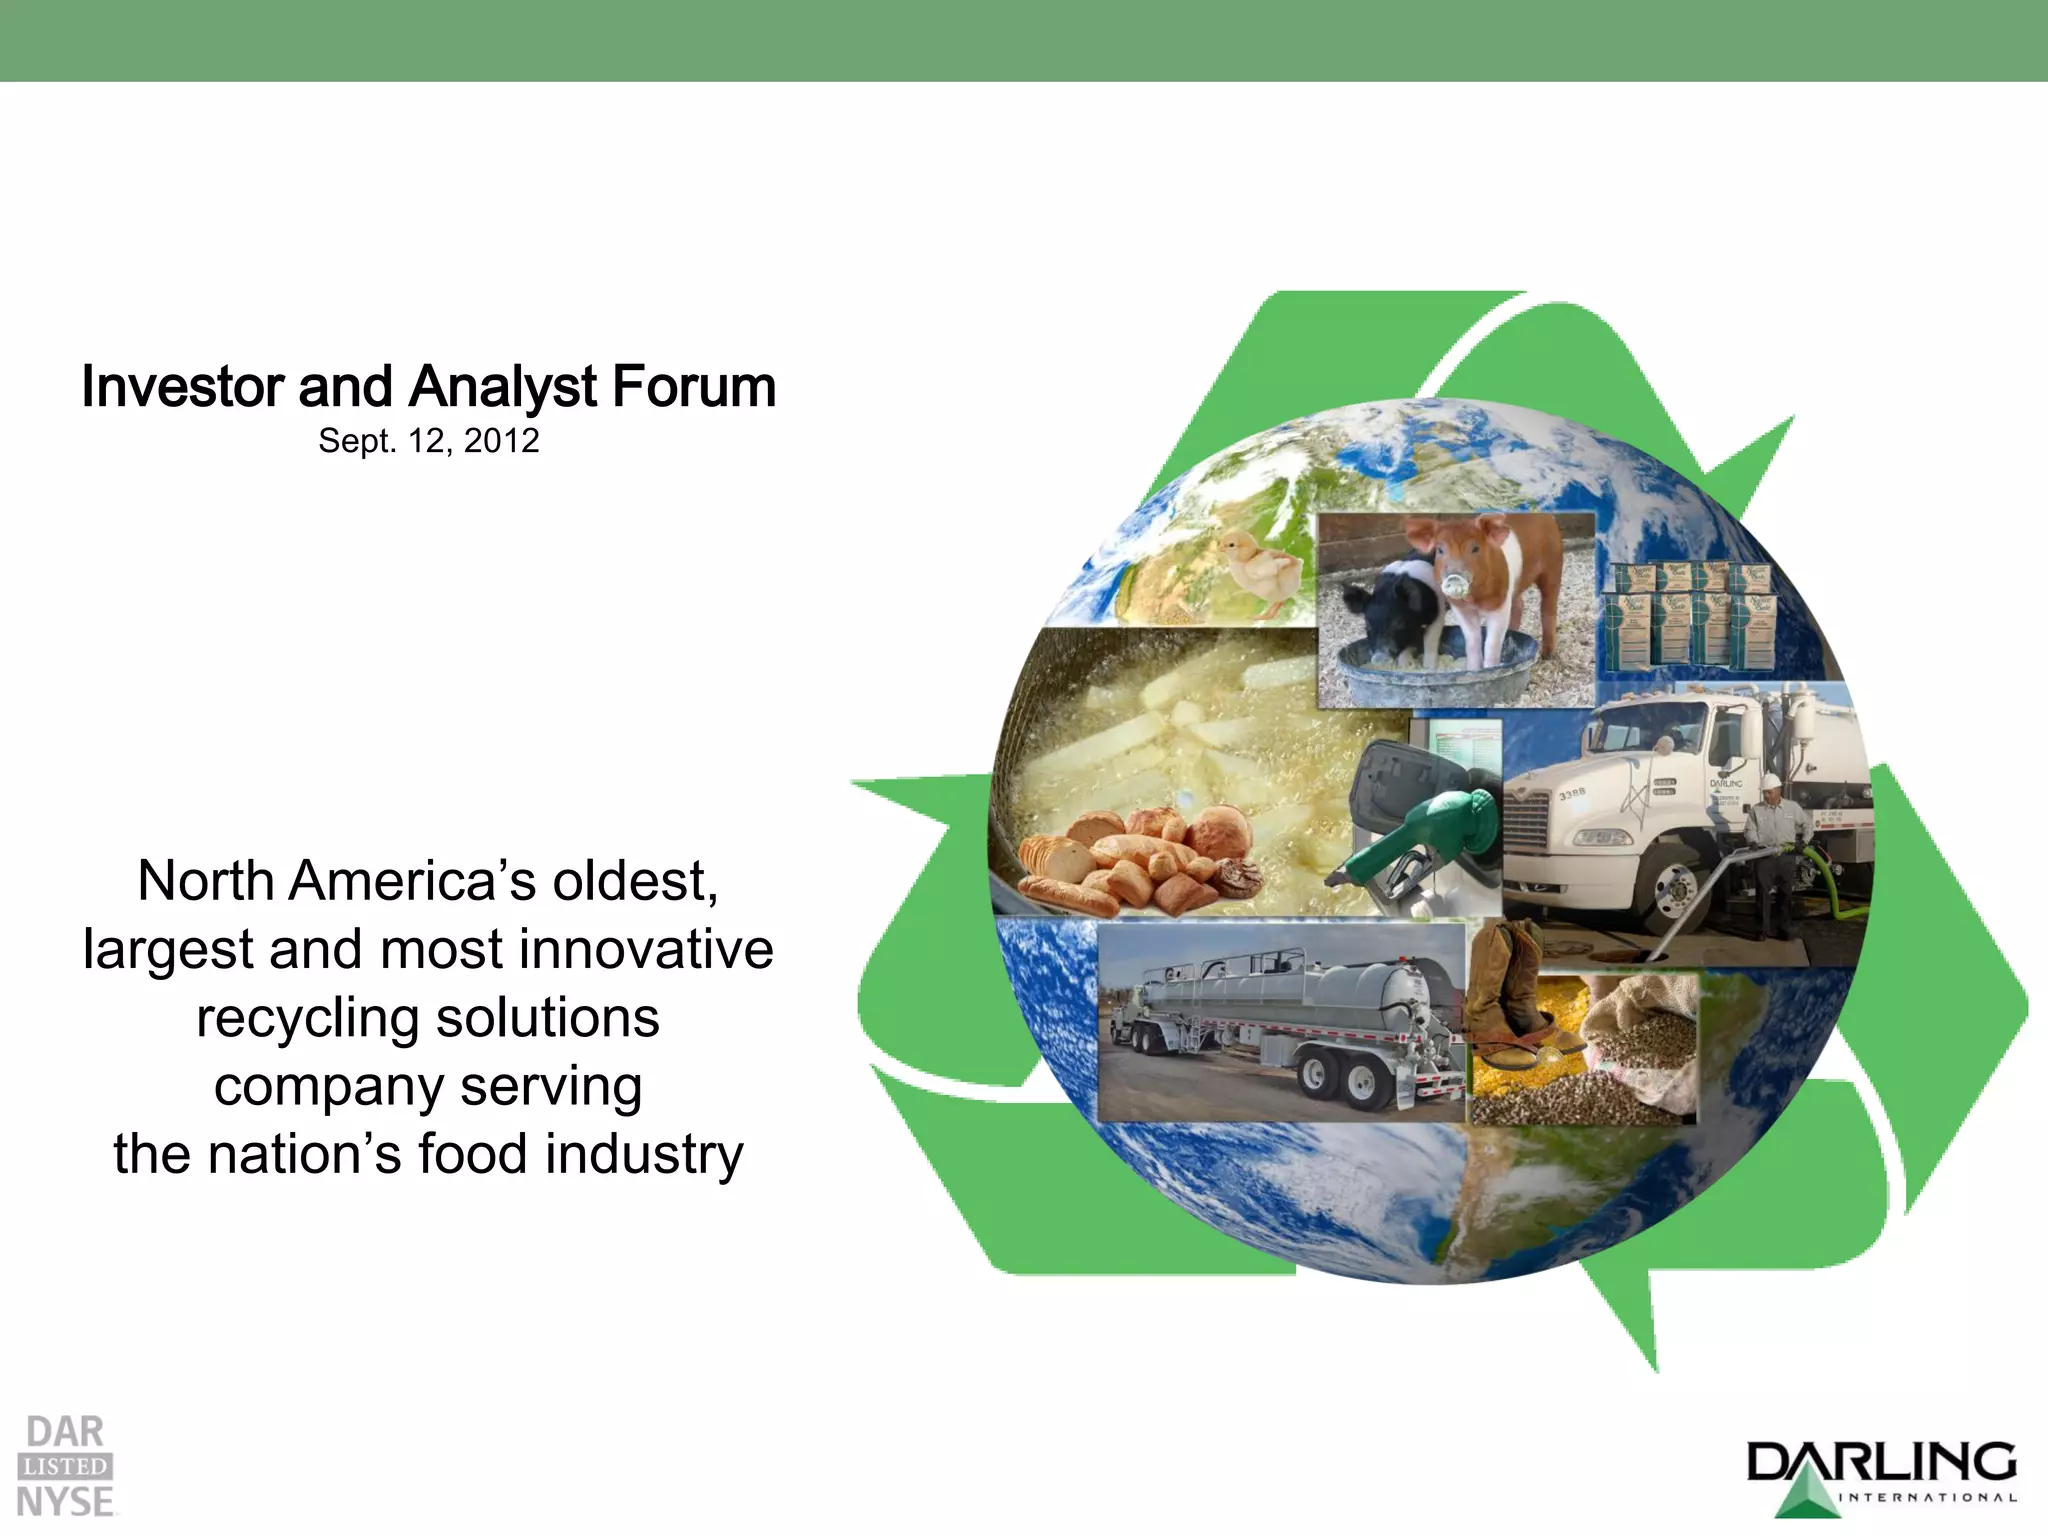
The presentation opens with a clear, authoritative statement of identity. Slide 1 establishes Darling International as "North America’s oldest, largest and most innovative recycling solutions company serving the nation’s food industry." The visual elements—a globe wrapped in a recycling symbol containing images of livestock, food waste, and industrial trucks—immediately communicate the circular nature of their business model. This slide sets the tone for a company that is both established (NYSE listed) and forward-looking.
The Diamond Green Diesel (DGD) Pivot
Slide 11 addresses a fundamental question for investors: "How does DGD change our model?" The company identifies Diamond Green Diesel as a transformative force. Key points include the creation of a new market for fats and greases, with an expected consumption of "+1.1 billion pounds annually." The slide highlights the strategic advantage of "arbitrage opportunities between feed and fuel," suggesting that Darling can shift its output to whichever market offers better margins. The inclusion of an aerial photograph of the DGD facility provides tangible proof of the project's scale and progress.
Growth Strategies and Market Consolidation
Slide 22 outlines "Organic Growth Opportunities," focusing on tangible physical expansions. These include new bakery waste recycling locations, specifically a Dallas transfer station, and options on several properties for future plants. The slide also mentions "Integrated Oil Delivery Systems" and "Hexane Extraction Waste Recovery," indicating a push toward deeper vertical integration and technological efficiency. The graphic of a rising bar chart made of puzzle pieces reinforces the idea that growth is built through interlocking strategic initiatives.
Slide 33 introduces the "DAR PRO SOLUTIONS" brand, described as a "Darling/Griffin Brand." This slide is significant as it represents a consolidation of market identity. The stated goal is to add value for stockholders by "offering the highest quality products and services under one brand name." This suggests a move away from fragmented regional identities toward a unified national presence, which is further emphasized on Slide 43, marking the "Go To Market Approach" presentation by Brian Griffin, SVP of Procurement & Service.
Financial Transparency and Asset Management
Slide 55 provides a comprehensive Balance Sheet, comparing Q2 2012 to Fiscal Year End 2011. The figures are precise: total assets grew from $1.417 billion to $1.479 billion in six months. A highlighted line item, "Investment in unconsolidated subsidiary," shows a jump from $21.7 million to $46.4 million, likely reflecting the capital injections into the DGD joint venture. The balance sheet also reveals a strong equity position, with "Stockholder's equity" at $995.2 million. For an analyst, this slide is the core of the deck, providing the raw data needed to validate the company's growth claims.
Operational Reach and Margin Mechanics
Slide 66 serves as a transition to a Q&A session but includes a map of the United States densely populated with red dots, representing the company's vast network of facilities. The surrounding text—Feed Ingredients, Biofuels, Restaurant Services, Bakery Recycling—reiterates the diverse revenue streams. This visual effectively demonstrates the company's "moat": a geographic footprint that would be nearly impossible for a new competitor to replicate quickly.
Slide 77 is perhaps the most technical and persuasive slide in the deck, titled "DGD Margin foundation – How the margins are created." Using a pyramid structure, it builds a case for renewable diesel's profitability. It starts with the regulatory floor—"RFS2 mandates a minimum of 1 billion gallons of BIOMASS-BASED DIESEL annually"—and moves up through technical advantages. Notably, it claims that "RENEWABLE DIESEL RIN’s... are valued at multiple of 1.7 vs. Biodiesel 1.5." This slide is a masterclass in explaining complex regulatory and chemical advantages in a way that directly correlates to bottom-line margins.
Safety and Industrial Infrastructure
Slide 88, "Safety is Critical," shifts the focus to human capital and risk management. It states that employees and guests are provided safety gear prior to gaining access to operations areas. While this might seem secondary to financial metrics, in the industrial sector, a poor safety record can lead to catastrophic legal and operational shutdowns. Including this in an investor deck signals a mature, well-managed organization.
Finally, Slide 99, titled "Tank Farm," features high-resolution photography of industrial storage tanks and piping. This serves as a visual "closer," reminding investors of the massive physical infrastructure that underpins the company's digital and financial reports. It emphasizes that Darling is a company of steel, pipes, and tangible assets.
What Works in This Deck
Regulatory Literacy: The deck does not shy away from the complexities of the RFS2 mandates and RIN multiples. By explaining these, the company shows it is not just a passive participant in the market but a sophisticated navigator of government policy. · Visual Proof of Scale: The use of aerial photography (Slide 11) and facility photos (Slide 99) prevents the deck from feeling like a collection of abstract numbers. It grounds the investment thesis in physical reality. · Strategic Clarity: The "How does DGD change our model?" slide (Slide 11) is an excellent example of addressing the "So What?" factor. It clearly explains why a major capital project matters to the overall business strategy. · Granular Financials: Providing a full balance sheet (Slide 55) in an analyst deck is standard but essential. It allows for immediate due diligence on liquidity and debt levels.
What Is Omitted
Competitor Analysis: In the 10 slides provided, there is no direct comparison to other rendering or biofuel companies. While Darling claims to be the "largest," it does not detail the market share of its closest rivals. · Unit Economics of Feedstock: While the deck mentions consuming 1.1 billion pounds of fats, it does not explicitly state the average cost per pound or the historical volatility of these feedstock prices, which is a major risk factor in the biofuels industry. · Executive Team Biographies: Although Brian Griffin is mentioned by title, the 10-slide sample lacks a traditional "Team" slide detailing the backgrounds of the CEO or CFO.
Founder Lessons
Embrace Complexity When Necessary: If your business relies on specific regulations (like RINs in this case), don't oversimplify. Explain the mechanic and how it creates a margin advantage, as seen on Slide 77. · Use Photography to Build Trust: For hardware or industrial startups, photos of your "Tank Farm" or factory floor are more convincing than 3D renders. They prove that you have moved past the ideation phase. · Address the Business Model Shift Head-On: If you are moving from one core business to another (e.g., rendering to biofuels), dedicate a slide to explaining exactly how that new model interacts with the old one. · Safety as a Value: If you operate in the physical world, showing that you care about safety (Slide 88) is a subtle but powerful way to signal that you are a professional, low-risk operator.
Frequently asked questions
- What is the primary business model shift described in the deck?
- The deck outlines a shift toward renewable energy through the Diamond Green Diesel (DGD) initiative. As shown on Slide 11, DGD creates a new market for the company's fats and greases, allowing for arbitrage between feed and fuel markets. This move transforms Darling from a simple waste recycler into a critical player in the biofuels supply chain, leveraging their existing feedstock to capture higher margins.
- How does Darling International differentiate renewable diesel from biodiesel?
- On Slide 77, the company argues that renewable diesel is superior because it can be distributed using existing petroleum infrastructure, whereas biodiesel cannot. Furthermore, renewable diesel has a higher energy content, resulting in Renewable Identification Numbers (RINs) valued at a 1.7x multiple compared to 1.5x for biodiesel, providing a significant regulatory and financial advantage.
- What are the key financial metrics reported in this 2012 presentation?
- Slide 55 provides a detailed balance sheet showing that as of June 30, 2012, the company held $72.3 million in cash and cash equivalents. Total assets were valued at $1.479 billion, supported by $422.7 million in property, plant, and equipment. The company also reported a significant increase in its investment in unconsolidated subsidiaries, rising from $21.7 million in 2011 to $46.4 million in mid-2012.
- How does the company address branding and market approach?
- The deck introduces 'DAR PRO Solutions' on Slide 33 as a unified brand for Darling and Griffin. This strategic move was intended to offer 'highest quality products and services under one brand name,' simplifying the go-to-market approach for their procurement and service divisions, as further detailed by SVP Brian Griffin on Slide 43.
- What role does safety play in the company's investor communications?
- Unlike many startup decks that ignore operational risks, Darling dedicates Slide 88 to safety. By stating 'Safety is Critical' and showing employees in full PPE, the company signals to investors that it manages the high-risk environment of industrial recycling and chemical processing responsibly, which is vital for maintaining its 'license to operate' in the food and fuel sectors.