Daseke Inc.’s May 2017 investor presentation outlines a clear roll-up strategy within the fragmented North American open deck trucking sector. The deck emphasizes a massive jump in scale, moving from $30 million in revenue in 2009 to a pro forma $770 million by 2016, representing a 59% CAGR. The company leverages a specialized fleet—including flatbed, super heavy haul, and high-value customized rigs—to serve industrial giants like Boeing, Caterpillar, and General Electric. While the deck is heavy on financial performance and market demand dynamics, it lacks a traditional team slide or a speci…
Key takeaways
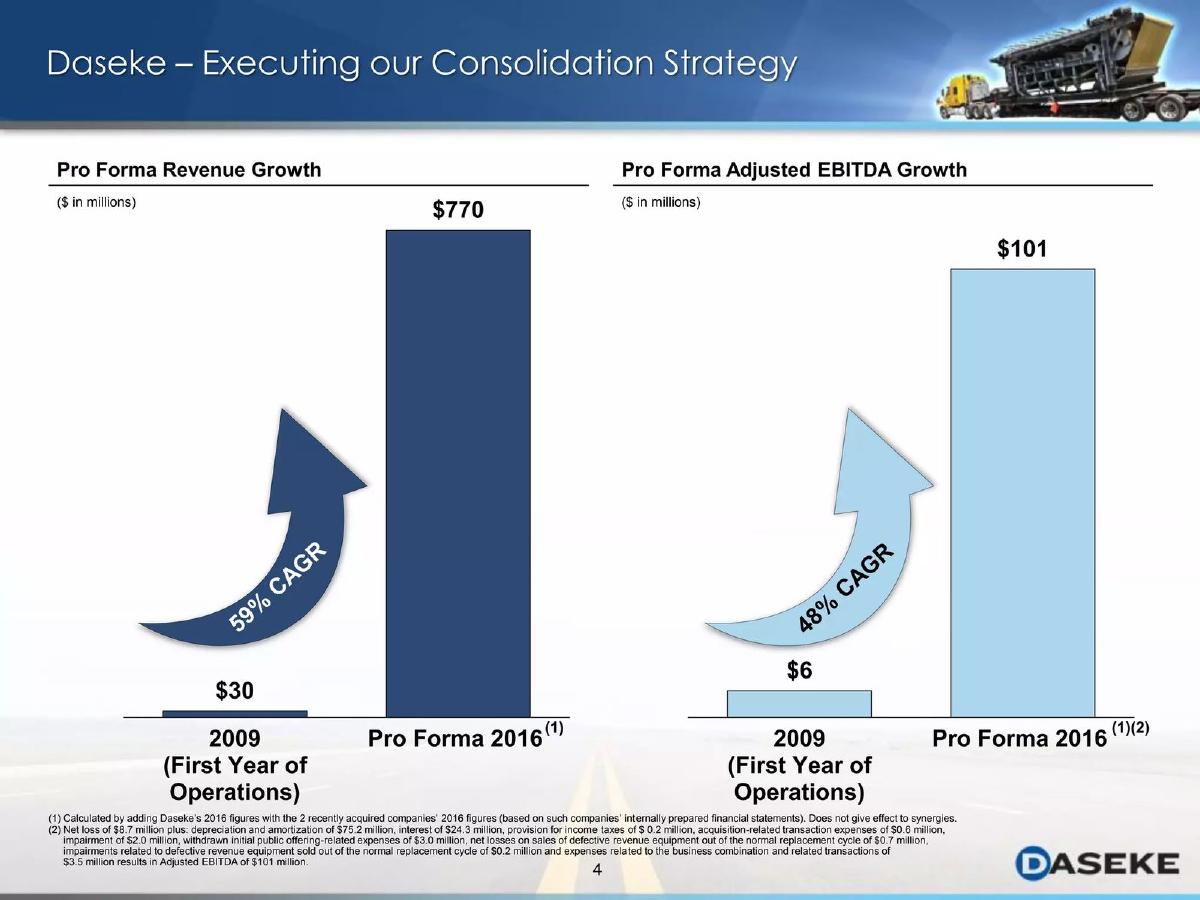
- The company achieved a 59% Revenue CAGR and a 48% Adjusted EBITDA CAGR from 2009 to 2016 (Slide 4).
- Daseke operates in specialized niches including Super Heavy Haul, High Value Customized, and RGN (Slide 6).
- Customer concentration is low, with no single customer accounting for more than 8% of total revenues (Slide 8).
- The top 10 customer relationships average over 20 years in duration (Slide 8).
- Market demand dynamics for 2017 showed significant improvement over the 2006-2016 average (Slide 10).
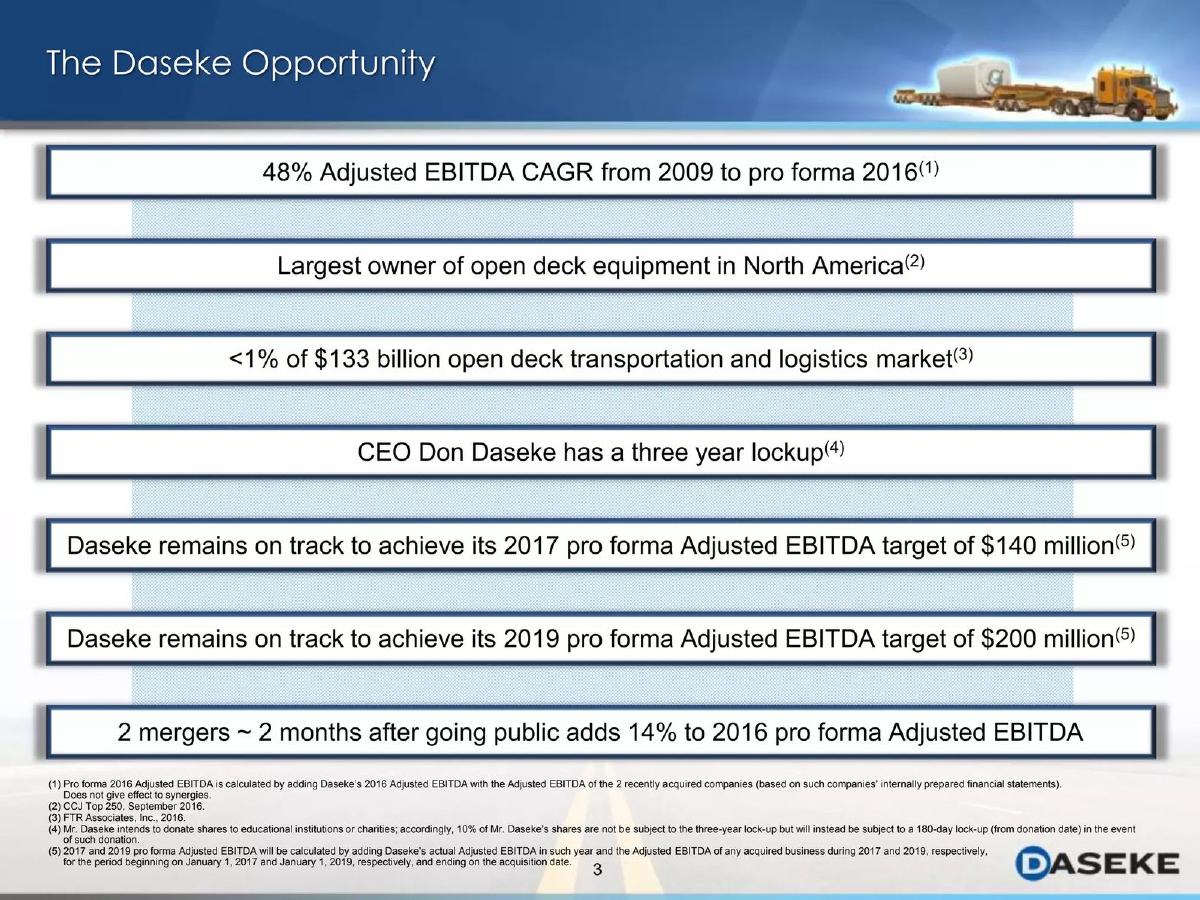
- Pro forma 2017 targets projected revenue reaching $979 million and Adjusted EBITDA hitting $140 million (Slide 14).
- Net Capital Expenditures as a percentage of revenue trended downward from 13% in 2014 to a projected 7% in 2017 (Slide 14).
- A unique earnout structure for pre-SPAC stockholders is tied to EBITDA targets of up to $200 million by 2019 (Slide 16).
Executive Summary: The Consolidation Playbook
Daseke, Inc.’s investor presentation from May 31, 2017, is a masterclass in presenting a "roll-up" or consolidation strategy. The deck focuses heavily on the transition from a smaller private entity to a massive, pro forma industrial powerhouse. By specializing in the 'open deck' niche—a segment of trucking that requires specialized equipment and expertise—Daseke positions itself away from the commoditized world of standard freight. The deck uses 18 slides (9 provided for this teardown) to argue that the market is ripe for consolidation and that Daseke has the momentum to lead it.
Slide 1: Title and Positioning
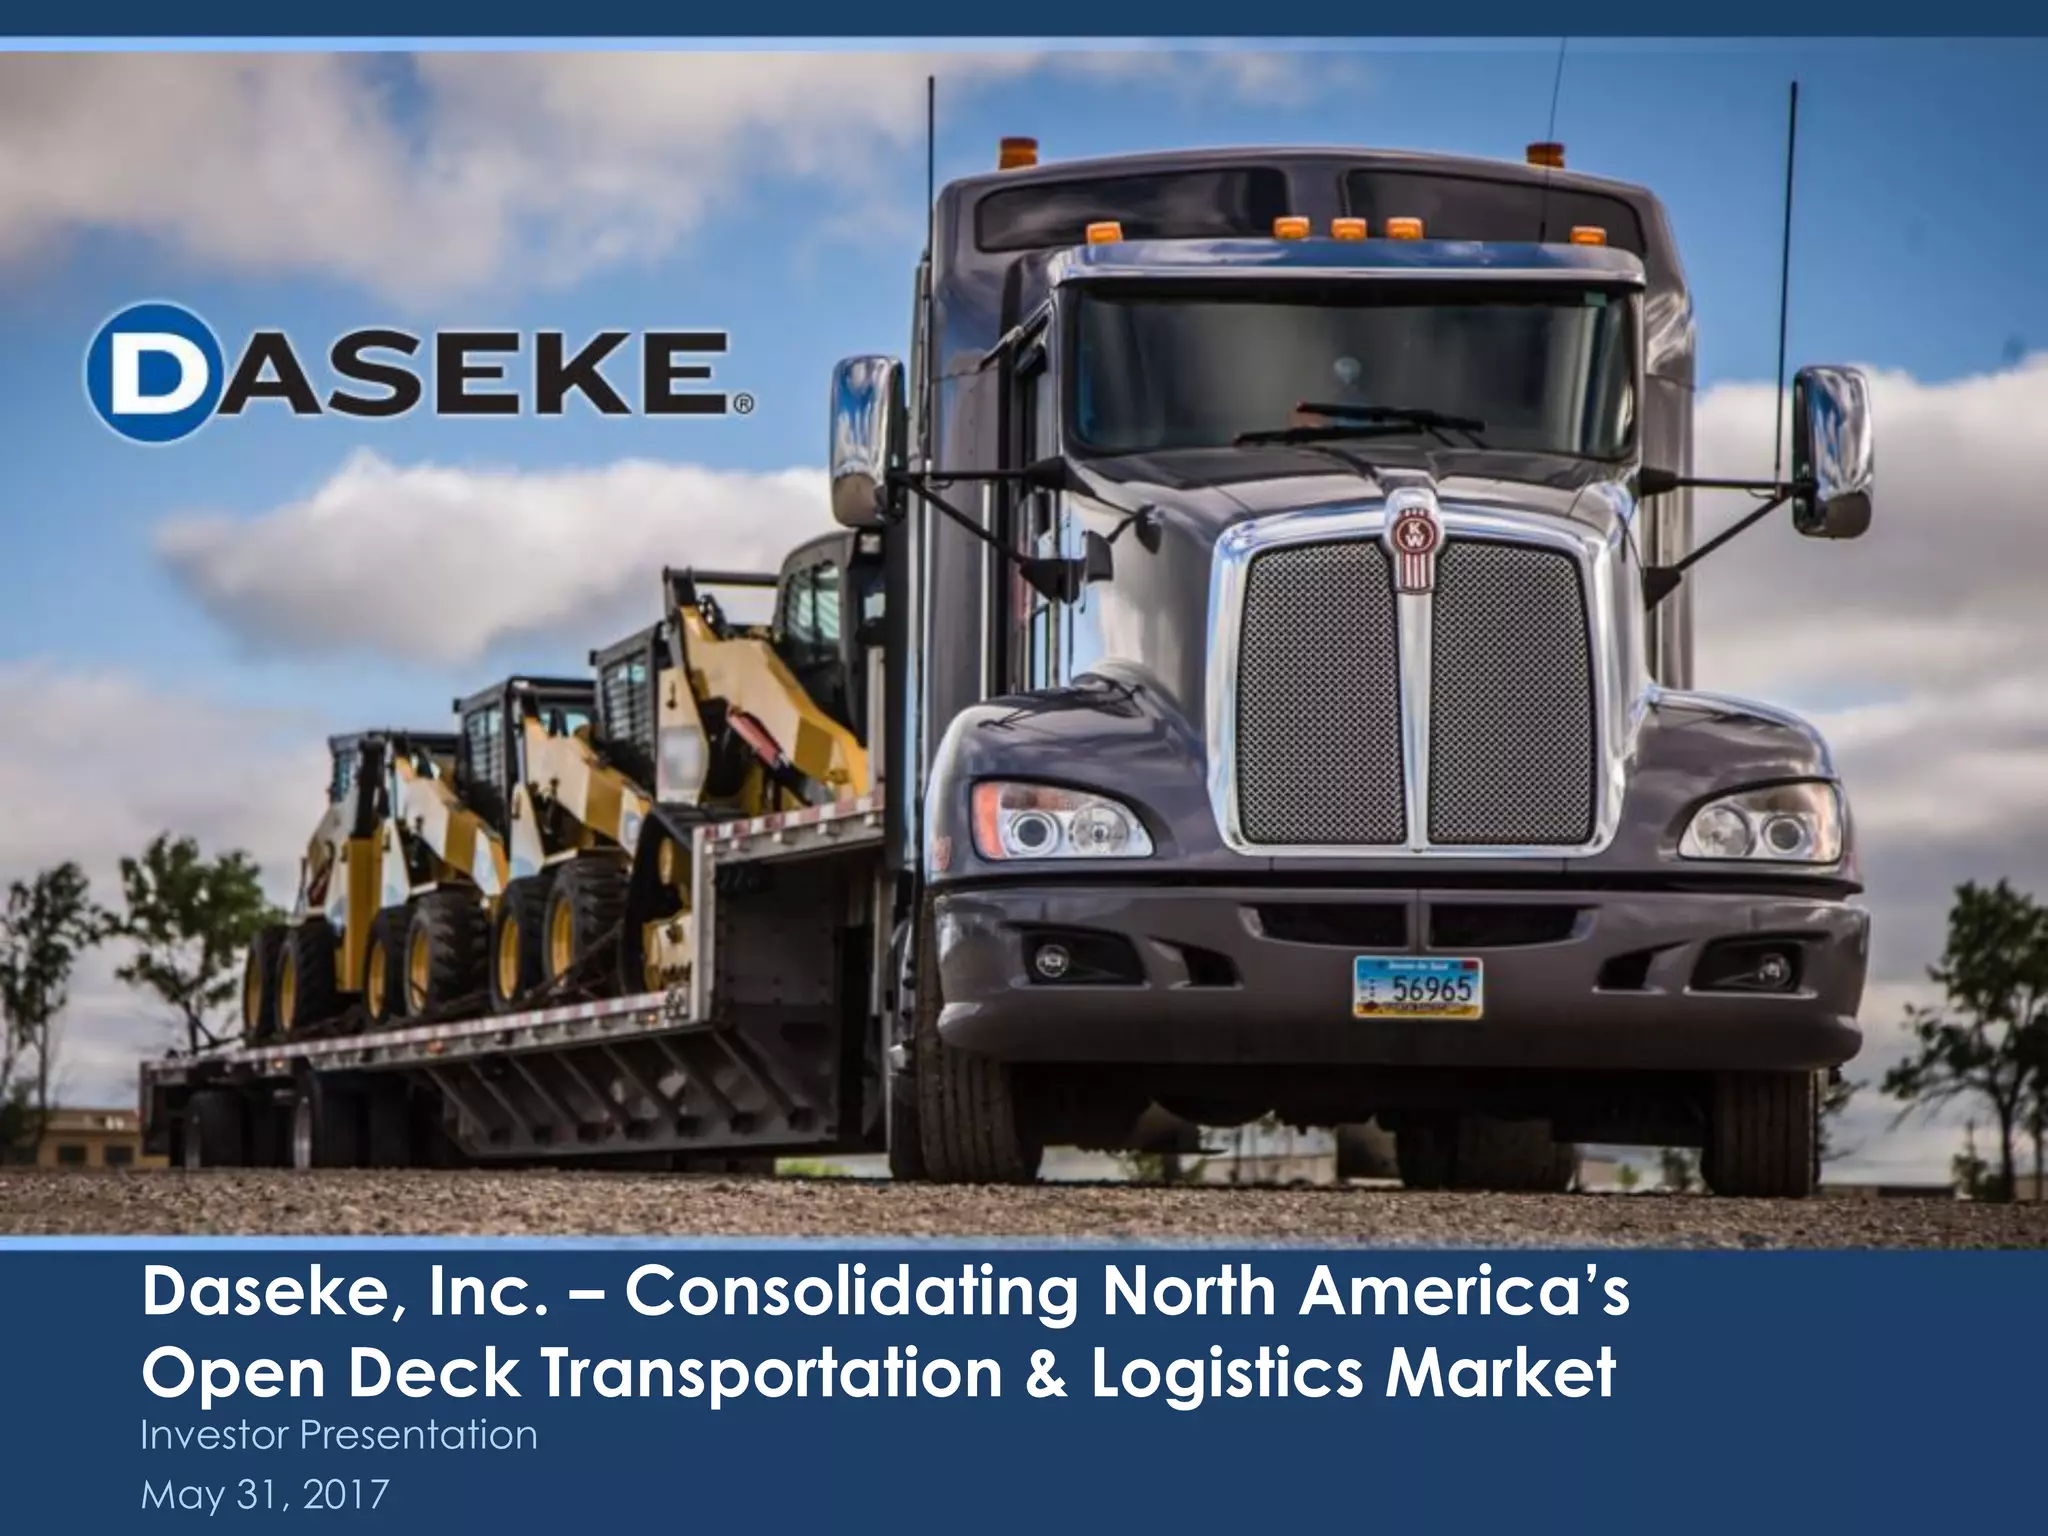
The cover slide establishes the company's core thesis immediately: "Consolidating North America’s Open Deck Transportation & Logistics Market." The imagery of a Kenworth truck hauling multiple pieces of yellow heavy machinery reinforces the industrial focus. The date, May 31, 2017, places this deck shortly after Daseke became a public company via a merger with a Special Purpose Acquisition Company (SPAC).
Slide 2: Visual Reinforcement of Niche
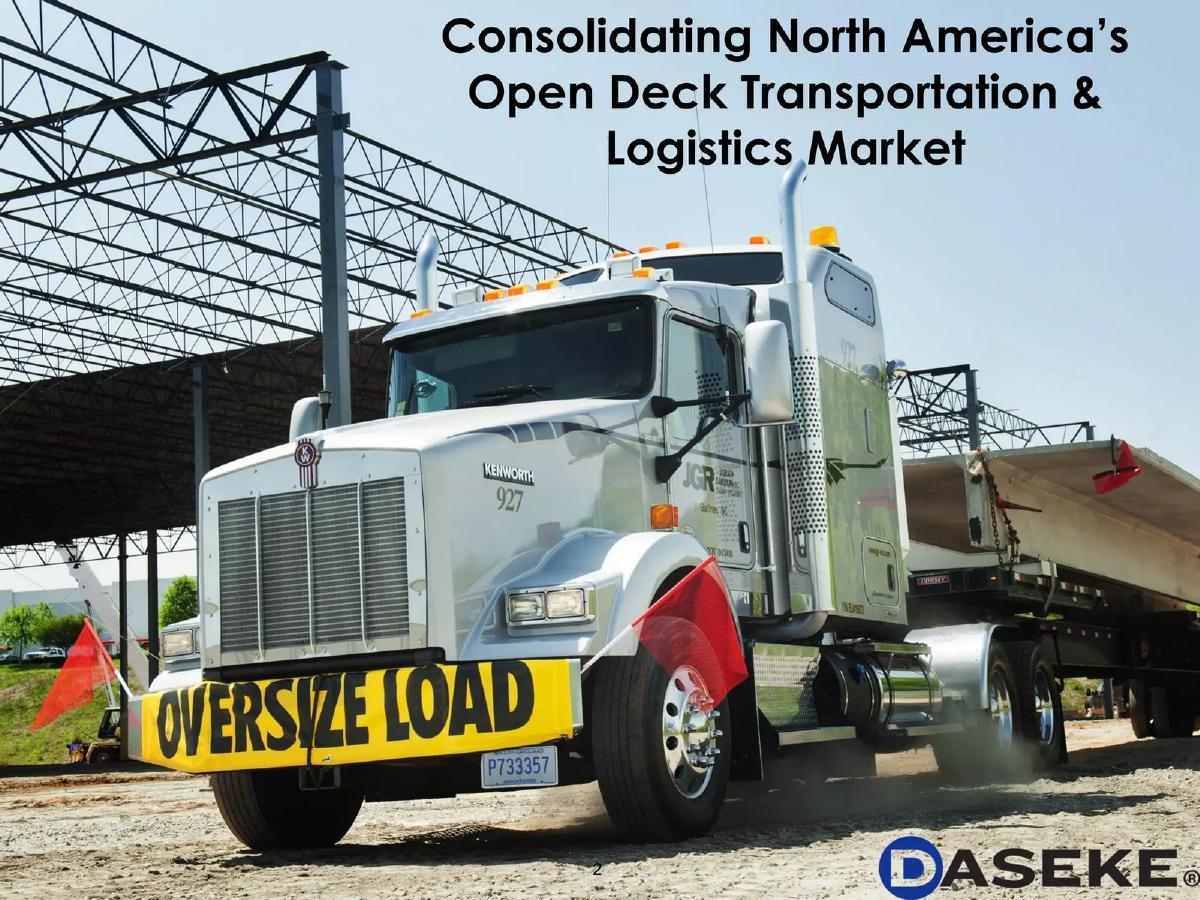
Slide 2 repeats the title but changes the visual to an "Oversize Load" truck hauling a massive concrete bridge beam. This is a strategic choice to remind investors that Daseke does not move boxes of consumer goods; they move the infrastructure of North America. It visually justifies why their margins and barriers to entry might be higher than traditional long-haul trucking.
Slide 4: The Growth Engine
This is the most critical slide for any consolidation story. It shows Pro Forma Revenue Growth jumping from $30 million in 2009 to $770 million in 2016, a 59% CAGR. Simultaneously, Pro Forma Adjusted EBITDA Growth rose from $6 million to $101 million, a 48% CAGR. The use of "Pro Forma" is vital here; it includes the full-year impact of recently acquired companies, showing investors what the combined entity looks like today rather than reflecting the historical lag of acquisition timing. The footnotes clarify that these figures include two recently acquired companies and adjust for one-time IPO-related expenses.
Slide 6: Defining the 'Open Deck' Category
For investors unfamiliar with logistics, Slide 6 provides a visual glossary. It breaks down the fleet into six categories: Flatbed, Step Deck, Over Dimensional, Super Heavy Haul, High Value Customized, and RGN . By showing photos of wind turbine components and aircraft fuselages, Daseke demonstrates the complexity of their operations. This slide serves to prove that their assets are specialized and not easily replaced by a generic competitor.
Slide 8: The Blue-Chip Customer Base
Slide 8 addresses the risk of customer concentration. It notes that no single customer accounts for greater than 8% of total revenues . The pie chart shows that the top 10 customers make up 36% of revenue, while the remaining 64% is diversified. The logos displayed are high-tier industrial giants: Boeing, Caterpillar, GE, Georgia-Pacific, Nucor, Vestas, and USG . Most importantly, the slide claims that top 10 customer relationships average over 20 years, suggesting high switching costs and deep integration into the customers' supply chains.
Slide 10: Market Dynamics and Timing
This slide uses Morgan Stanley Research to show "Favorable Demand and Supply Dynamics." The chart tracks incremental demand vs. incremental supply from 2010 through early 2017. The 2017 line (red) shows a significant spike in demand compared to the 2006-2016 average. This is intended to tell investors that Daseke is not just growing through acquisitions, but is also benefiting from a macro-economic tailwind in the industrial sector.
Slide 12: Appendix Transition
A simple divider slide marking the beginning of the supplemental financial data.
Slide 14: Forward-Looking Metrics
Slide 14 provides the '2017T' (Target) figures. It projects Revenue of $979 million and Adjusted EBITDA of $140 million . The slide also tracks Free Cash Flow , which grew from $3 million in 2013 to a projected $75 million in 2017. A key efficiency metric is shown at the bottom right: Net Capital Expenditures as a % of Revenue . This figure peaked at 13% in 2014 and is projected to drop to 7% in 2017, suggesting that the company is becoming more capital-efficient as it scales.
Slide 16: The Earnout Structure
The final slide in this set details the Earnout Structure for pre-SPAC stockholders. This is a transparency slide for public investors, showing that management only receives additional shares (up to 15 million) if they hit specific targets. For 2019, the targets are $200 million in Adjusted EBITDA and a $16.00 stock price . This aligns the founders' incentives with the new shareholders' desire for growth and share price appreciation.
What Works in This Deck
Clarity of Niche: Daseke does an excellent job of distinguishing itself from general freight. By repeatedly showing specialized equipment and naming high-spec industrial customers, they build a moat in the investor's mind.
Aggressive Financial Disclosure: The use of pro forma metrics combined with clear footnotes allows the investor to see the "end state" of the consolidation strategy. They don't hide behind complex accounting; they show the raw growth of the combined entities.
Alignment of Interests: Including the earnout slide is a strong move for a recently public company. It shows that the leadership is willing to put their own compensation on the line based on the same metrics the investors care about: EBITDA and stock price.
What is Missing
The Team Slide: In the provided slides, there is no mention of the executive leadership team or the heads of the acquired operating companies. In a roll-up strategy, the ability of the management team to integrate cultures and systems is paramount. Without this, investors are betting purely on the numbers, not the people.
Technology and Integration: The deck focuses on trucks and customers but omits how Daseke integrates these disparate companies. Is there a central dispatch system? A unified telematics platform? A shared procurement strategy for fuel and tires? The 'synergy' part of the consolidation story is implied but not detailed.
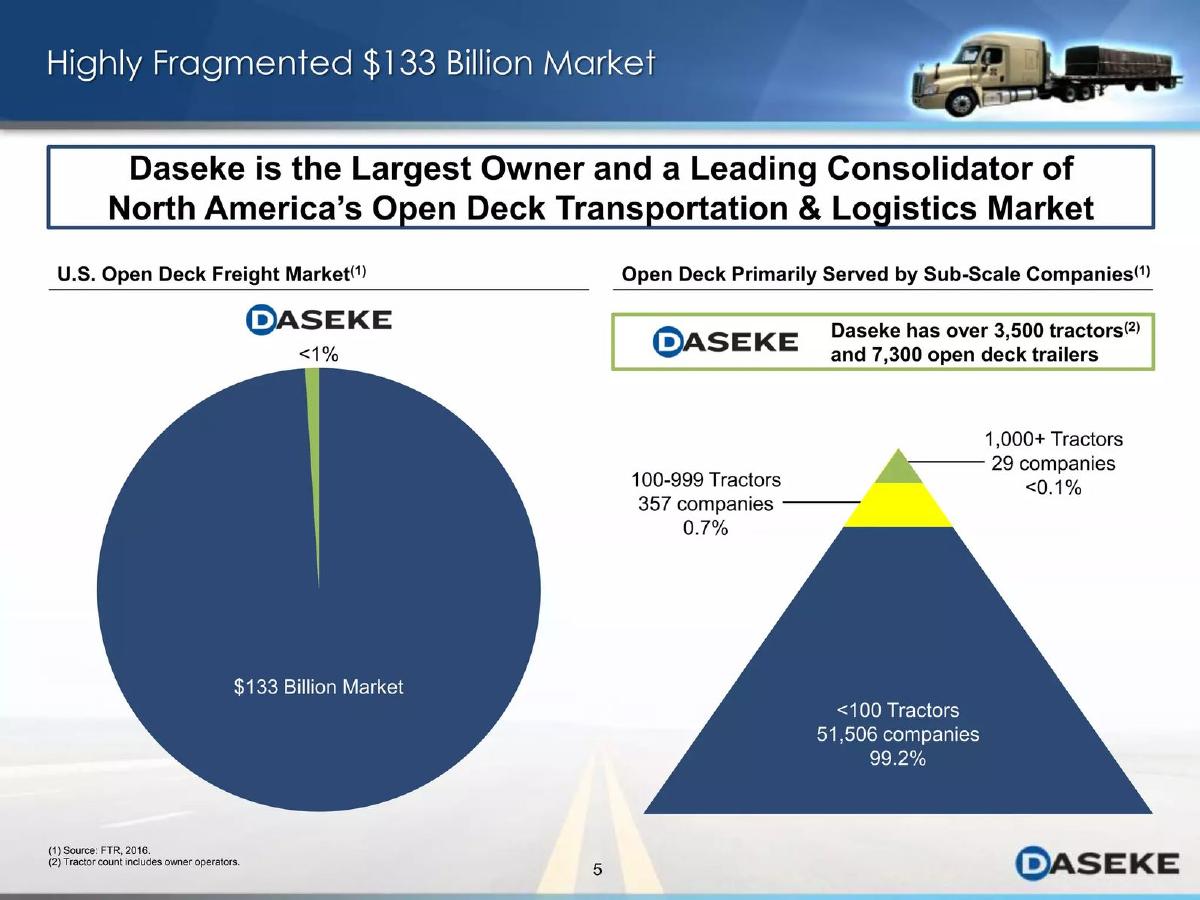
Competitive Landscape: While they mention they are "consolidating" the market, they don't show who they are competing against for acquisitions or for contracts. A slide showing the fragmented nature of the remaining market would have strengthened the case for future growth.
What a Founder Should Copy
Visual Proof: If you are in a physical industry, use high-quality photos of your assets in action. Daseke’s use of 'Oversize Load' imagery (Slides 2 and 6) does more to explain their value proposition than a paragraph of text ever could.
Relationship Longevity: Highlighting that your top 10 customers have been with you for 20 years (Slide 8) is a powerful way to de-risk a deal. Founders should always track and display customer retention or relationship age if the numbers are in their favor.
Targeted Metrics: The projection of Net CapEx as a percentage of revenue (Slide 14) is a sophisticated way to show that a business is maturing and becoming more profitable. Founders should look for these 'efficiency ratios' that prove the business gets better as it gets bigger.
Frequently asked questions
- What is Daseke's primary business model?
- Daseke focuses on the consolidation of the North American open deck transportation and logistics market. They acquire and integrate specialized trucking companies that handle oversized, heavy, or high-value industrial freight that cannot be moved in standard dry van trailers. Their strategy relies on achieving scale through acquisitions while maintaining long-term relationships with blue-chip industrial customers.
- How does Daseke define 'Open Deck' transportation?
- As shown on slide 6, Daseke defines open deck through six specific categories: Flatbed, Step Deck, Over Dimensional, Super Heavy Haul, High Value Customized, and RGN (Removable Gooseneck). These formats allow for the transport of large industrial components like wind turbine blades, aircraft parts, and heavy construction machinery.
- What do the financial metrics say about their growth?
- The growth is aggressive and acquisition-led. Between 2009 and 2016, revenue grew from $30 million to a pro forma $770 million. By 2017, they were targeting nearly $1 billion in revenue ($979 million). Adjusted EBITDA followed a similar trajectory, growing from $6 million to a pro forma $101 million in the same period, indicating that the consolidation strategy is successfully scaling the bottom line.
- Who are Daseke's major customers?
- Daseke serves a 'Blue Chip' industrial base. Slide 8 identifies major partners including Boeing, Caterpillar, GE, Georgia-Pacific, Nucor, Vestas, and Owens Corning. A key strength highlighted is the longevity of these relationships, with the top 10 customers averaging over two decades of partnership with Daseke’s operating companies.
- What is the significance of the earnout structure mentioned?
- The earnout structure (Slide 16) aligns management and pre-SPAC stockholders with new public investors. It sets specific hurdles for 2017, 2018, and 2019. To trigger the full 15 million share award, the company must reach an Adjusted EBITDA of $200 million and a stock price of $16.00 by 2019, providing a clear roadmap for expected performance.