In 2013, Databricks raised $14M in a Series A led by Andreessen Horowitz. The deck leans heavily on the academic and technical pedigree of its founding team—the creators of Apache Spark. Rather than focusing on early revenue (which was $0 at the time of the pitch), the deck sells a paradigm shift: moving from the slow, fragmented Hadoop ecosystem to a unified, in-memory processing engine that is 100x faster. The presentation is structurally simple but intellectually dense, focusing on performance benchmarks and a strategic roadmap to dominate the open-source community as a precursor to enterp…
Key takeaways
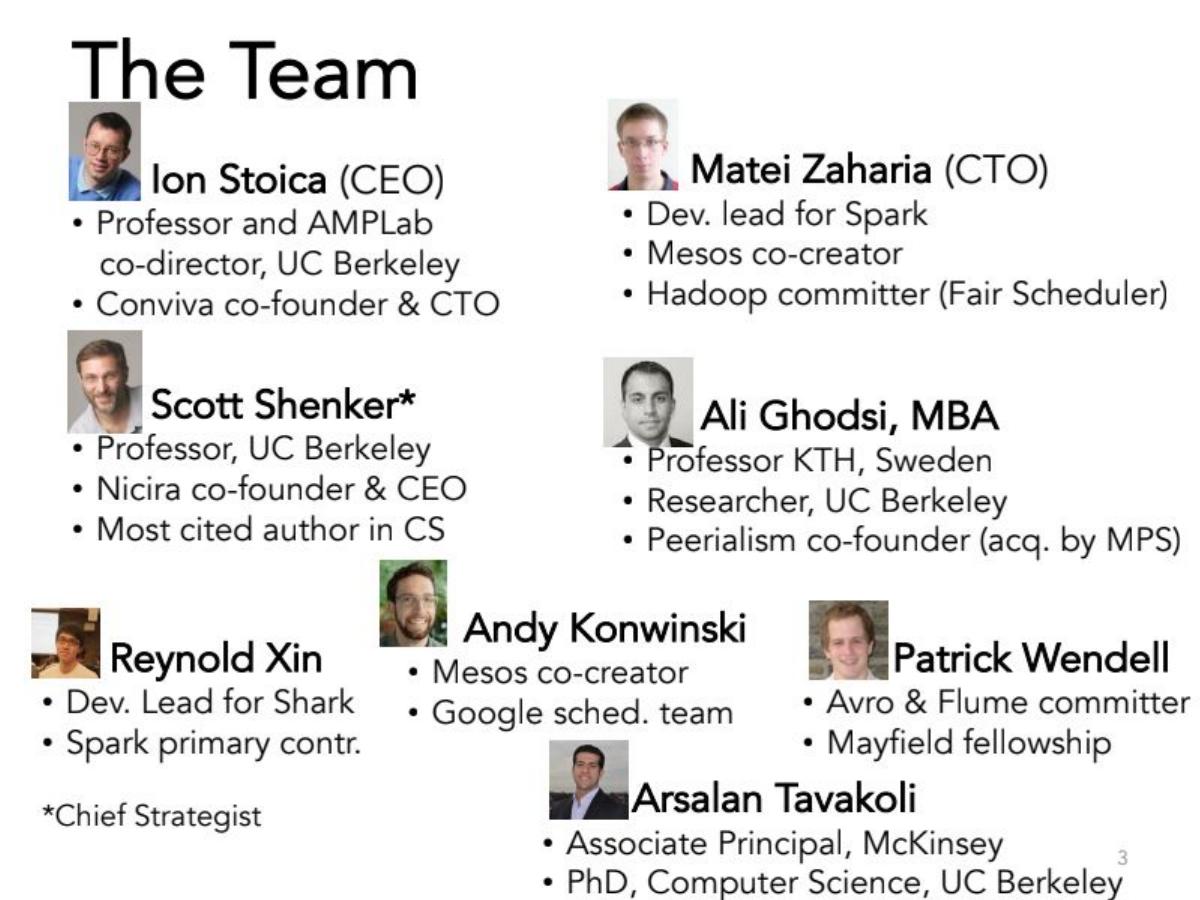
- The team slide (Slide 3) is the deck's strongest asset, featuring the creators of Spark, Mesos, and the most cited author in Computer Science.
- Databricks positioned Spark as a 'unified engine' to replace the fragmented 'specialized systems' like Hive, Storm, and Mahout (Slide 35).
- The core value proposition is speed, claiming Spark is 100x faster than Hadoop and requires 5-10x less code (Slide 9).
- Financial projections (Slide 19) show the company expected $0 revenue through Q1 2014, aiming for $10M/year by the Series B.
- The business model is a hosted platform with 'minimal set-up time' and a 'pay-as-you-go' structure (Slide 25).
- The deck explicitly outlines an open-source strategy to 'make Spark the de facto standard in academia' to drive enterprise adoption (Slide 17).
- Performance benchmarks are used aggressively, showing Spark's near-zero response time compared to Hive and Impala for SQL tasks (Slide 11).
- The 'Next Steps' slide (Slide 15) shows a pragmatic approach to enterprise sales, stating they will only do customization if customers 'write a big enough check.'
The Genesis of a Data Giant
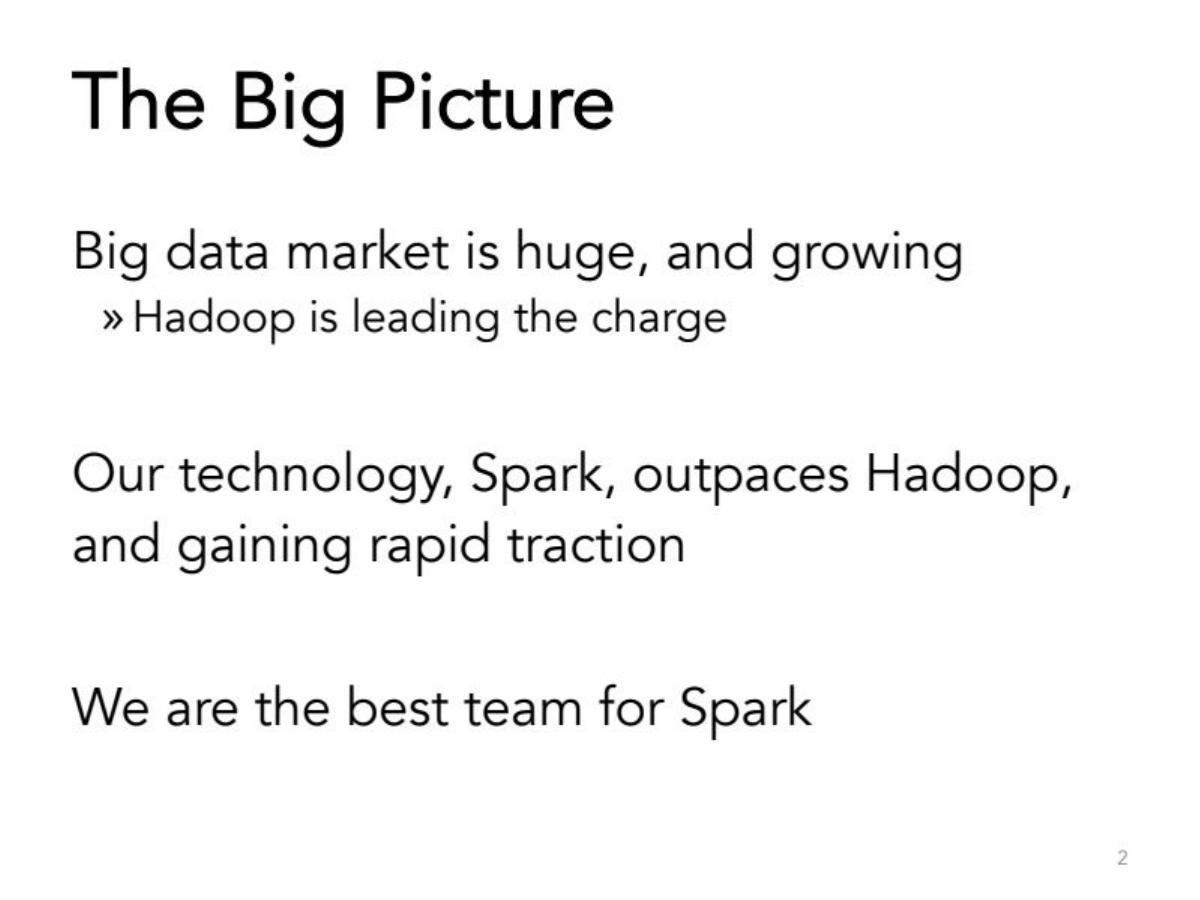
The Databricks Series A pitch deck, dated May 30, 2013, is a historical artifact of the 'Big Data' era. At 36 slides (with 18 provided for this teardown), it represents the transition from academic research at UC Berkeley’s AMPLab to a commercial powerhouse. This deck didn't raise money on traction; it raised on the sheer gravity of its technical team and the undeniable performance of their open-source creation, Apache Spark.
Slide 1: Title and Branding
The cover slide is remarkably humble. It features the original 'DataBricks' logo (with a capital B) over a literal brick wall texture. There are no taglines or mission statements here—just the date: May 30, 2013. It signals a 'no-nonsense' engineering culture that would define the company for the next decade.
Slide 3: The Team (The 'Unfair Advantage')
In many decks, the team slide is a formality. Here, it is the core of the investment thesis. Ion Stoica (CEO) is listed as a Professor and AMPLab co-director; Matei Zaharia (CTO) is the dev lead for Spark and co-creator of Mesos; Scott Shenker is noted as the 'most cited author in CS.' The slide lists eight individuals, almost all with deep ties to UC Berkeley and the primary development of the Spark ecosystem. For a Series A investor, this slide represents the highest possible concentration of intellectual property and domain expertise in the data processing space.
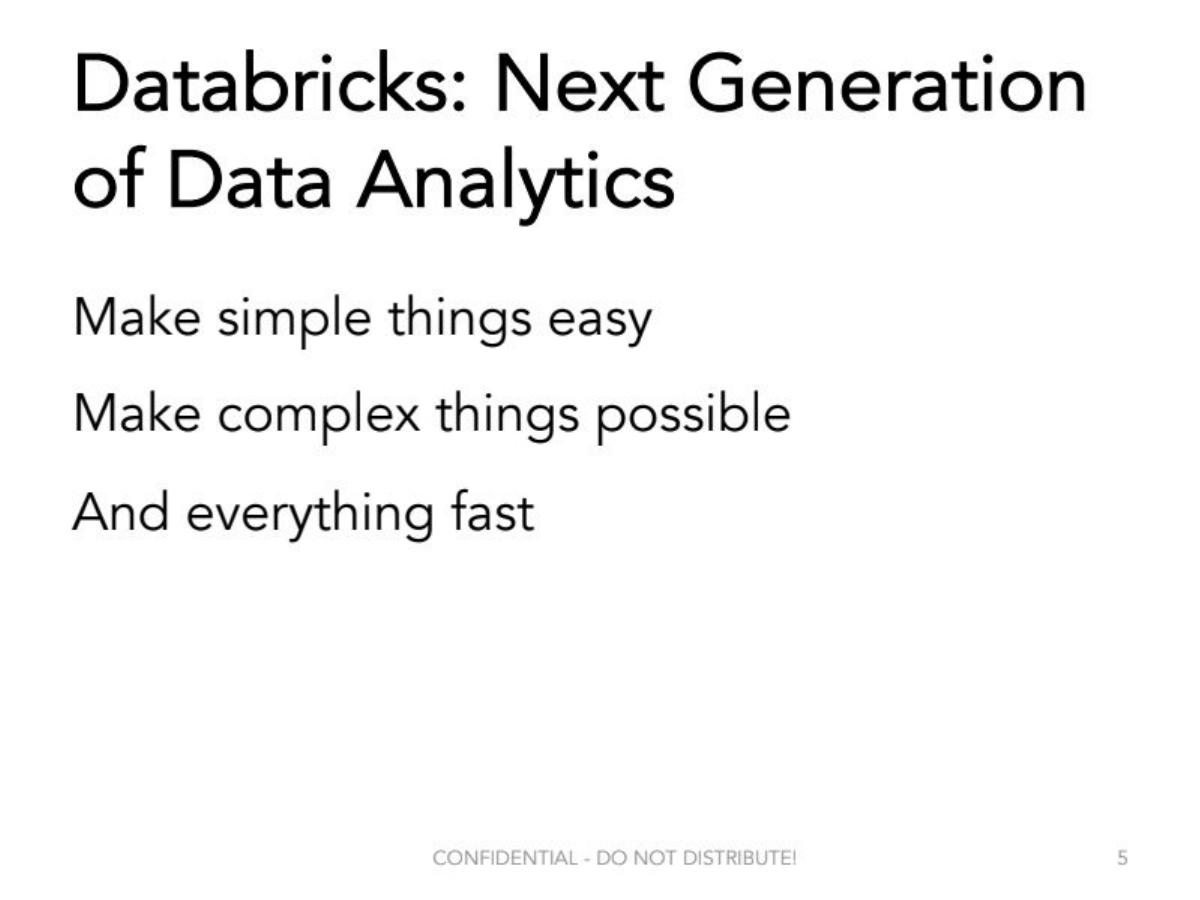
Slide 5: The Vision
Slide 5 defines the 'Next Generation of Data Analytics' with three simple pillars: 'Make simple things easy,' 'Make complex things possible,' and 'And everything fast.' This is a classic 'Product North Star' slide, setting the stage for the technical deep dive that follows.
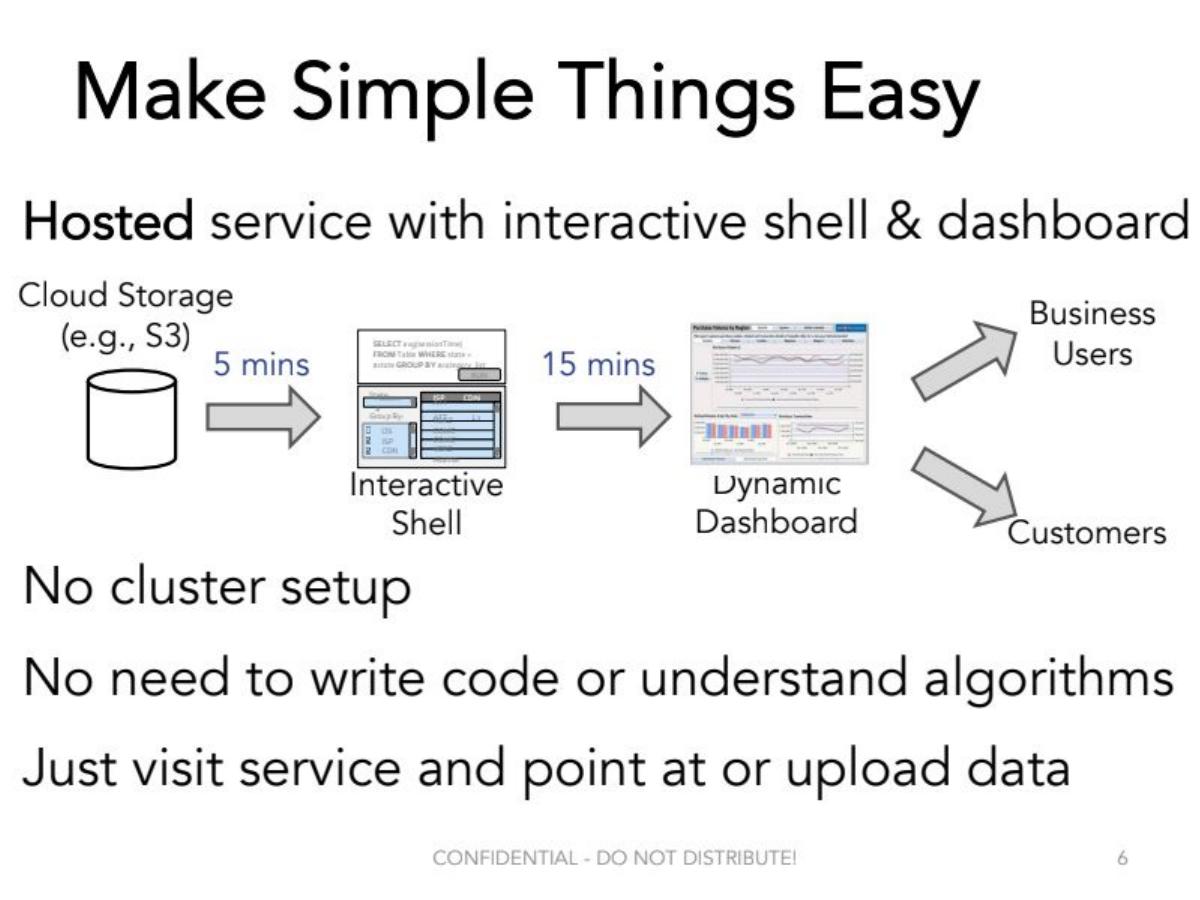
Slide 7: Making Complex Things Possible
This slide introduces the technical architecture. It shows a flow from Cloud Storage (e.g., S3) through a 24/7 streaming engine and an Interactive Shell , resulting in a Dynamic Dashboard for business users. Crucially, it highlights that the platform supports all models—from SQL to Machine Learning—and handles batch, interactive, and streaming data in one place. This was a direct shot at the fragmented Hadoop ecosystem of 2013.
Slide 9: Core Technology: Spark
Slide 9 gets to the 'meat' of the innovation. It cites Resilient Distributed Datasets (RDDs) as the key innovation, enabling fault-tolerant, in-memory storage. The metrics are bold: 100x faster than Hadoop and 5-10x less code . By framing the product against Hadoop—the then-incumbent—Databricks makes the value proposition immediately quantifiable for VCs.
Slide 11: Performance & Generality
This slide uses three bar charts to visualize the performance gap. In the SQL category, Spark's response time is a tiny fraction of Hive and Impala . In Machine Learning, Spark is shown as nearly instantaneous compared to Hadoop . In Streaming, Spark's throughput significantly exceeds Storm . These benchmarks are the 'proof' that the '100x faster' claim isn't just marketing hyperbole.
Slide 13: The Demo
A simple placeholder slide for a live demo. In a technical Series A, the demo is often where the deal is sealed, showing the software actually performing the tasks described in the benchmarks.
Slide 15: Next Steps and Pragmatism
Slide 15 is surprisingly candid about the company's early-stage boundaries. It mentions a 'Virtual cluster appliance' for on-premise customers but adds a notable caveat for customization: 'We’ll do it only if they write a big enough check!' This indicates a strong desire to remain a scalable product company rather than a consulting shop, a key trait VCs look for in SaaS founders.
Slide 17: Leading Technology Strategy
This slide outlines how they will maintain their lead: by driving the open-source Spark ecosystem and making it the 'de facto standard in academia.' They also mention leveraging Mesos for efficiency through multiplexing. This shows a long-term 'moat' strategy based on community and educational adoption.
Slide 19: Projected Budget and Revenue
The financial slide is a reality check. It assumes a $10M Series A (though they raised $14M). The table shows Revenue at $0.00 for the first three quarters (Q3'13 to Q1'14). They projected reaching $5,000,000 in revenue by Q2'15 and aimed for $10M/year revenue by the Series B . It also tracks headcount, growing from 8 to 40 employees over two years. This is a classic 'burn-to-build' model where the capital is used to hire engineers before the sales engine starts.
Slide 21: Backup Slides
A transition slide into the appendix, which contains more detailed strategic and technical information.
Slide 23: Competitive Positioning
A 2x2 matrix (though without the lines) titled 'Where does Spark Fit In?' It plots functionality against 'easy speed.' Spark sits in the top right, isolated from Hadoop, Mahout, Storm, Hive, and Impala . This slide reinforces the 'unified engine' narrative—why use five tools when you can use one?
Slide 25: Our Approach (The Business Model)
This slide details the commercial product: a Hosted platform based on Spark with 'minimal set-up time' and 'pay-as-you-go' pricing. It shows the DataBricks Analytics Platform sitting between cloud providers (AWS, Azure, Google) and end-user apps (Tableau, Jaspersoft). This is the blueprint for the modern 'Lakehouse' architecture.
Slide 27 & 29: Open Source Strategy
These slides explain the 'virtuous cycle' of open source. Slide 27 argues that a successful community improves the software and enables a vibrant developer ecosystem. Slide 29 lists specific tactics: supporting big companies like Yahoo!, Apple, and Intel , and encouraging Hadoop distributors like MapR and Terradata to package Spark. This is a sophisticated 'co-opetition' strategy.
Slide 31: How do We Get There? (Education)
Databricks planned to 'Educate the next generation of big data scientists' by offering free use for data science courses on Coursera, edX, and Udacity . By winning the hearts and minds of students, they ensured that when those students entered the workforce, Spark would be their tool of choice.
Slide 33: Iterative Algorithms
More benchmarks. For K-Means Clustering , Spark takes 4.1 seconds per iteration vs. Hadoop's 155 seconds. For Logistic Regression , Spark takes 0.96 seconds vs. Hadoop's 110 seconds. These specific ML use cases were critical for the 'AI' part of their future 'Data + AI' branding.
Slide 35: An Analogy
The final provided slide uses a visual analogy. It shows the evolution from Hadoop (Batch processing) to a messy middle of Specialized systems (Impala, Hive, Storm, etc.) labeled 'Still limited and hard to use,' and finally to Spark (Unified engine) . It is a powerful closing argument for simplicity and consolidation.
What Works in the Databricks Deck
Extreme Technical Authority: The team slide is essentially a 'who's who' of the data world in 2013. For a technical round, this is the ultimate de-risking mechanism. · Clear Benchmarking: They didn't just say they were faster; they showed 100x improvements on specific, industry-standard algorithms (K-Means, Logistic Regression). · The 'Unified' Narrative: In a market that was becoming increasingly fragmented and complex, the promise of a single engine that does everything (Batch, Stream, ML, SQL) was a massive value proposition. · Strategic Moat: The focus on academia and open-source community building showed that the founders understood how to build a standard, not just a product.
What is Missing from the Databricks Deck
Sales and Marketing Strategy: While the open-source strategy is clear, there is very little on how they will actually build a sales force or identify their first paying enterprise customers. · Unit Economics: As a pre-revenue company, there is no mention of LTV, CAC, or churn. The 'Projected Budget' is purely an expense and top-line revenue forecast. · Detailed Pricing: While 'pay-as-you-go' is mentioned, there are no specific tiers or pricing models shown. · Case Studies: The deck relies on benchmarks rather than real-world customer success stories, likely because the commercial platform was still in development.
What Founders Should Copy
The 'Analogy' Slide: Slide 35 is a perfect example of how to explain a complex market shift simply. Show the 'Old Way,' the 'Messy Current Way,' and 'Your Way.' · Benchmark-Driven Value: If you are building a technical product, don't use adjectives like 'fast' or 'scalable.' Use charts that show exactly how much faster you are than the incumbent. · The 'Check' Rule: Being honest about what you won't do (Slide 15) can actually build more trust with investors than claiming you will be everything to everyone. It shows focus. · Community as a Moat: If your product has an open-source or developer-centric component, show how you will 'win the classroom' to eventually 'win the boardroom.'
Frequently asked questions
- How much did Databricks raise with this deck?
- Databricks raised $14M in a Series A round in 2013, led by Andreessen Horowitz. The deck itself (Slide 19) includes a 'Projected Budget' based on an assumption of a $10M Series A, suggesting they oversubscribed the round or adjusted the target during the fundraise.
- What was Databricks' revenue at the time of the Series A?
- According to the 'Projected Budget' on Slide 19, the company had $0.00 in revenue for Q3 2013 and Q4 2013. They projected their first $200,000 in revenue for Q2 2014, nearly a year after the deck's date of May 30, 2013.
- Who were the key team members listed in the deck?
- The team (Slide 3) included Ion Stoica (CEO), Matei Zaharia (CTO and Spark dev lead), Scott Shenker (Chief Strategist), Ali Ghodsi, Reynold Xin, Andy Konwinski, Patrick Wendell, and Arsalan Tavakoli. The slide highlights their ties to UC Berkeley's AMPLab and their roles as creators of Spark and Mesos.
- What was the primary competitive advantage claimed?
- The primary advantage was technical performance and simplicity. Slide 9 claims Spark is 100x faster than Hadoop and requires 5-10x less code. Slide 35 uses an analogy to show Spark as a 'unified engine' replacing a messy constellation of specialized, hard-to-use systems.
- What was their strategy for winning the market?
- Their strategy was 'Open Source First.' As shown on Slides 17, 27, and 31, they planned to lead the open-source community, educate the next generation of data scientists via MOOCs (Coursera, Udacity), and make Spark the academic standard to ensure long-term enterprise dominance.