Cost Structure on a Pitch Deck Financials Slide: 7 Real
How to show operating expenses on your financials slide: which cost lines to list, how to tie them to headcount and revenue.
How to Show Your Cost Structure on a Pitch Deck
Seven slides from seven real pitch decks show how founders present where the money goes: a one-year budget, a quarterly plan tied to headcount, five-year tables with costs split into lines, a single expense line, a percentage pie, and a table with the numbers hidden.
TL;DR
Show your operating expenses as a short list of named cost lines with a total, over the same periods as your revenue, and make every column add up. DW Apps lists five lines (staff $155,000, rent and utilities $17,400, events and marketing $67,500, legal and admin $37,000, travel $20,000) that add up exactly to its $296,900 total. Databricks shows spending each quarter next to headcount growing from 8 to 40, and every quarter's profit and cash balance follows from its revenue and costs. AcuMedical splits operating expenses from research and clinical costs over five years, and every line adds up, but its operating expenses barely rise while sales grow about 150 times, which an investor will question. CaddySnack shows quarterly operating expenses, but its net loss does not match revenue minus costs. AbleLife gives a single expense line with no breakdown. ConnectWave's cost pie adds up to 94%, not 100%. Assist.me names the right cost lines but covers the numbers with a blank box.
Cost structure slides from real pitch decks
Each example shows the exact stored slide above its analysis and links to the full teardown. Stage and year are given only where the deck states them. Figures are the company's own claims.
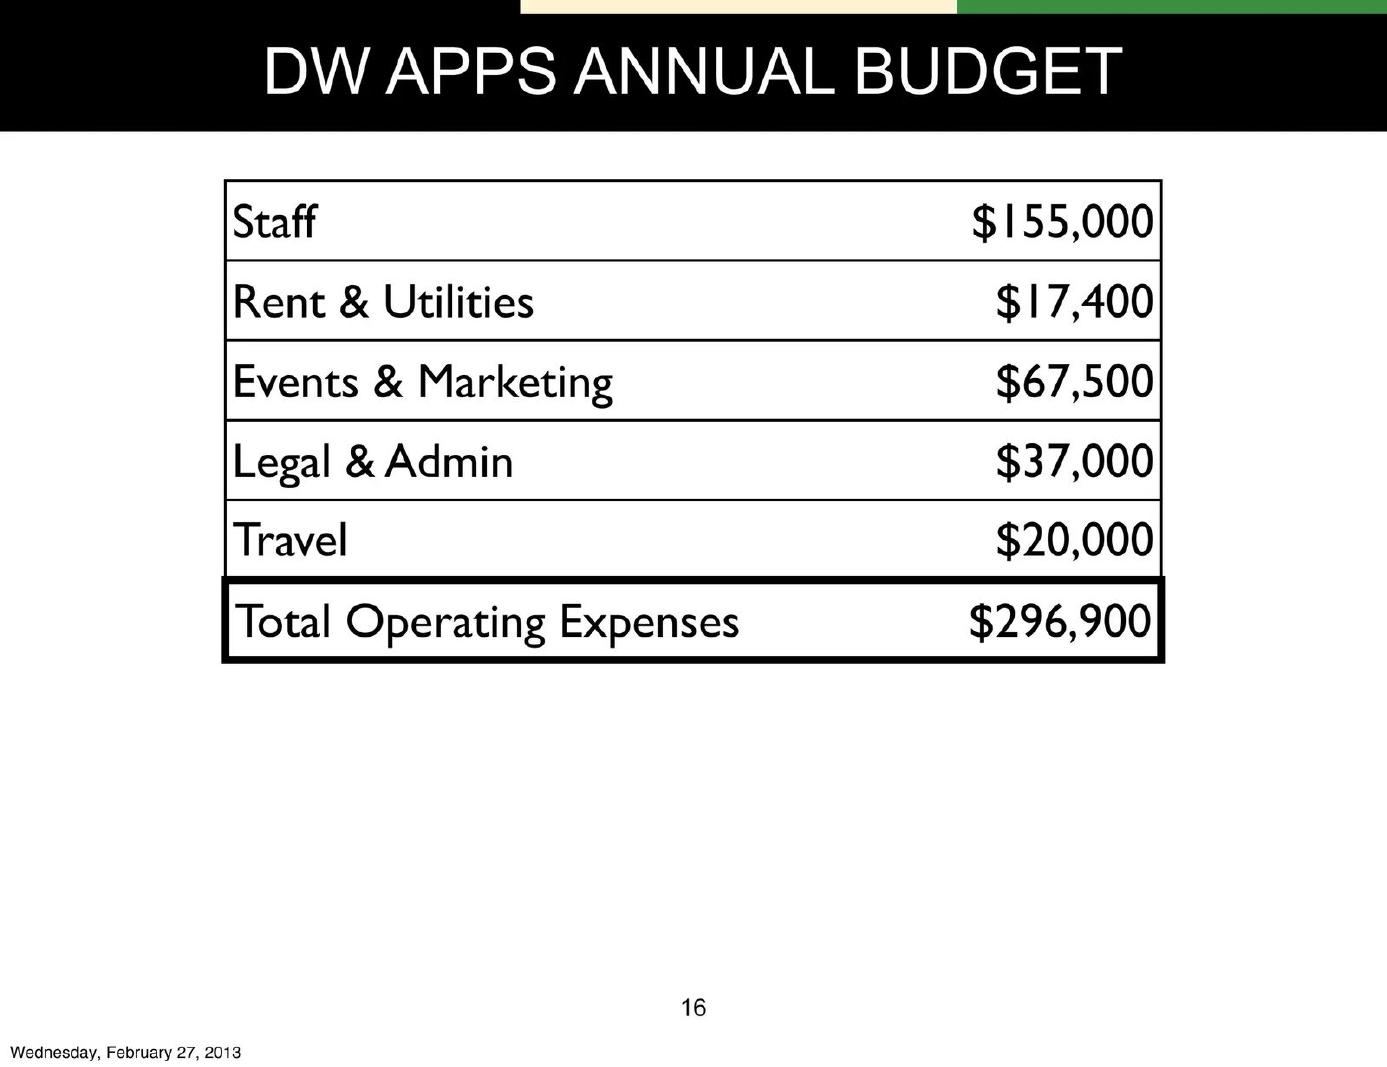
DW Apps financials slide — slide 16
App accelerator, February 2013 deck.
DW Apps deck, slide 16. Exact stored slide matched to this analysis.
Our analysis: Five named lines that add up exactly to the total.
Evidence and limitation: A single total with no lines behind it.
What a founder can adapt: Add headcount or what each line pays for.
Supporting analysis
What the deck claims: Annual budget: staff $155,000; rent and utilities $17,400; events and marketing $67,500; legal and admin $37,000; travel $20,000; total operating expenses $296,900.
Presentation choice: Five named lines that add up exactly to the total.
When it does not fit: A single total with no lines behind it.
Data platform, 2013 Series A deck assuming a $10M round.
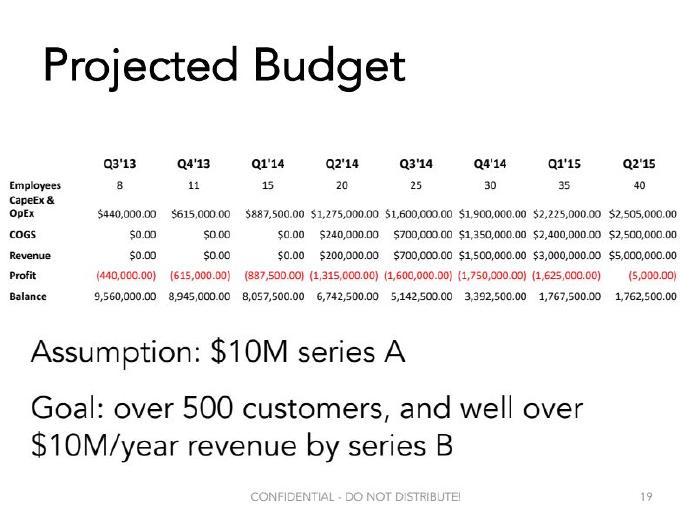
Databricks deck, slide 19. Exact stored slide matched to this analysis.
Our analysis: Ties spending to headcount and runs to a cash balance; every column works.
Evidence and limitation: Combining equipment and salaries in one row.
What a founder can adapt: Separate capital spending from running costs.
Supporting analysis
What the deck claims: Eight quarters Q3 2013 to Q2 2015: employees 8 to 40; CapEx and OpEx $440,000 to $2,505,000 a quarter; revenue $0 to $5,000,000; balance $9,560,000 falling to $1,762,500.
Presentation choice: Ties spending to headcount and runs to a cash balance; every column works.
When it does not fit: Combining equipment and salaries in one row.
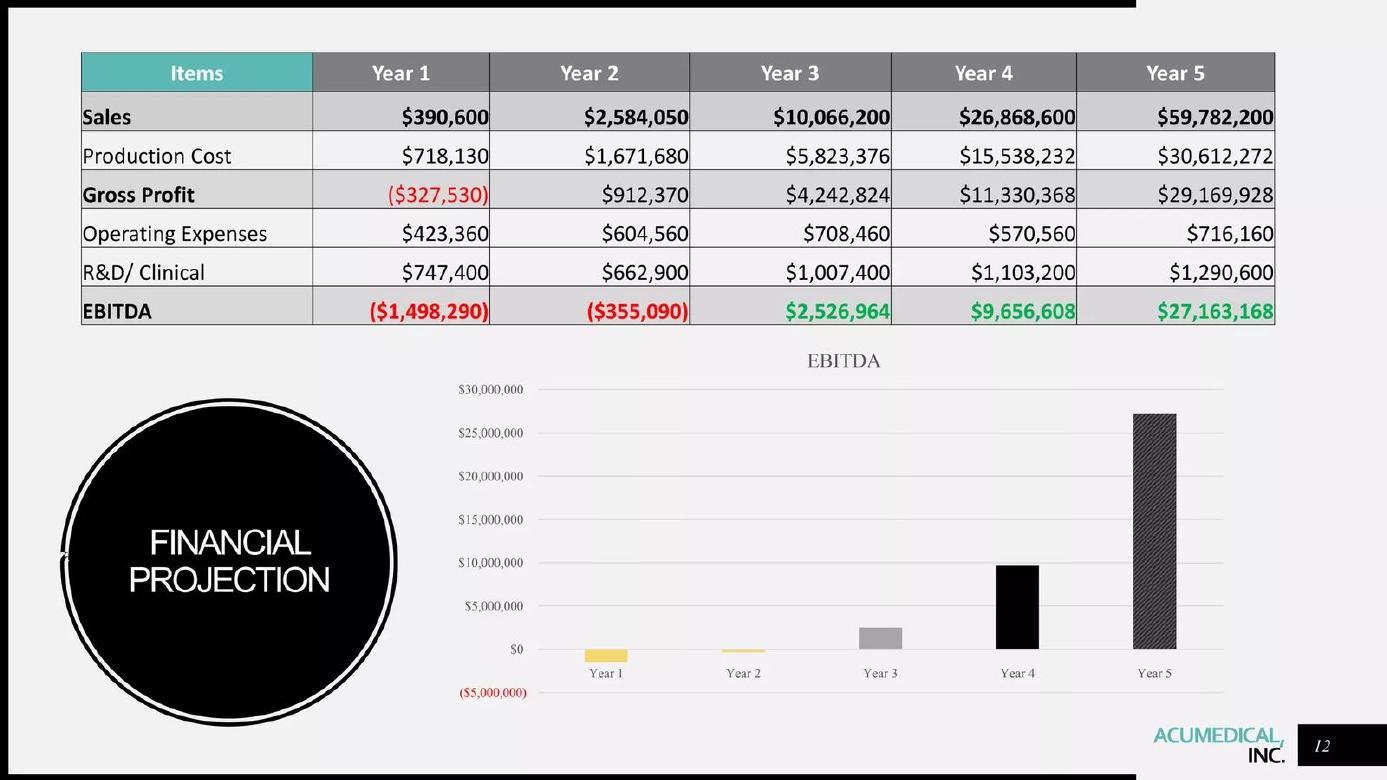
AcuMedical deck, slide 12. Exact stored slide matched to this analysis.
Our analysis: Splits research and clinical costs from general running costs; every column adds up.
Evidence and limitation: Running costs that stay flat while revenue soars.
What a founder can adapt: Grow operating costs in line with a 150-fold rise in sales.
Supporting analysis
What the deck claims: Five years: sales $390,600 to $59,782,200; operating expenses $423,360 to $716,160; R&D and clinical $747,400 to $1,290,600; EBITDA minus $1,498,290 to $27,163,168.
Presentation choice: Splits research and clinical costs from general running costs; every column adds up.
When it does not fit: Running costs that stay flat while revenue soars.
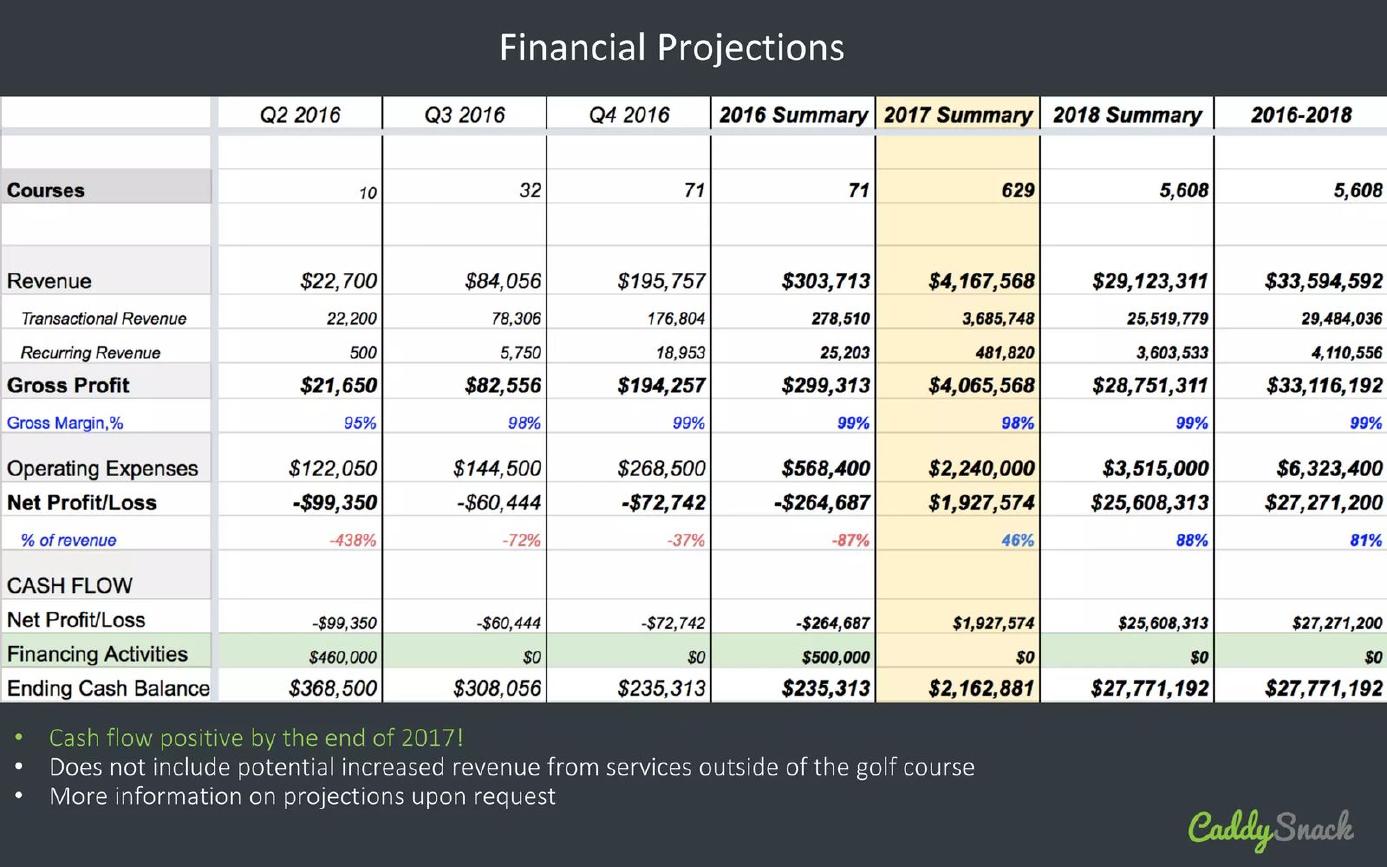
CaddySnack deck, slide 16. Exact stored slide matched to this analysis.
Our analysis: Shows costs every quarter beside revenue, courses and cash.
Evidence and limitation: Profit figures that do not follow from the costs (off by $1,050 in Q2 2016).
What a founder can adapt: Make net profit equal gross profit less operating expenses.
Supporting analysis
What the deck claims: Q2 2016: revenue $22,700, gross profit $21,650, operating expenses $122,050, net loss $99,350. 2016: operating expenses $568,400, net loss $264,687. 2018: operating expenses $3,515,000, net profit $25,608,313 (88%).
Presentation choice: Shows costs every quarter beside revenue, courses and cash.
When it does not fit: Profit figures that do not follow from the costs (off by $1,050 in Q2 2016).
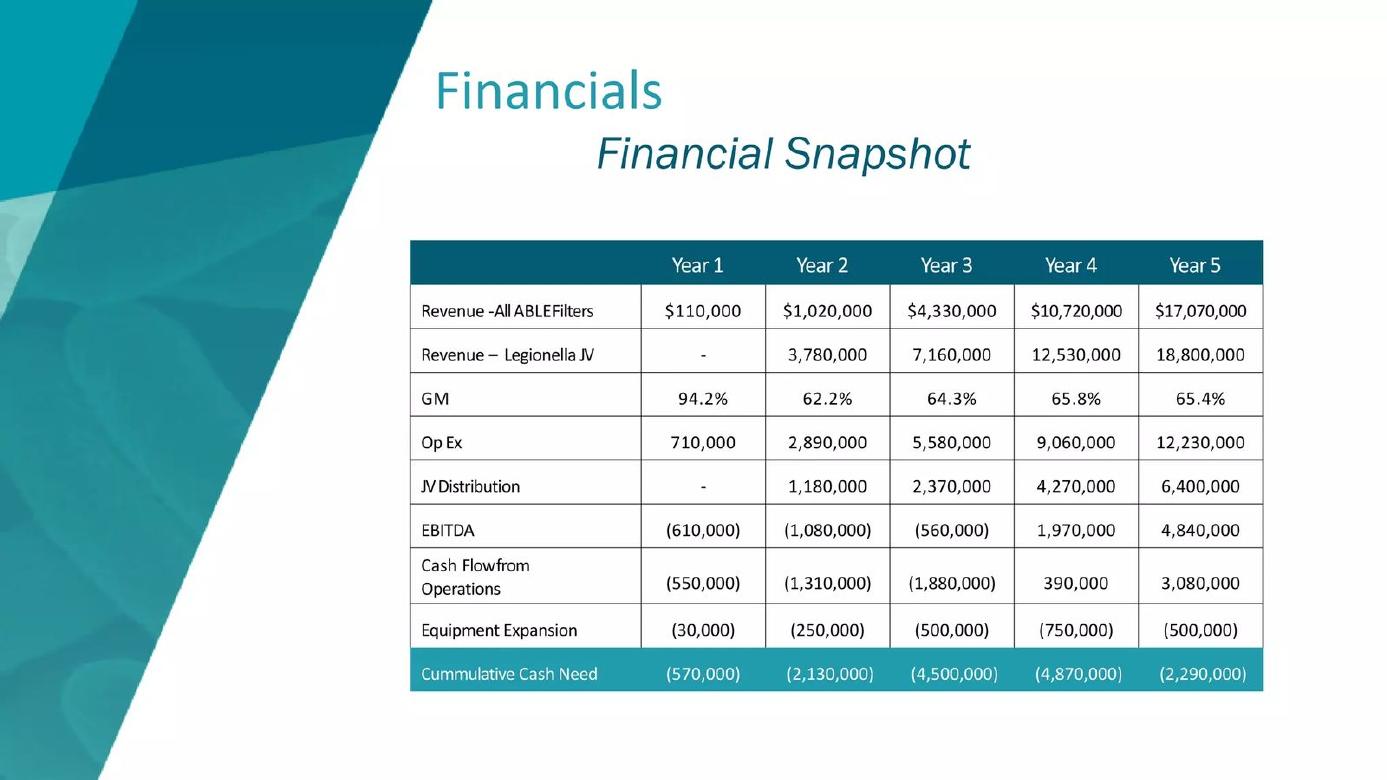
AbleLife deck, slide 11. Exact stored slide matched to this analysis.
Our analysis: Costs grow with revenue, and the table ends with the cash the plan needs.
Evidence and limitation: One expense row that hides what drives the growth.
What a founder can adapt: Break the expense line into its main parts.
Supporting analysis
What the deck claims: Five-year snapshot: operating expenses $710,000, $2,890,000, $5,580,000, $9,060,000, $12,230,000; cumulative cash need peaks at $4,870,000 in year 4.
Presentation choice: Costs grow with revenue, and the table ends with the cash the plan needs.
When it does not fit: One expense row that hides what drives the growth.
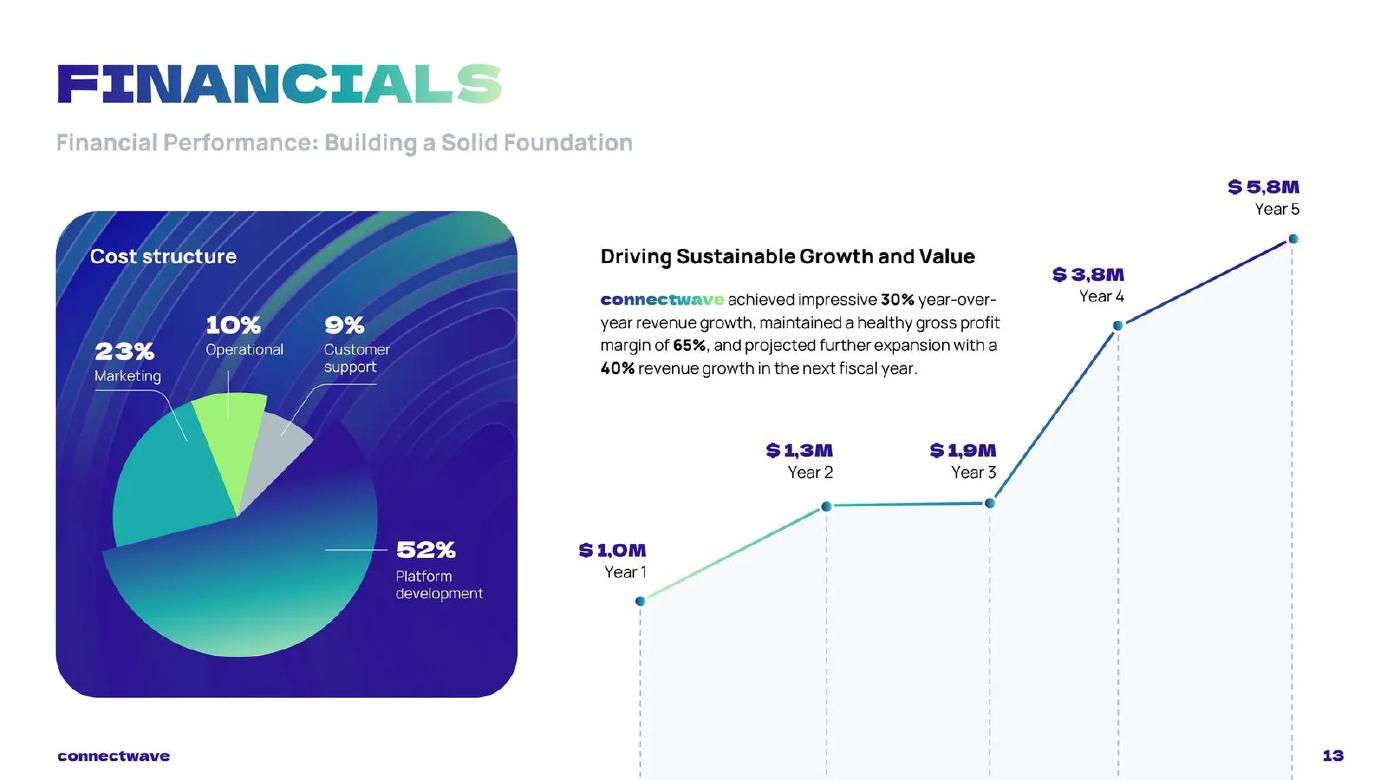
ConnectWave deck, slide 13. Exact stored slide matched to this analysis.
Our analysis: Shows which cost dominates, at a glance.
Evidence and limitation: A pie that sums to 94%.
What a founder can adapt: Make the slices total 100% and give an amount.
Supporting analysis
What the deck claims: Cost structure: platform development 52%, marketing 23%, operational 10%, customer support 9%. Revenue $1.0M in year 1 to $5.8M in year 5.
Presentation choice: Shows which cost dominates, at a glance.
Sales assistant app, projections for 2018 to 2020.
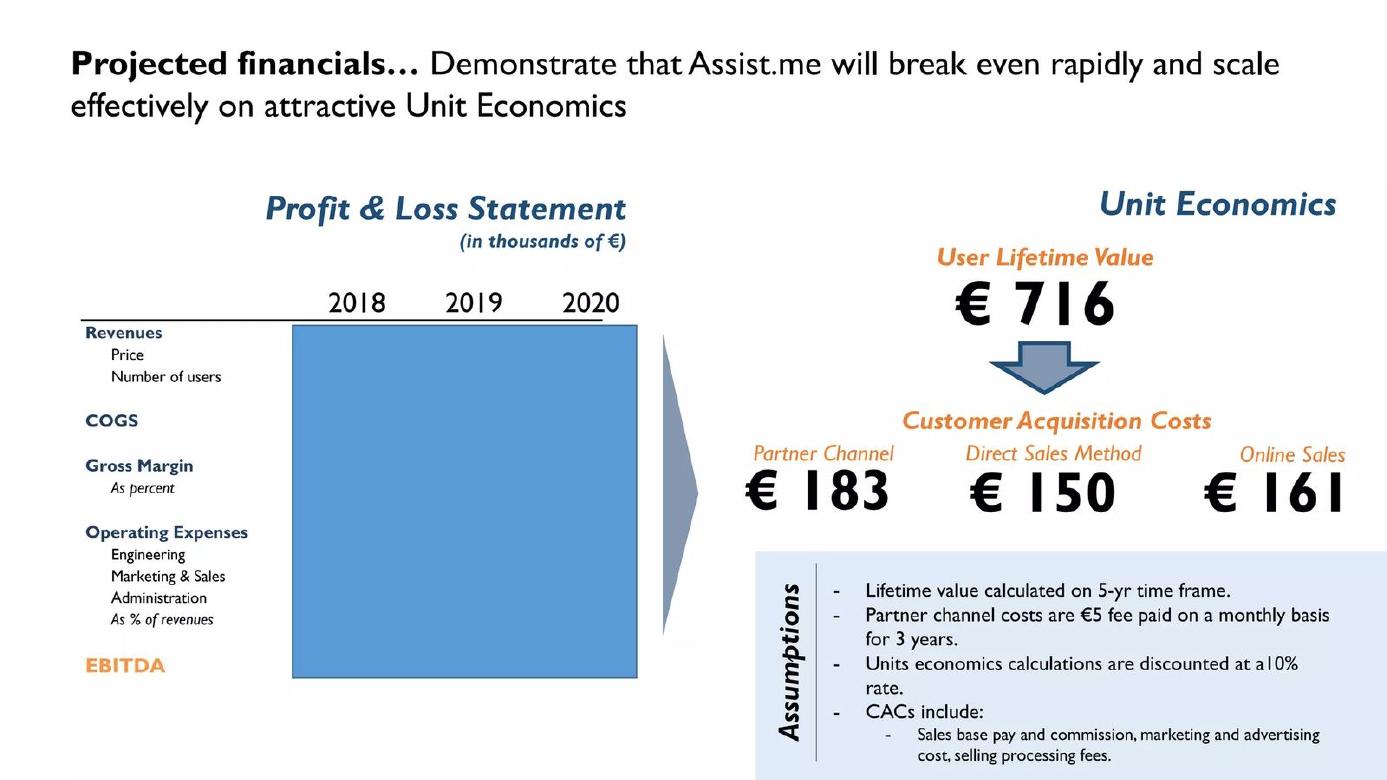
Assist.me deck, slide 26. Exact stored slide matched to this analysis.
Our analysis: The row labels are a good template for a cost breakdown.
Evidence and limitation: An empty table that promises numbers.
What a founder can adapt: Show the figures or leave the table out.
Supporting analysis
What the deck claims: Profit and loss rows: revenues, COGS, gross margin, operating expenses (engineering, marketing and sales, administration, % of revenue), EBITDA. Figures covered by a blank box. CAC: partner €183, direct €150, online €161.
Presentation choice: The row labels are a good template for a cost breakdown.
When it does not fit: An empty table that promises numbers.
Few slides give named lines, a total, a driver and arithmetic that checks.
Example
Named cost lines
Total shown
Tied to headcount
Arithmetic checks
DW Apps
5
Yes
No
Yes
Databricks
1 combined
Per quarter
Yes
Yes
AcuMedical
2
Via EBITDA
No
Yes
CaddySnack
1
Per quarter
No
No (net loss)
AbleLife
1
Per year
No
Not checked
ConnectWave
4 (%)
No
No
No (94%)
Assist.me
3 labels
Hidden
No
Hidden
Key Takeaways
List four to six named cost lines with a total, not one opaque figure.
Use the same periods for costs as for revenue, and make every column add up.
Tie the biggest cost, usually people, to a headcount figure.
Make costs grow in a way that fits the revenue plan.
If you show percentages, make them total 100%.
Test your cost slide before you send it
Answer these with numbers, even if they are estimates.
Lines. What are your four to six biggest cost lines?
Driver. How many people does each year's salary line pay for?
Totals. Does every column add up to its total?
Shape. Do costs grow in a way that fits your revenue plan?
Runway. How much cash is left at the end of each period?
Copyable framework: Year [n]: people [amount] for [n] staff; marketing [amount]; software [amount]; office and admin [amount]; legal [amount]; total [amount]; cash at year end [amount]
Illustrative example 1 — written by us
Before: Cost structure: platform development 52%, marketing 23%, operational 10%, customer support 9%.
After: Year 1 costs [total]: platform development [amount] ([n] engineers), marketing [amount], operations [amount], customer support [amount], other [amount]; shares total 100%
What improved: Our illustrative rewrite, not ConnectWave's text. Bracketed parts are placeholders, not company facts. It anchors the shares to a total and closes the 6% gap.
What this guide covers
Most pitch decks show revenue in detail and costs as an afterthought. Yet an investor reading your financials slide needs both halves. Revenue tells them how big the business could be; costs tell them how much money you will burn to get there, what you will spend their investment on, and whether your margins can ever reach what you claim.
This guide is about operating expenses, the running costs of the business: salaries, rent, marketing, software, legal fees, travel, research. It is not about the cost of making each unit you sell (covered in our cost-at-volume and contribution margin guides), nor about how the funding round itself will be spent (covered in our use-of-funds guide). Our main financials guide and its scenarios guide do not cover cost structure on its own.
We searched the corpus for operating expenses, cost structure and expense breakdowns near a figure, read each candidate from images of the original deck pages, and kept seven slides from seven companies that were private when they made their decks. We checked the arithmetic on every table.
Start with a short list of named lines and a total
The simplest useful cost slide is a list. DW Apps, an app accelerator, gives its annual budget in a six-row table: staff $155,000, rent and utilities $17,400, events and marketing $67,500, legal and admin $37,000, travel $20,000, and total operating expenses $296,900. The five lines add up exactly to the total. Nothing else is on the slide.
That table answers the questions an investor asks first. What is the biggest cost? Staff, at a little over half the budget. What does a year cost? About $297,000. Is anything surprising? Events and marketing at $67,500 is large for a small organisation, which is a fair thing to ask about, and the slide makes the question easy to spot.
What the slide lacks is any link to the people or results behind the costs. $155,000 of staff could be two senior people or five juniors. A single extra column, with the number of people or what each line pays for, would make the table far more useful. But as a starting point, five named lines with a correct total beat any pie chart.
Tie spending to headcount and time
For most startups people are the biggest cost, so the most useful cost slide ties spending to the number of people. Databricks, in its Series A deck from 2013, gives a Projected Budget table with eight quarters from Q3 2013 to Q2 2015. The rows are employees, CapEx and OpEx, cost of goods sold, revenue, profit and balance.
Headcount rises from 8 to 11, 15, 20, 25, 30, 35 and 40. Spending rises with it, from $440,000 a quarter to $2,505,000. Revenue starts at zero and reaches $5,000,000 in Q2 2015. The rows work: in Q3 2013 zero revenue less $440,000 of spending gives a loss of $440,000, and the balance of $9,560,000 is the $10,000,000 Series A less that loss. In Q2 2014, $200,000 of revenue less $240,000 of cost of goods and $1,275,000 of spending gives the printed loss of $1,315,000. In Q2 2015, $5,000,000 less $2,500,000 less $2,505,000 gives the printed loss of $5,000.
Because the table runs to a final balance, an investor can see exactly how long $10,000,000 lasts: the balance falls to $1,762,500 by Q2 2015, just as the business nears break-even. Below the table the slide states the assumption and the goal, over 500 customers and well over $10M a year in revenue by the Series B. One weakness: capital spending and operating spending are combined in one row, so an investor cannot see how much goes on equipment versus people.
Split costs into lines that mean something for your business
AcuMedical, which makes an electro-acupuncture device, shows five years of figures in a table with sales, production cost, gross profit, operating expenses, research and clinical costs, and EBITDA. Separating research and clinical costs from general operating expenses makes sense for a medical device company, because clinical trials and regulatory clearances are a large and lumpy cost that investors want to see on their own.
Every column adds up. In year 1, sales of $390,600 less production cost of $718,130 gives a gross loss of $327,530, and subtracting operating expenses of $423,360 and research and clinical costs of $747,400 gives the printed EBITDA of minus $1,498,290. In year 5, $59,782,200 less $30,612,272 gives gross profit of $29,169,928, and subtracting $716,160 and $1,290,600 gives the printed $27,163,168.
The arithmetic is right; the shape is the problem. Sales grow about 150 times over the five years, while operating expenses go from $423,360 to $716,160, and actually fall in year 4 to $570,560. A company selling $60M of devices a year would need a sales team, support, quality staff and offices far larger than one spending $423,000 a year. Costs that stay flat while revenue soars are the most common reason investors distrust a projection, and the clean arithmetic makes the gap easier, not harder, to spot.
Make sure costs and profit agree
CaddySnack, an on-demand food delivery app for golf courses, gives quarterly figures for 2016 plus summaries for 2017, 2018 and the three years together. Rows show courses signed, revenue split into transactional and recurring, gross profit, operating expenses, net profit or loss, financing and ending cash.
The revenue split adds up: in Q2 2016, transactional $22,200 plus recurring $500 gives $22,700; for 2016 as a whole, $278,510 plus $25,203 gives $303,713. But the profit line does not follow from the costs. In Q2 2016, gross profit of $21,650 less operating expenses of $122,050 is a loss of $100,400; the slide prints $99,350. For 2016, $299,313 less $568,400 is a loss of $269,087; the slide prints $264,687. The gaps are small, but an investor who checks one column and finds it does not add up will doubt the rest.
The other lesson is again about shape. Operating expenses rise from $568,400 in 2016 to $3,515,000 in 2018 while revenue rises to $29,123,311, which leaves a net margin of 88%. Very few businesses of any kind keep 88 cents of every dollar of revenue. If your projection shows margins like that, either your costs are missing lines or you need to explain why your business is the exception.
One line is better than none, but only just
AbleLife, a water filter company, puts operating expenses as a single row in a five-year financial snapshot: $710,000 in year 1, then $2,890,000, $5,580,000, $9,060,000 and $12,230,000. The rest of the table shows revenue from filters and a joint venture, gross margin, a joint venture distribution, EBITDA, cash flow, equipment spending and cumulative cash need.
The slide does something useful: costs grow with revenue, and the table ends with the cumulative cash need, peaking at $4,870,000 in year 4, which tells an investor how much money the plan requires. But a single expense row hides everything that matters. Is the growth people, marketing, or plant? An investor will ask for the breakdown, and you should have it ready, ideally as a second table in the appendix.
Percentages must add up too
ConnectWave shows its cost structure as a pie chart: platform development 52%, marketing 23%, operational 10% and customer support 9%. Those add up to 94%, not 100%. Either a slice is missing or the figures are wrong, and either way a reader notices. The slide also gives no amounts, so the pie says only how costs would be shared, not how large they are.
Percentages can be useful when your total is uncertain or confidential, but they need a total to anchor them, even a rough one, and they must sum to 100%. A pie with four slices and no amount gives an investor almost nothing to check.
Do not hide the numbers
Assist.me, a sales assistant app, shows a profit and loss statement for 2018 to 2020, in thousands of euros, with the right row labels: revenues (price, number of users), cost of goods sold, gross margin, operating expenses split into engineering, marketing and sales, and administration, operating expenses as a percentage of revenue, and EBITDA. The figures themselves are covered by a solid blue box.
Whatever the reason, perhaps a version shared publicly, the result is a slide that promises a cost breakdown and delivers none. The row labels are a good template; the slide next to it gives customer acquisition costs per channel, which are useful. But if you are not ready to show your costs, leave the table out rather than show an empty one.
A worked example
Here is a cost slide built the way the strongest examples suggest. All figures are illustrative, not from any company in this guide.
Three years, three columns. Year 1: people $600,000 for 6 staff, marketing $150,000, software and hosting $60,000, office and admin $90,000, legal and accounting $40,000; total $940,000. Year 2: people $1,400,000 for 14 staff, marketing $400,000, software and hosting $120,000, office and admin $160,000, legal and accounting $60,000; total $2,140,000. Year 3: people $2,600,000 for 26 staff, marketing $800,000, software and hosting $220,000, office and admin $280,000, legal and accounting $100,000; total $4,000,000. Each column adds up.
Add revenue in the same columns and a final row for cash at year end, and the slide shows an investor the four things they look for: what the business costs, what drives the cost, how costs grow with the plan, and how long the money lasts.
Common mistakes
One opaque expense line. Break it into four to six named lines.
Columns that do not add up. Check every total and every profit line.
Flat costs, soaring revenue. Grow people and marketing with the plan.
Percentages that miss 100%. Sum the slices and give an amount.
Hidden figures. Show the numbers or drop the table.
Diagnostic checklist
Four to six named cost lines with a total.
Same periods as the revenue figures.
Headcount beside the salary line.
Every column checked.
Cash balance at the end of each period.
Frequently asked questions
How we chose these examples
Corpus: published pitch deck teardowns on StartupFundraising.com. Founder-uploaded private decks are excluded.
Selection (2026-10-01): we searched extracted slide text for operating expenses, cost structure and expense breakdowns near a figure, then read each candidate from images made from the original deck files.
Eligibility: each company was private when its deck was made. CaddySnack (seed, about $130K raised in 2015), AcuMedical (privately held, seed deck) and AbleLife (private company in Atlanta, no listing found) were checked against public sources. Databricks made this deck in 2013 to raise its $10M Series A and was private at the time; we did not search for this one separately. DW Apps, ConnectWave and Assist.me rest on their own decks and the absence of any known listing.
Not used: EcoCompass and 3D Innovate (deck files missing), and decks from companies already listed at the time (including Calix, Clover Health and Arrival).
Arithmetic: DW Apps 155,000 + 17,400 + 67,500 + 37,000 + 20,000 = 296,900; Databricks Q3 2013, Q2 2014 and Q2 2015 profit rows and the first balance match; AcuMedical gross profit and EBITDA match in years 1, 2, 3 and 5; CaddySnack revenue splits match but Q2 2016 and full-year 2016 net loss do not equal gross profit less operating expenses; ConnectWave slices total 94%.
Overlap check: no existing guide covers operating cost structure; the cost-at-volume, contribution margin and use-of-funds guides cover different questions. None of these slides appears in another guide.
Review: all seven slide images were inspected on 2026-10-01 and matched to company, deck and slide number (AI editorial model review). No person has yet completed an editorial review of this page. The worked example uses illustrative figures, not company data.
Figures are the companies' own claims; we did not verify underlying data. We make no claim that any slide caused a fundraising outcome.