Best, Base and Worst Case on a Pitch Deck: Which Assumption
How startups show forecast scenarios on a pitch deck: best, base, worst and sensitivity cases.
How to Show Best, Base and Worst Case Forecasts on a Pitch Deck
Ten slides from real pitch decks that present more than one version of the future: best, realistic and worst case, optimistic and pessimistic, or a sensitivity line under the plan. For each, we record which assumption differs between the cases, whether the cases are stated in the same measure so they can be compared, whether the arithmetic holds, and whether the "worst" case is a genuine downside.
TL;DR
A scenario slide is useful when it changes one or two named assumptions and shows what happens to the numbers an investor cares about: revenue, profit or loss, and cash needed. The cases should be stated in the same units, built from the same model, and the downside should be bad enough to test whether the company survives. A worst case that still looks like a success, or cases that describe different things, add length without adding information.
In this set, Nine Studios lays out three cases line by line and every total reconciles; MxMedia states its sensitivity assumption (30% lower market share) in a footnote; Nutripride sizes its raise on the pessimistic case; UberCab's worst case is honest: a 10-car, 100-client service in San Francisco. The problems: Nine Studios' worse case keeps sales identical and raises wages, while its best case sells more with fewer wages; iReekt's "pessimistic" case grows clients 120-fold and its operating income does not follow from its own lines; the Diabetes Project's worst case needs $50 million and then "being the worst case" $25 million; Synchron Eco calls its base line conservative; Donkidrive's three cases use three different measures.
Scenario slides from real pitch decks
Each example records the exact slide, the cases it shows, which assumption differs, and whether the numbers reconcile. Checks and implied figures are our calculations.
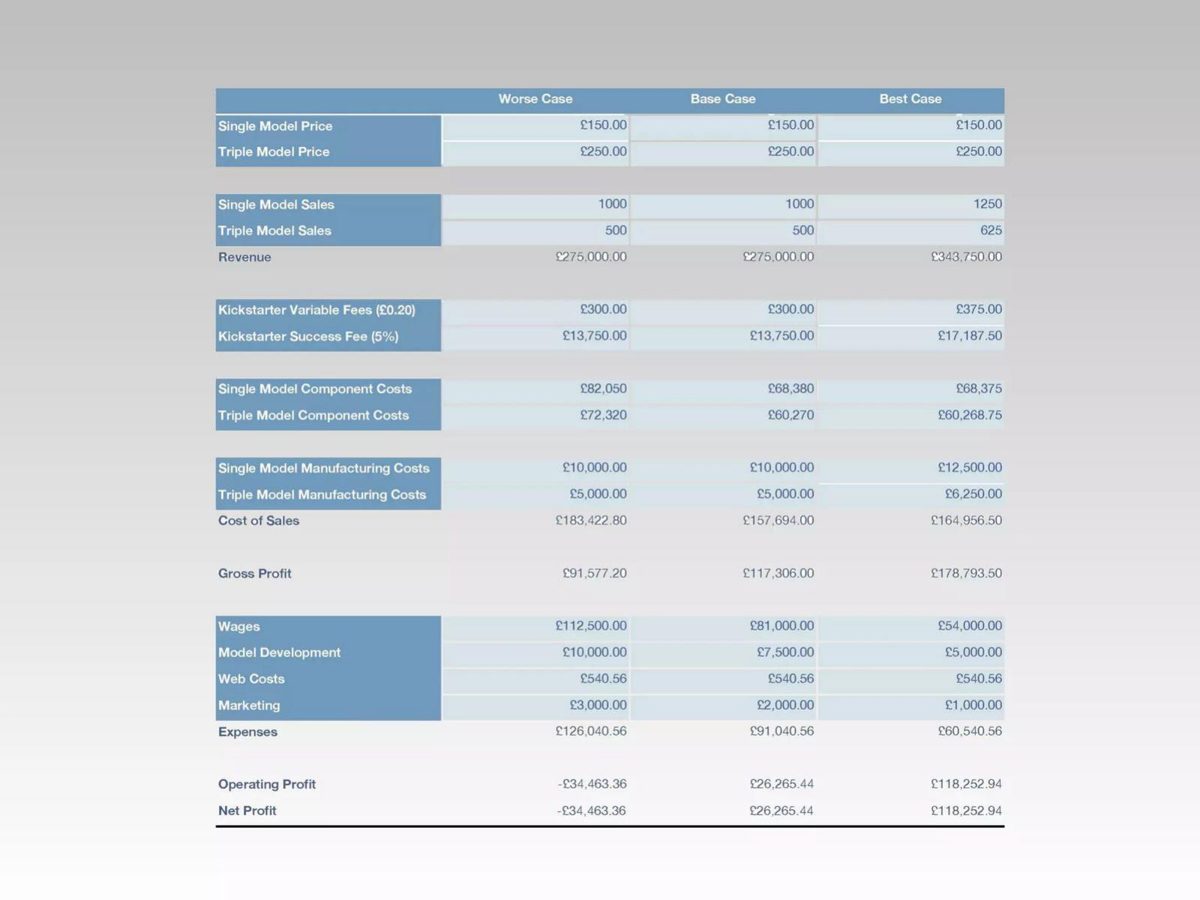
Nine Studios financials slide — slide 23
Hardware product launched on Kickstarter. Three-case model.
Nine Studios deck, slide 23. Exact stored slide matched to this analysis.
Our analysis: Exact arithmetic; the worse case changes costs only, and wages fall as sales rise.
Evidence and limitation: Our checks: revenue, cost of sales, expenses and profit reconcile in every column.
What a founder can adapt: Vary the demand assumption and let costs follow volume.
Supporting analysis
What the deck claims: Same prices in all cases; worse and base 1,000 + 500 units, £275,000; best 1,250 + 625, £343,750; operating profit −£34,463.36, £26,265.44, £118,252.94; wages £112,500, £81,000, £54,000.
Presentation choice: Three cases in identical rows can be read across.
When it does not fit: Don't make the best case cheaper to run than the base.
Media platform across six European markets. 2012 deck.
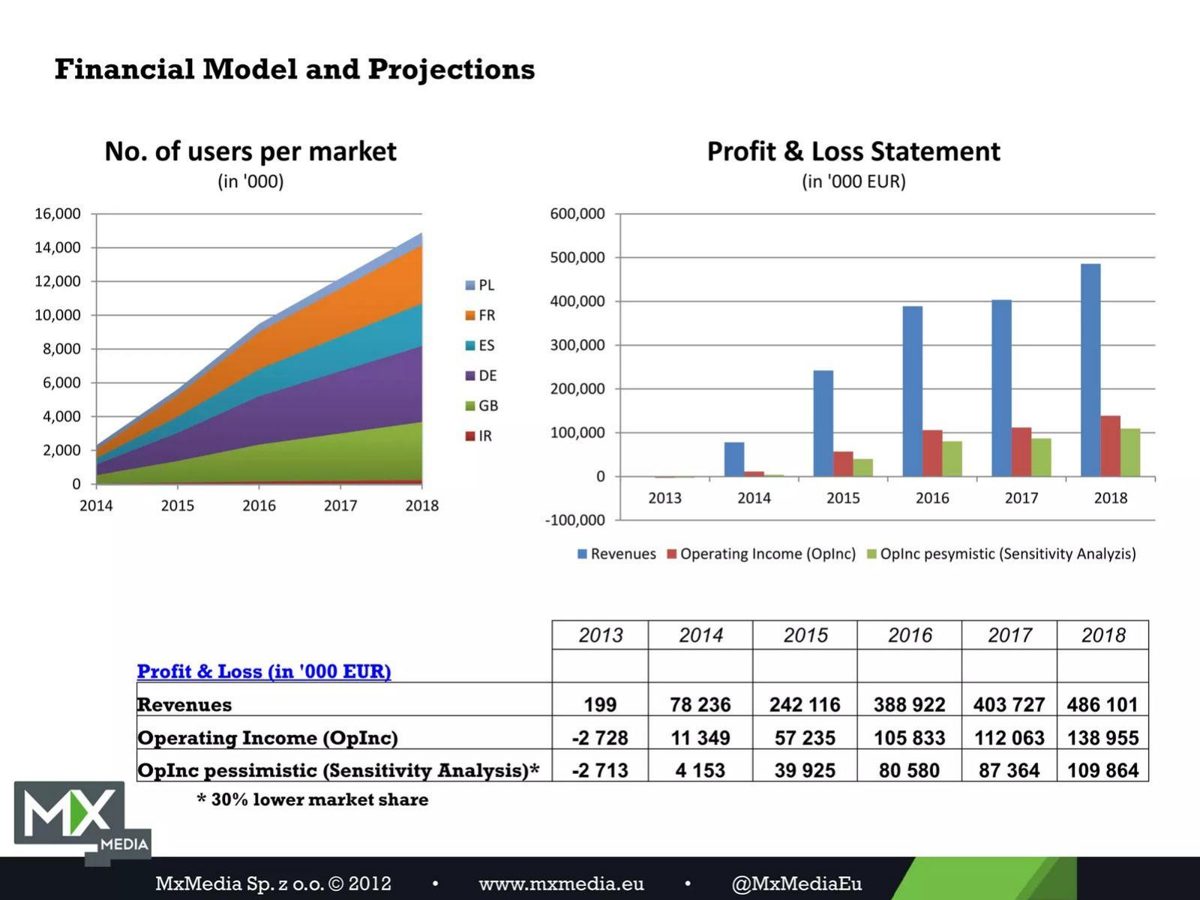
MxMedia deck, slide 8. Exact stored slide matched to this analysis.
Our analysis: Assumption stated; pessimistic revenue and costs not shown.
Evidence and limitation: Our calculation: 2018 operating income falls 21% on a 30% share cut; 2013 pessimistic loss is smaller than base.
What a founder can adapt: Show pessimistic revenue and cash as well as profit.
Supporting analysis
What the deck claims: Revenue €199k (2013) to €486,101k (2018); operating income −€2,728k to €138,955k; pessimistic operating income −€2,713k to €109,864k, *30% lower market share.
Presentation choice: The footnote names the one input that changes.
When it does not fit: Don't let the downside lose less than the base in any year.
Services platform for small enterprises (udyamis). $10M raise.
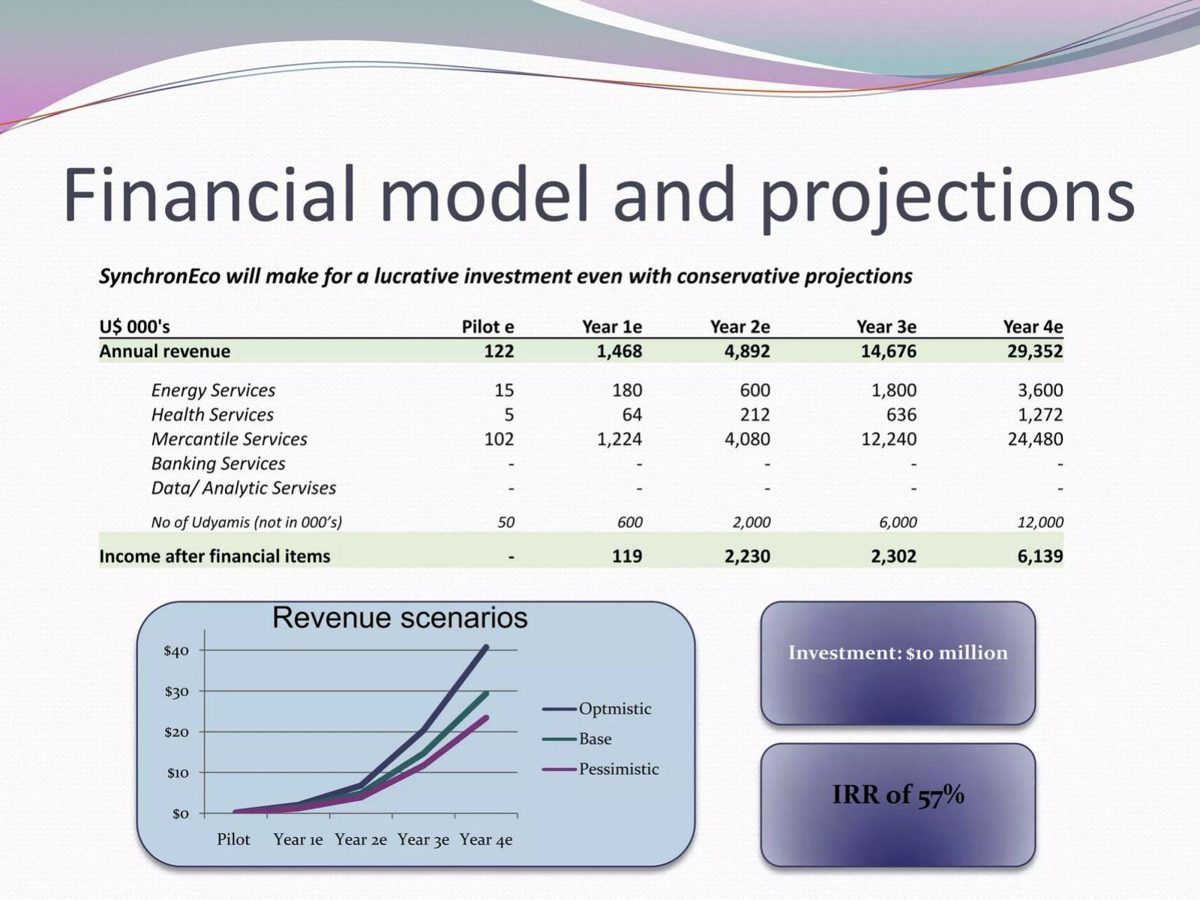
Synchron Eco deck, slide 11. Exact stored slide matched to this analysis.
Our analysis: The "conservative" table is the base case.
Evidence and limitation: Our checks: revenue lines add to each total; year-4 table value matches the base line, not pessimistic.
What a founder can adapt: Label the table's case and state each line's assumption.
Supporting analysis
What the deck claims: "Lucrative investment even with conservative projections"; revenue $122k to $29,352k by year 4; optimistic, base and pessimistic chart lines; IRR of 57%.
Presentation choice: Three lines show the spread at a glance.
When it does not fit: Don't call the base case conservative.
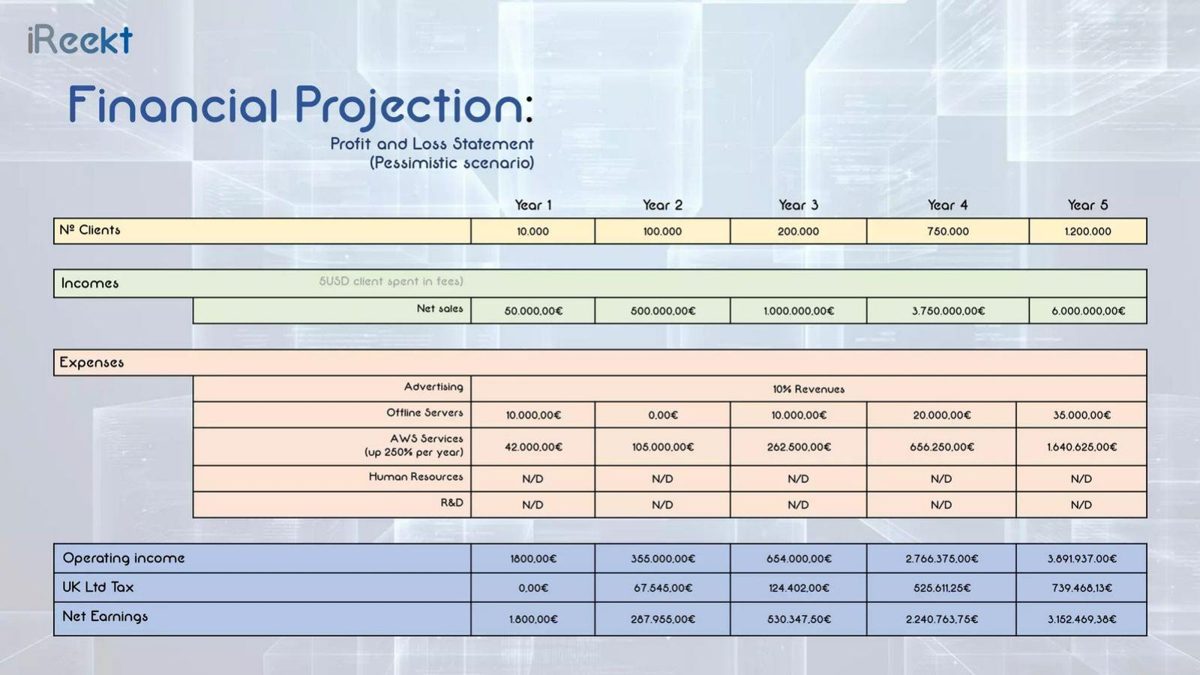
iReekt deck, slide 17. Exact stored slide matched to this analysis.
Our analysis: Neither pessimistic nor reconciled.
Evidence and limitation: Our calculations: year 1 lines give about −€7,000, year 5 about €3,724,375; clients grow 120-fold.
What a founder can adapt: Include all cost lines and a downside growth rate.
Supporting analysis
What the deck claims: Clients 10,000 to 1,200,000; 5 USD per client in fees; net sales €50,000 to €6,000,000; operating income €1,600 to €3,891,937; HR and R&D N/D.
Presentation choice: Shows how a label can contradict the numbers under it.
When it does not fit: Don't leave staff costs out of any case.
The Diabetes Project deck, slide 26. Exact stored slide matched to this analysis.
Our analysis: A worst case that is then softened.
Evidence and limitation: Our checks: revenue derivation is consistent; the worst-case capital figure is halved in the next sentence.
What a founder can adapt: Keep the worst case as the largest capital need.
Supporting analysis
What the deck claims: $80,000 seed for 7 months at about $10,000 a month; 10% of a $600M Virginia market; $30M revenue; worst case needs $50M, then "being the worst case" $25M.
Presentation choice: The prose makes the reasoning visible.
When it does not fit: Don't state a downside and then discount it.
Evidence and limitation: Measures differ across cases; the worst case is a genuinely small outcome.
What a founder can adapt: Keep the honesty, state each case in revenue.
Supporting analysis
What the deck claims: Best: market leader, $1B+ yearly revenue. Realistic: 5% of top 5 US cities, $20-30M+ profit. Worst: a 10-car, 100-client service in SF.
Presentation choice: The worst case describes what failure looks like.
When it does not fit: Don't mix revenue in one case and profit in another.
Donkidrive deck, slide 10. Exact stored slide matched to this analysis.
Our analysis: The range cannot be read.
Evidence and limitation: Three cases in three measures.
What a founder can adapt: State turnover and users in every case.
Supporting analysis
What the deck claims: Best: market leader, online partners. Realistic: turnover R30 million a year, +100% a year. Worst: 1 million users in SA, increasing moderately.
Presentation choice: Shows why consistent units matter.
When it does not fit: Don't describe each case in a different unit.
Columns report what each slide states or leaves out; checks are our calculations.
Example
Type
Assumption stated
Same measures
Reconciles
Real downside
Nine Studios
Model, 3 cases
Implicit in rows
Yes
Yes
Costs only
MxMedia
Sensitivity
30% lower share
Profit only
Partly
Mild
Synchron Eco
Chart, 3 lines
No
Revenue
Table yes
Base called conservative
iReekt
Model, 1 case
No
Yes
No
No, 120x growth
Nutripride
Cash need
No
Cash
Yes
Used to size raise
Diabetes Project
Prose
Partly
Capital
Contradicts itself
Halved
UberCab
Outcomes
Partly
No
Not applicable
Yes
Prolific
Outcomes
Users
Yes
Consistent ARPU
Break-even
Ready Estate
Outcomes
Market share
Yes
Proportional
Still £12M
Donkidrive
Outcomes
No
No
Cannot check
Unclear
Key Takeaways
Change a named assumption. MxMedia's pessimistic line is "30% lower market share".
Keep the same measures across cases. Donkidrive uses leadership, turnover and users.
Make the downside a downside. iReekt's pessimistic clients rise from 10,000 to 1.2 million.
Move costs with volume, not against it. Nine Studios' best case has more sales and lower wages.
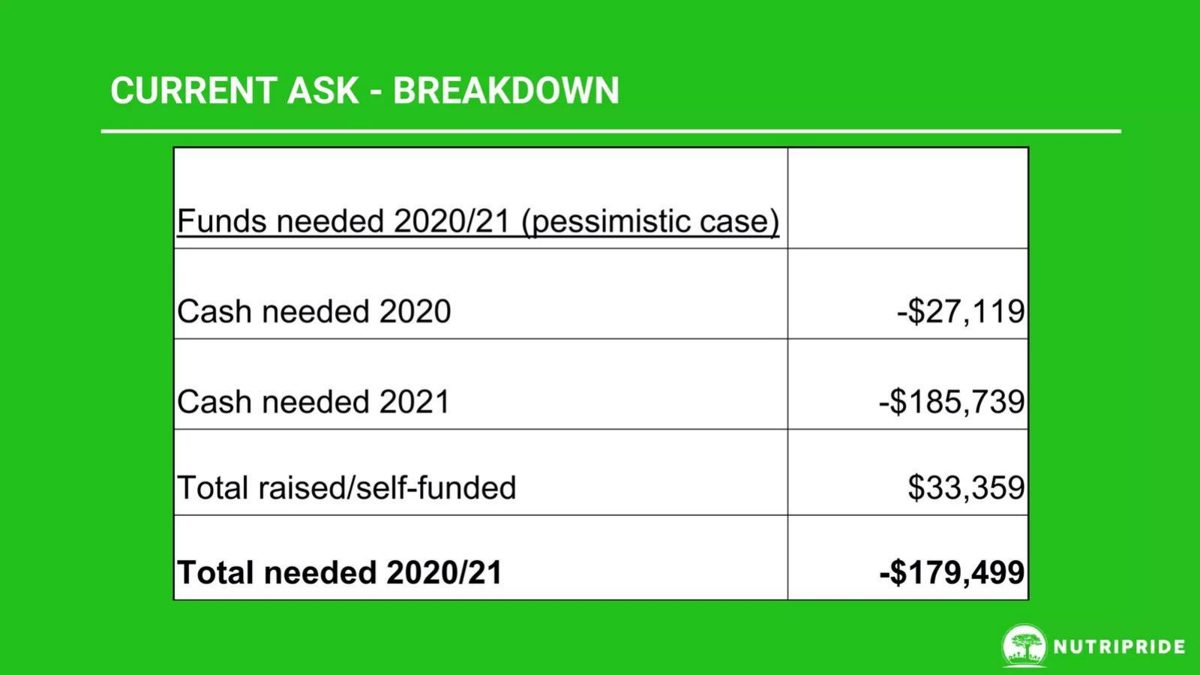
Size the raise on the downside. Nutripride's $179,499 ask comes from its pessimistic case.
Label the base as the base. Synchron Eco's "conservative" table matches its base line.
Build your scenario table
Fill in each field, then check the downside against your raise.
Driver. Which one or two assumptions move the model most?
Values. Low, base and high value for each driver?
Outputs. Revenue, gross profit, operating profit and cash needed per case?
Costs. Do volume-linked costs scale with volume in every case?
Downside. Does the round still reach the next milestone in the low case?
Labels. Is each case named correctly (base is not conservative)?
Copyable framework: Low / base / high: [driver] of [x] / [y] / [z] gives revenue [a] / [b] / [c], operating result [d] / [e] / [f], cash needed [g] / [h] / [i]; the round covers the low case to [milestone].
Illustrative example 1 — written by us
Before: Worst case: 1 million users in SA increasing moderately
After: Worst case: [users] users and R[turnover] turnover in year 3, against 1 million users and R30 million in the realistic case.
What improved: Illustrative template for Donkidrive's cases in one measure; the bracketed values are for the company to supply.
Why investors ask for scenarios
Every startup forecast is wrong; the question is how wrong and in which direction. A single projection hides which assumptions carry it. Scenarios expose them: if the base case needs 10% market share and the downside assumes 5%, the reader learns that market share is the swing factor and can judge it directly. The most useful output of a scenario slide is not the best case but the gap between cases and the reason for it.
Investors use the downside in particular for one question: does the company run out of money before it can fix the problem? That is why a downside should be expressed in the same measures as the plan, including cash, and why it should be genuinely adverse. A worst case in which revenue still grows every year and profit arrives on schedule tells the reader only that the founders did not want to show a bad outcome.
Scenario slides come in two forms. Model scenarios run the same spreadsheet with different inputs and show the outputs side by side, as Nine Studios and MxMedia do. Outcome scenarios describe where the company could end up in words, often on a "potential outcomes" slide, as UberCab, Prolific, Ready Estate and Donkidrive do. Both can be useful. The first is checkable; the second is only useful if each outcome is stated in the same measure so the range can be read.
Model scenarios: what changes between cases
Nine Studios' page 23 is a full three-column model for a Kickstarter product launch. Prices are identical in all cases: single model £150, triple model £250. Worse and base cases both assume 1,000 single and 500 triple sales, giving £275,000 of revenue; the best case assumes 1,250 and 625, giving £343,750. Our checks: 1,000 × £150 + 500 × £250 is £275,000; 1,250 × £150 + 625 × £250 is £343,750; the base case cost of sales, gross profit £117,306, expenses £91,040.56 and operating profit £26,265.44 all reconcile, as does the worse case loss of £34,463.36. The arithmetic is exemplary. The scenario design is not. The worse case changes nothing on the revenue side; it assumes higher component costs (£82,050 and £72,320 against £68,380 and £60,270) and wages of £112,500 against £81,000. The best case sells 25% more and pays £54,000 in wages, a third less than the base. A reader would expect wages to rise, not fall, with volume. The more useful downside for a crowdfunding launch is fewer backers, which the table never tests.
MxMedia's page 8, "Financial Model and Projections", shows revenues rising from €199k in 2013 to €486,101k in 2018, operating income from −€2,728k to €138,955k, and a third row, "OpInc pessimistic (Sensitivity Analysis)*", from −€2,713k to €109,864k, with the footnote "*30% lower market share". Stating the assumption is the right thing, and it is rare in this set. Two details need explaining. First, only operating income is given for the pessimistic case; if revenue falls 30%, 2018 revenue would be about €340,271k (our calculation), yet operating income falls only 21% (from €138,955k to €109,864k), which implies costs fall almost as fast as revenue. Second, in 2013 the pessimistic loss (−€2,713k) is smaller than the base loss (−€2,728k).
Synchron Eco's page 11, "Financial model and projections", is headed "SynchronEco will make for a lucrative investment even with conservative projections". The table shows annual revenue of $122k (pilot), $1,468k, $4,892k, $14,676k and $29,352k in year 4, with energy, health and mercantile services lines that add exactly to each total (our checks), and a count of udyamis rising from 50 to 12,000. A "Revenue scenarios" chart shows optimistic, base and pessimistic lines ending around $40M, $29M and $23M in year 4 (read from the chart). The table's $29.4M matches the base line, not the pessimistic one, so the "conservative" label describes the middle case. The chart gives no assumptions for any line, and the 57% IRR on a $10 million investment beside it does not say which case it uses.
iReekt's page 17, "Financial Projection: Profit and Loss Statement (Pessimistic scenario)", projects 10,000 clients in year 1, 100,000 in year 2, 200,000, 750,000 and 1,200,000 in year 5, at "5 USD client spent in fees", giving net sales of €50,000 to €6,000,000. Our checks: clients × 5 gives each net sales figure. But a 120-fold increase in clients over five years is not a pessimistic assumption by most standards, and the fee is stated in dollars while the sales are in euros. The operating income does not follow from the lines shown: year 1 net sales of €50,000 less 10% advertising (€5,000), offline servers €10,000 and AWS €42,000 is a loss of about €7,000, against the €1,600 profit shown; year 5 comes to about €3,724,375 against €3,891,937 (our calculations). Human resources and R&D are "N/D" in every year, so the largest costs of a software company are absent from its downside.
Downside cases used to size the raise
Nutripride's page 27, "Current Ask - Breakdown", is the clearest use of a downside in the set: "Funds needed 2020/21 (pessimistic case)": cash needed 2020 −$27,119, cash needed 2021 −$185,739, total raised or self-funded $33,359, total needed 2020/21 −$179,499. Our check: −$27,119 − $185,739 + $33,359 is −$179,499. Sizing the round on the pessimistic cash need is what investors hope to see, because it means the money lasts even if sales disappoint. The slide would be stronger with one line saying what the pessimistic case assumes, since the reader cannot tell how far it is from the plan.
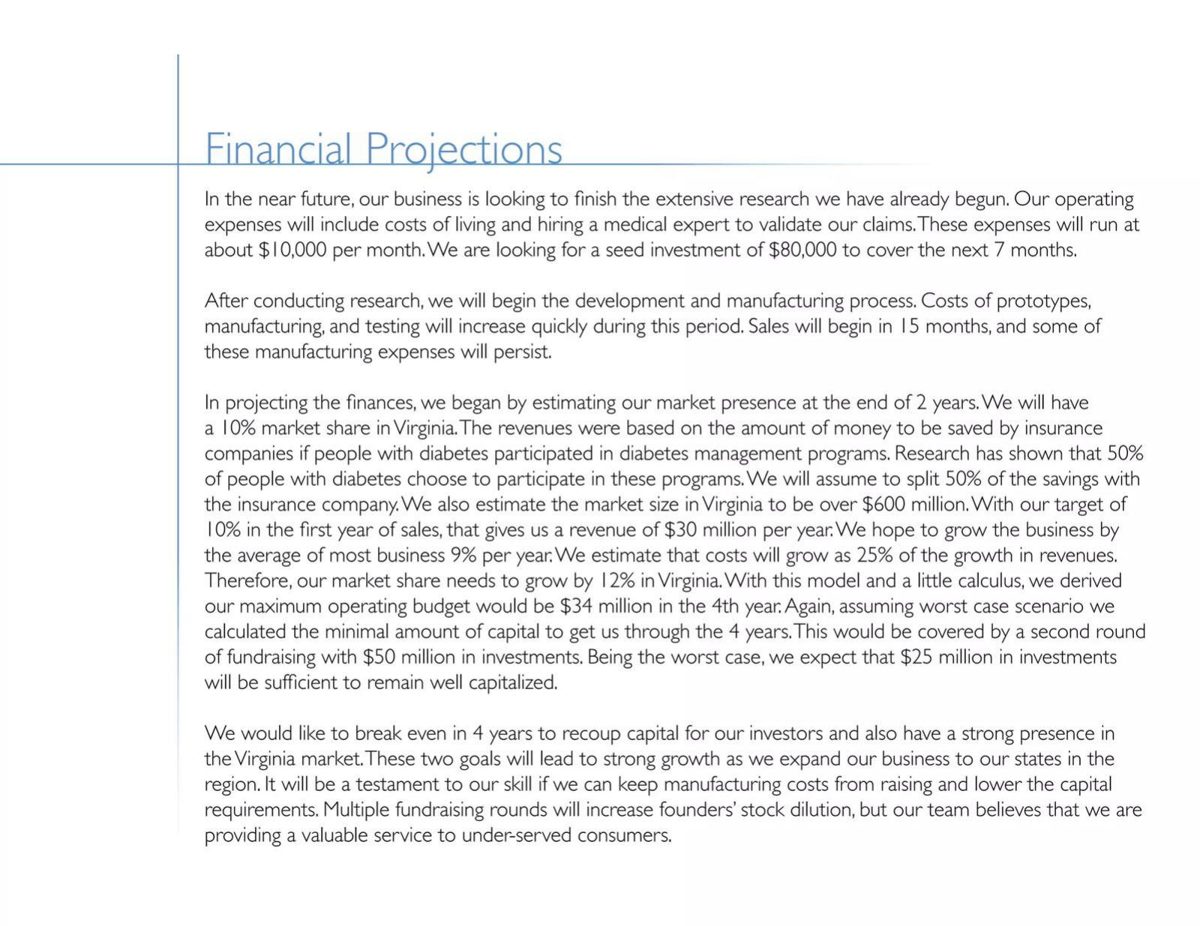
The Diabetes Project's page 26, "Financial Projections", is prose. It seeks $80,000 to cover the next seven months at about $10,000 a month of expenses, targets 10% market share in a Virginia market estimated at over $600 million, and derives revenue of $30 million a year from splitting insurer savings 50/50. Our checks: seven months at $10,000 is $70,000, leaving about $10,000 of headroom; 10% of $600 million is $60 million, halved by the savings split to $30 million, which is consistent. The difficulty is the downside: "assuming worst case scenario we calculated the minimal amount of capital to get us through the 4 years. This would be covered by a second round of fundraising with $50 million in investments. Being the worst case, we expect that $25 million in investments will be sufficient". The worst case should be the largest capital requirement, not the one the founders then halve.
Outcome scenarios: range, honesty and consistent measures
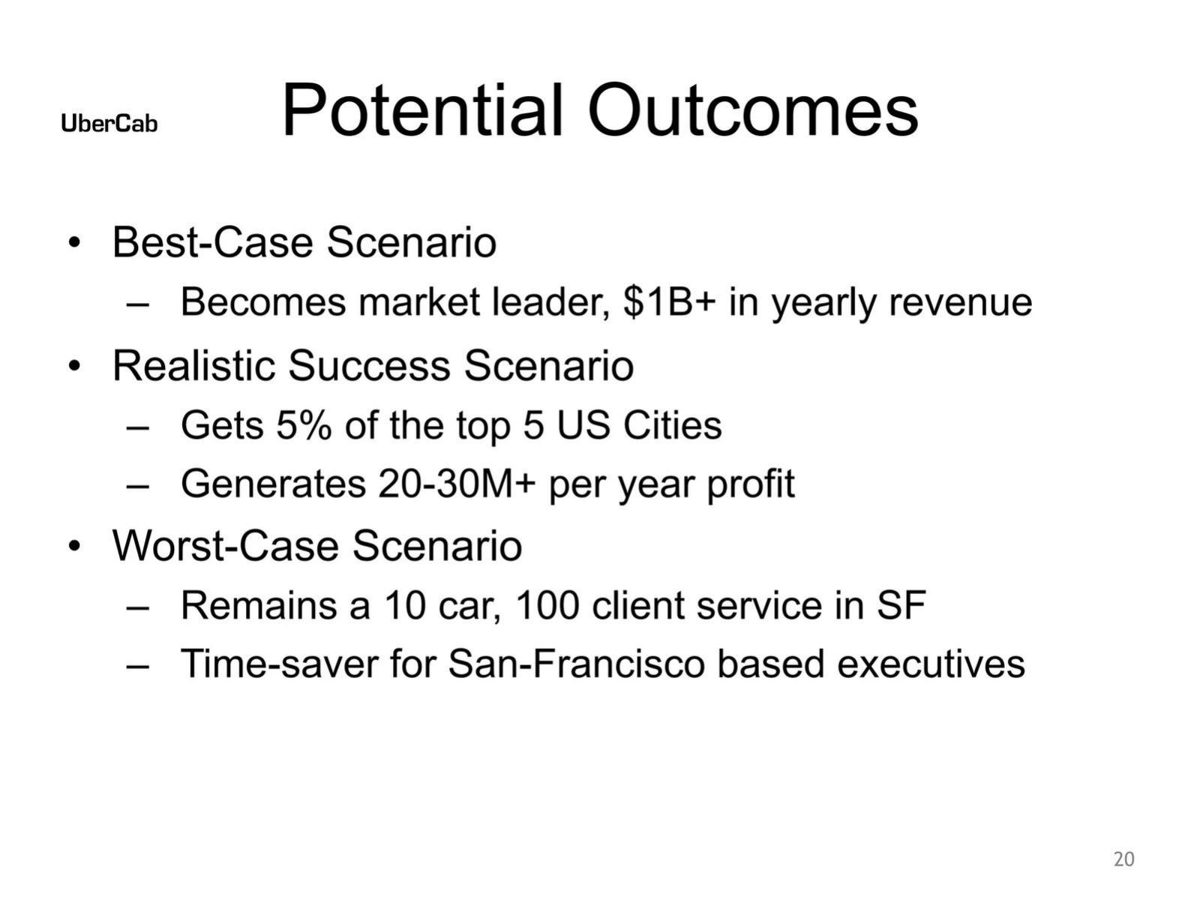
UberCab's page 20, "Potential Outcomes", from the company's first deck, lists a best case ("Becomes market leader, $1B+ in yearly revenue"), a realistic success case ("Gets 5% of the top 5 US Cities; Generates 20-30M+ per year profit") and a worst case ("Remains a 10 car, 100 client service in SF; Time-saver for San-Francisco based executives"). The measures differ (revenue, share and profit, cars and clients), which weakens comparison, but the worst case is honest in a way most are not: it describes a small business that survives rather than a slightly smaller success.
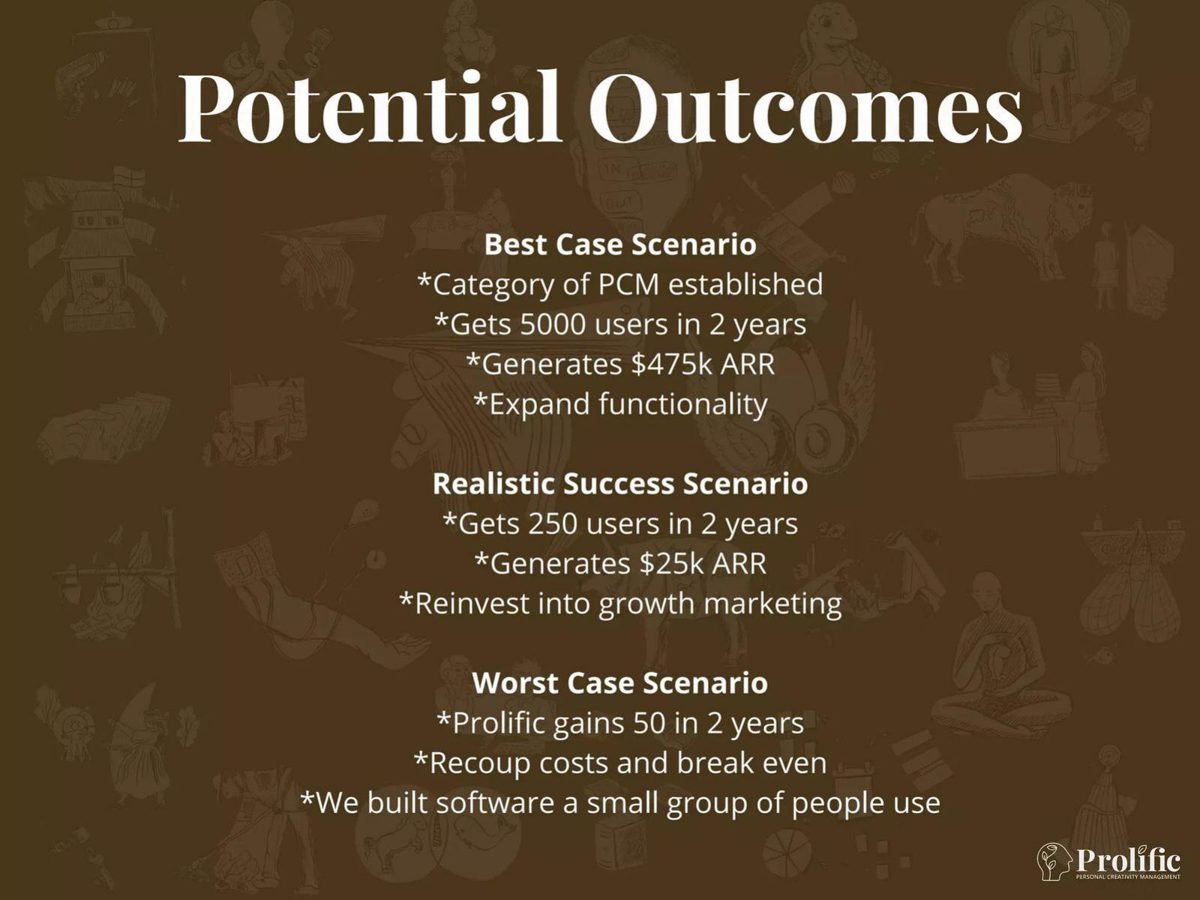
Prolific's page 65, "Potential Outcomes", uses the same structure with consistent measures: best case 5,000 users and $475k ARR in two years, realistic 250 users and $25k ARR, worst 50 users and "recoup costs and break even". Our calculation: both ARR figures imply about $95 to $100 per user per year, so the cases differ in one assumption, user count, which is the right design. The spread is wide: the best case is 20 times the realistic one, which tells the investor that adoption is the entire question.
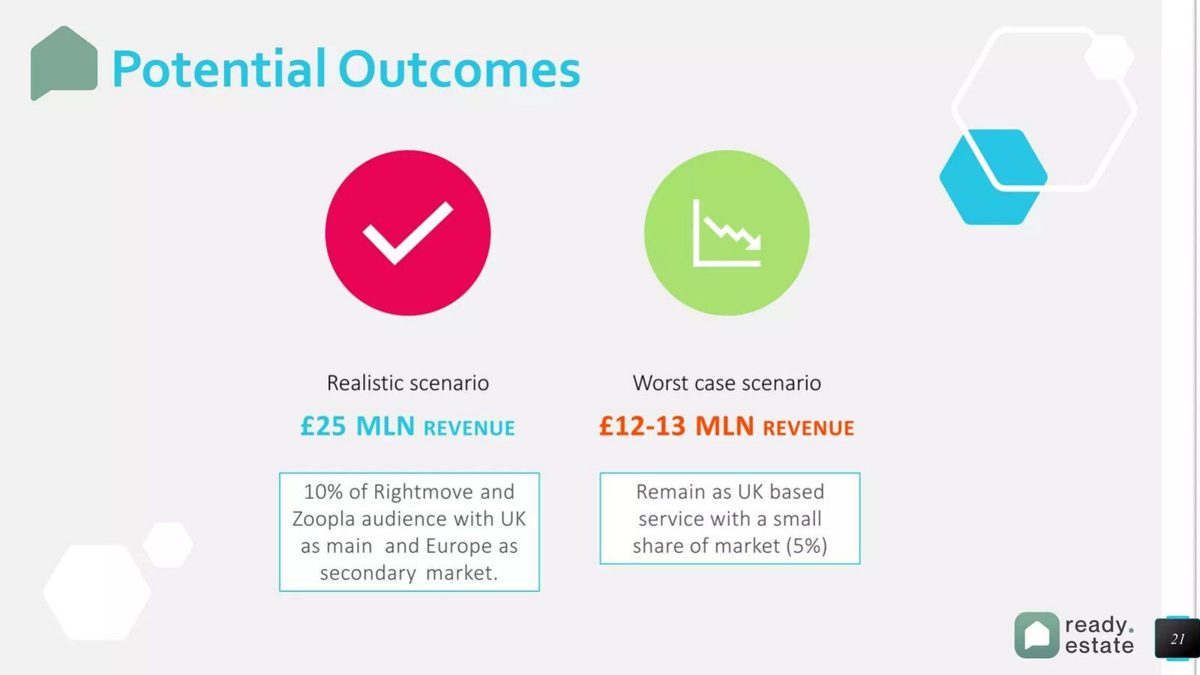
Ready Estate's page 21, "Potential Outcomes", gives a realistic scenario of £25 million revenue ("10% of Rightmove and Zoopla audience with UK as main and Europe as secondary market") and a worst case of £12-13 million revenue ("Remain as UK based service with a small share of market (5%)"). Both are in revenue and each names its share assumption, so the cases can be compared. The worst case is simply half the realistic one, which follows from halving the share; a worst case that still produces £12 million of revenue is not a downside an investor can use to test survival.
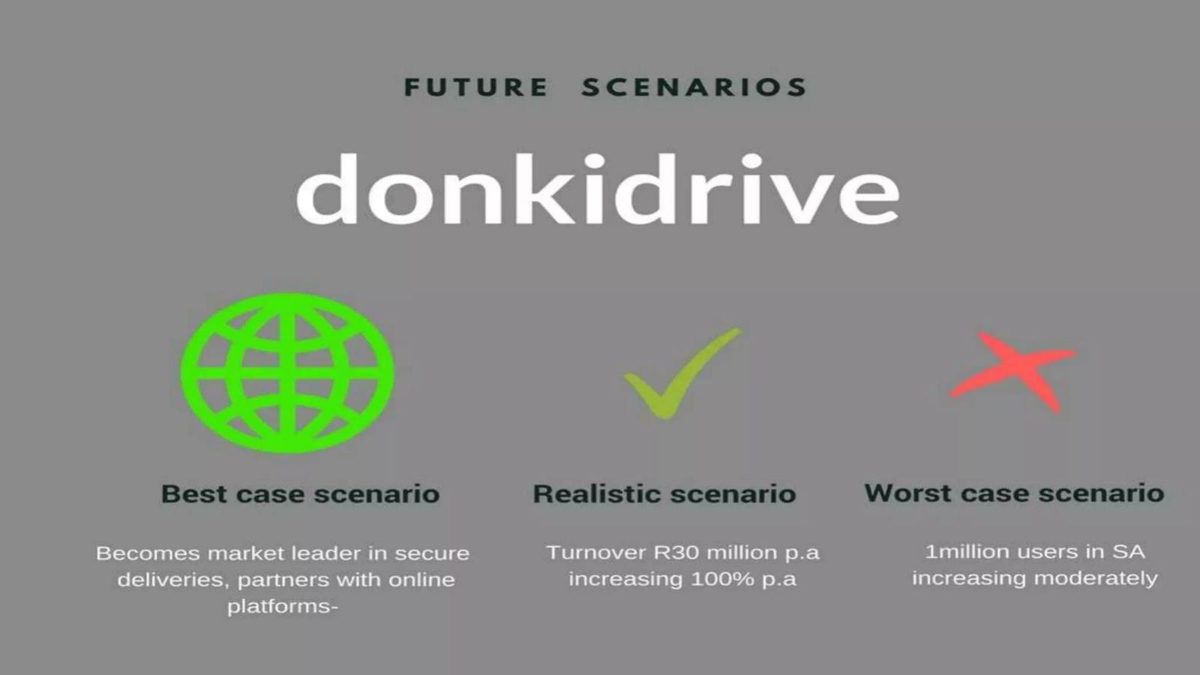
Donkidrive's page 10, "Future Scenarios", gives a best case ("Becomes market leader in secure deliveries, partners with online platforms"), a realistic case ("Turnover R30 million p.a increasing 100% p.a") and a worst case ("1million users in SA increasing moderately"). The three cases are in three different measures: position, turnover and users. Without turnover for the worst case or users for the realistic one, the reader cannot tell how far apart they are, or whether 1 million users is below or above what R30 million of turnover requires.
How to build a scenario slide investors can use
Pick the one or two assumptions that drive the model: usually customer volume, conversion or market share, and sometimes price or a major cost. Run the same model with low, base and high values for those inputs only, and show the outputs side by side in the same rows: revenue, gross profit, operating profit, and cash required. State each case's input values in a line above the table, as MxMedia does in its footnote. Keep costs that scale with volume scaling with volume in every case.
Make the downside a real downside. It should be the case in which the key assumption disappoints enough to matter, and the slide should show whether the round still reaches the next milestone. Nutripride's approach of sizing the raise on the pessimistic cash need is the model. If the downside is still profitable on schedule, say so and show why; otherwise readers will assume it was softened.
For outcome scenarios, keep the measures identical across cases: users and ARR in each, as Prolific does, or revenue and share in each, as Ready Estate does. Then check the labels: the table you call conservative should be the pessimistic case, and the IRR you quote should say which case it comes from.
Common mistakes
No stated assumption. Name what differs between cases.
Different units per case. Use the same outputs in every case.
Downside still a success. Test survival, not a smaller win.
Costs move against volume. Scale variable costs with sales.
Mislabelled base. Don't call the base conservative.
Softened worst case. Keep the largest need as the worst case.
Diagnostic checklist
Each case states the assumption that differs.
All cases show the same outputs, including cash.
The downside is genuinely adverse.
Costs that scale with volume scale in every case.
The raise covers the downside to the next milestone.
Labels (conservative, base, pessimistic) match the numbers.
Frequently asked questions
Should a pitch deck show best and worst case forecasts?
It helps when the cases change a named assumption and show cash. MxMedia's 30% lower market share and Nutripride's pessimistic cash need are useful; cases in different measures, like Donkidrive's, are not.
What should change between scenarios?
The one or two inputs that drive the model, usually volume or market share. Prolific varies users at a constant revenue per user; Nine Studios varies costs while holding sales fixed, which misses its main risk.
How bad should the worst case be?
Bad enough to test whether the company survives. UberCab's 10-car, 100-client service is a real downside; Ready Estate's £12-13M revenue is not.
Which case should the raise be based on?
The downside, so the money lasts if sales disappoint. Nutripride sizes its $179,499 need on its pessimistic case.
How do I check my own scenario slide?
Recompute each case from its inputs, confirm costs move with volume, and check labels. iReekt's operating income and Synchron Eco's "conservative" label both fail these checks.
How we chose these examples
Search (2026-09-30): the durable corpus index (docs/seo/artifacts/corpus-search, 70,729 unique pages, deduplicated by deck-file sha256 + page) was searched for base case, bear case, bull case, downside case, worst case, best case, conservative case, optimistic case and pessimistic (76 pages). Listed-company, mining, energy, fund, sports-franchise and acquisition decks were excluded, as were uses of "best case" describing product performance.
Thirteen candidate pages were selected; twelve were rendered from the original public deck files and read from the images; ten are used: Nine Studios 23, MxMedia 8, Synchron Eco 11, iReekt 17, Nutripride 27, The Diabetes Project 26, UberCab 20, Prolific 65, Ready Estate 21 and Donkidrive 10.
Left out: 1906 page 20 (deck file unavailable); Modzify 18 and Call The 10 (already analysed in other guides); Ready Estate 19 (best-case text only, repeating page 21).
Figures are as printed on each slide; values read from charts are approximate, and we did not have the companies' models. How we built this: drafted and checked with AI assistance (editorial model review against the original slide images); no human editor has reviewed this guide.