Burn Rate and Runway on the Ask Slide: What Should
Which figures on an ask slide should reconcile, what a reader needs to check them, and eight real pitch deck slides showing where the arithmetic works.
Does Your Ask Add Up? Reconciling the Raise, Burn and Runway
Eight slides from real pitch decks that state a raise, a monthly burn or a runway. We separate figures that disagree on the slide itself from figures that cannot be checked with what the slide shows.
TL;DR
Raise ÷ monthly burn gives a runway only under stated assumptions: the burn is net cash burn (spending minus revenue), it stays constant, there is no other cash in the bank, and the whole raise is spent monthly rather than partly on one-off costs, hires that start later or a reserve. Few slides state those assumptions, so a simple division is a question to answer, not proof of an error.
Two kinds of problem appear in these eight slides. An arithmetic mismatch is visible on the slide itself: Casting to the People's line items total $2.93M against a $3M heading, and Project Travel's allocation adds to 95%. An unreconciled figure is one the slide gives no way to explain: M&A Nexus states $15k of monthly burn for 15 months, which accounts for $225K of a $500K ask and leaves $275K unexplained on the slide. Only Merge's slide reconciles completely.
Burn and runway slides from real pitch decks
Each example shows the exact page from the original public deck above its analysis and links to the full teardown. Figures are the companies' own; calculations are ours and labelled. Page numbers are PDF pages.
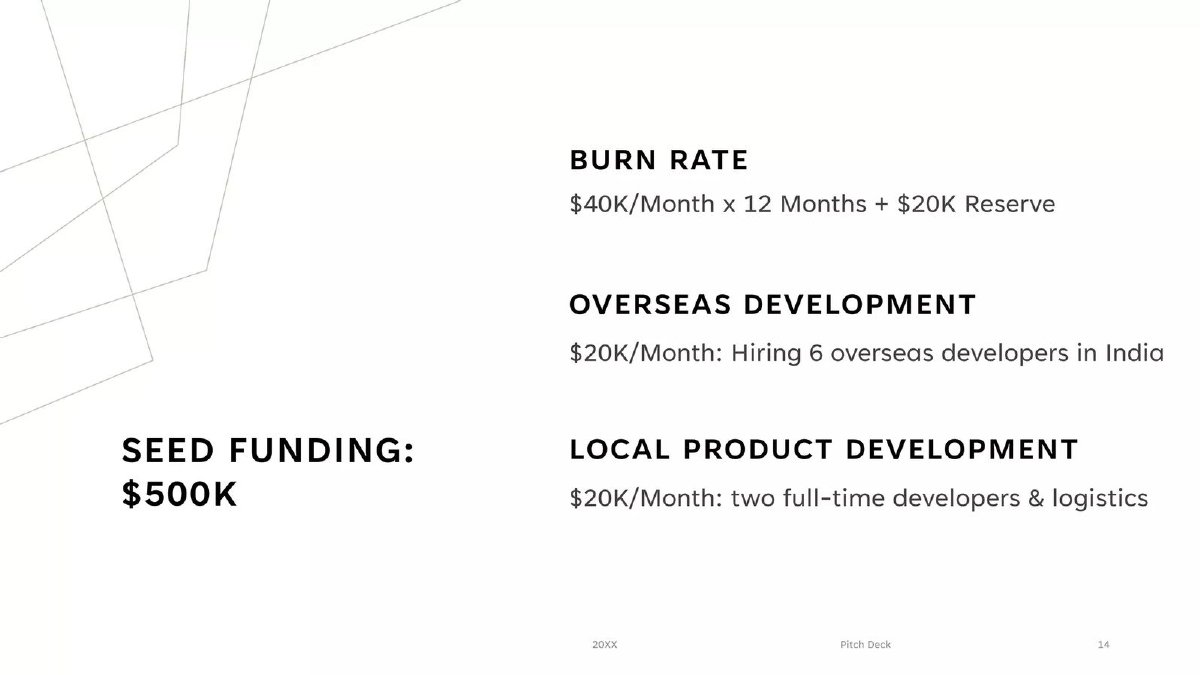
Merge ask slide — slide 14
Early-stage software company. Final slide of a 14-page deck.
Merge deck, slide 14. Exact stored slide matched to this analysis.
Our analysis: Every number reconciles: $40K × 12 + $20K = $500K, and the two $20K lines make up the $40K. A reader can check the plan in seconds.
Evidence and limitation: The burn is flat for 12 months with no hiring ramp or revenue, and the slide does not say what the company will have achieved when the money runs out.
What a founder can adapt: Write the raise as burn × months + reserve, then break the monthly burn into its two or three largest lines.
Supporting analysis
What the deck claims: "Seed funding: $500K." "Burn rate: $40K/Month x 12 Months + $20K Reserve." "Overseas development: $20K/Month: Hiring 6 overseas developers in India." "Local product development: $20K/Month: two full-time developers & logistics."
Presentation choice: Every number reconciles: $40K × 12 + $20K = $500K, and the two $20K lines make up the $40K. A reader can check the plan in seconds.
When it does not fit: The burn is flat for 12 months with no hiring ramp or revenue, and the slide does not say what the company will have achieved when the money runs out.
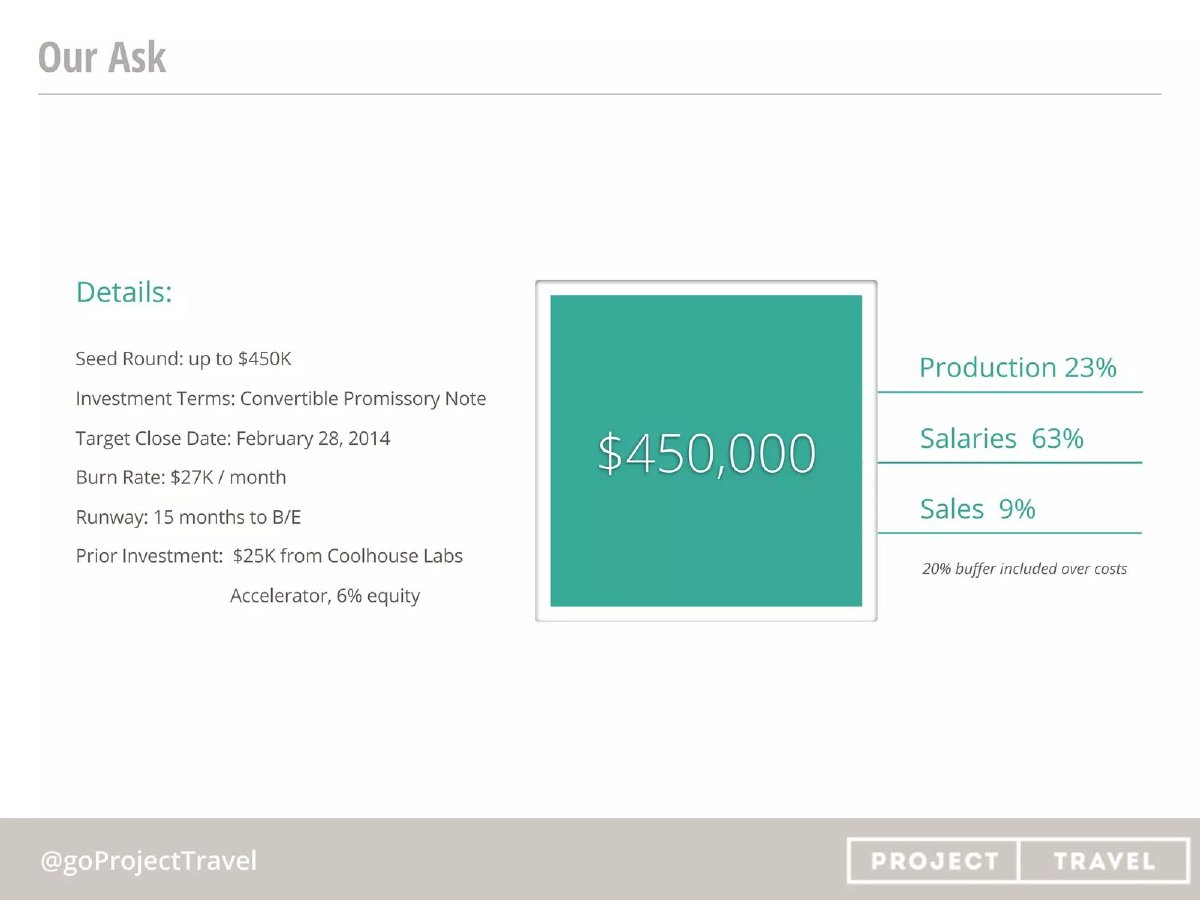
Travel software for educators. "Our Ask" slide, dated to a February 2014 close.
Project Travel deck, slide 13. Exact stored slide matched to this analysis.
Our analysis: Burn, runway and raise are all stated. At a constant $27K a month, $450K would last about 16.7 months (our calculation); the stated 15 months could reflect the 20% buffer, spending that changes, or a smaller raise, and the slide does not say which.
Evidence and limitation: The allocation (Production 23%, Salaries 63%, Sales 9%) adds to 95%; the remaining 5% is not assigned on the slide. "Up to $450K" means a smaller round would change the runway, which the slide does not address.
What a founder can adapt: State burn, runway and raise together, and name the milestone at the end of the runway (here, break-even).
Supporting analysis
What the deck claims: "Seed Round: up to $450K"; "Investment Terms: Convertible Promissory Note"; "Target Close Date: February 28, 2014"; "Burn Rate: $27K / month"; "Runway: 15 months to B/E"; "Prior Investment: $25K from Coolhouse Labs Accelerator, 6% equity". Allocation: "Production 23%", "Salaries 63%", "Sales 9%"; "20% buffer included over costs".
Presentation choice: Burn, runway and raise are all stated. At a constant $27K a month, $450K would last about 16.7 months (our calculation); the stated 15 months could reflect the 20% buffer, spending that changes, or a smaller raise, and the slide does not say which.
When it does not fit: The allocation (Production 23%, Salaries 63%, Sales 9%) adds to 95%; the remaining 5% is not assigned on the slide. "Up to $450K" means a smaller round would change the runway, which the slide does not address.
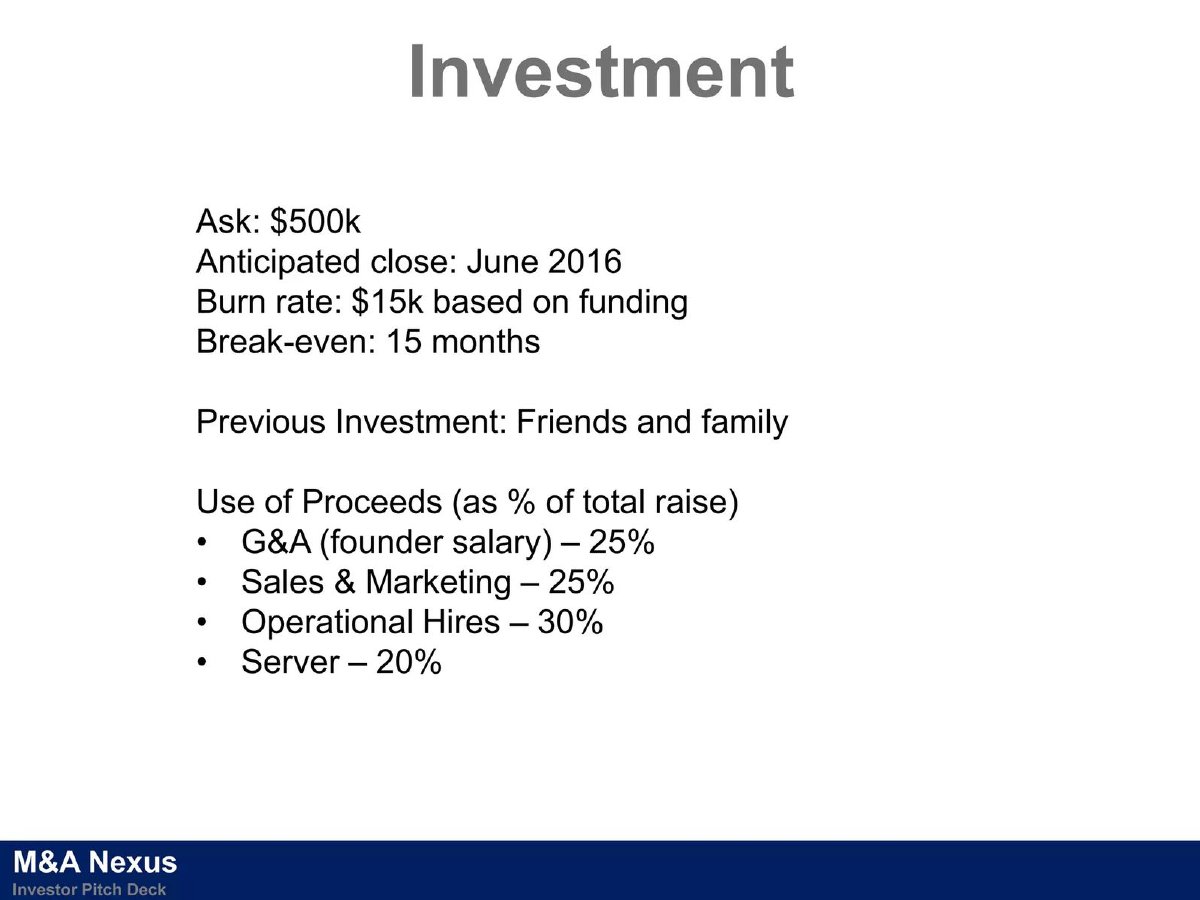
Marketplace for buying and selling small businesses. "Investment" slide.
M&A Nexus deck, slide 13. Exact stored slide matched to this analysis.
Our analysis: By our calculation, $15k a month for 15 months is $225K, leaving $275K of the $500K ask unexplained on this slide. That does not show the ask is wrong: burn may rise with the 30% for operational hires, or part of the raise may be one-off costs or a reserve. The slide gives no way to tell.
Evidence and limitation: "Burn rate: $15k" gives no period (we assume monthly), and "based on funding" is not explained. Other pages of the deck were not checked for this answer.
What a founder can adapt: If break-even arrives before the money runs out, say what the rest of the round is for, or show burn rising as you hire.
Supporting analysis
What the deck claims: "Ask: $500k"; "Anticipated close: June 2016"; "Burn rate: $15k based on funding"; "Break-even: 15 months"; "Previous Investment: Friends and family". Use of proceeds: G&A (founder salary) 25%, Sales & Marketing 25%, Operational Hires 30%, Server 20%.
Presentation choice: By our calculation, $15k a month for 15 months is $225K, leaving $275K of the $500K ask unexplained on this slide. That does not show the ask is wrong: burn may rise with the 30% for operational hires, or part of the raise may be one-off costs or a reserve. The slide gives no way to tell.
When it does not fit: "Burn rate: $15k" gives no period (we assume monthly), and "based on funding" is not explained. Other pages of the deck were not checked for this answer.
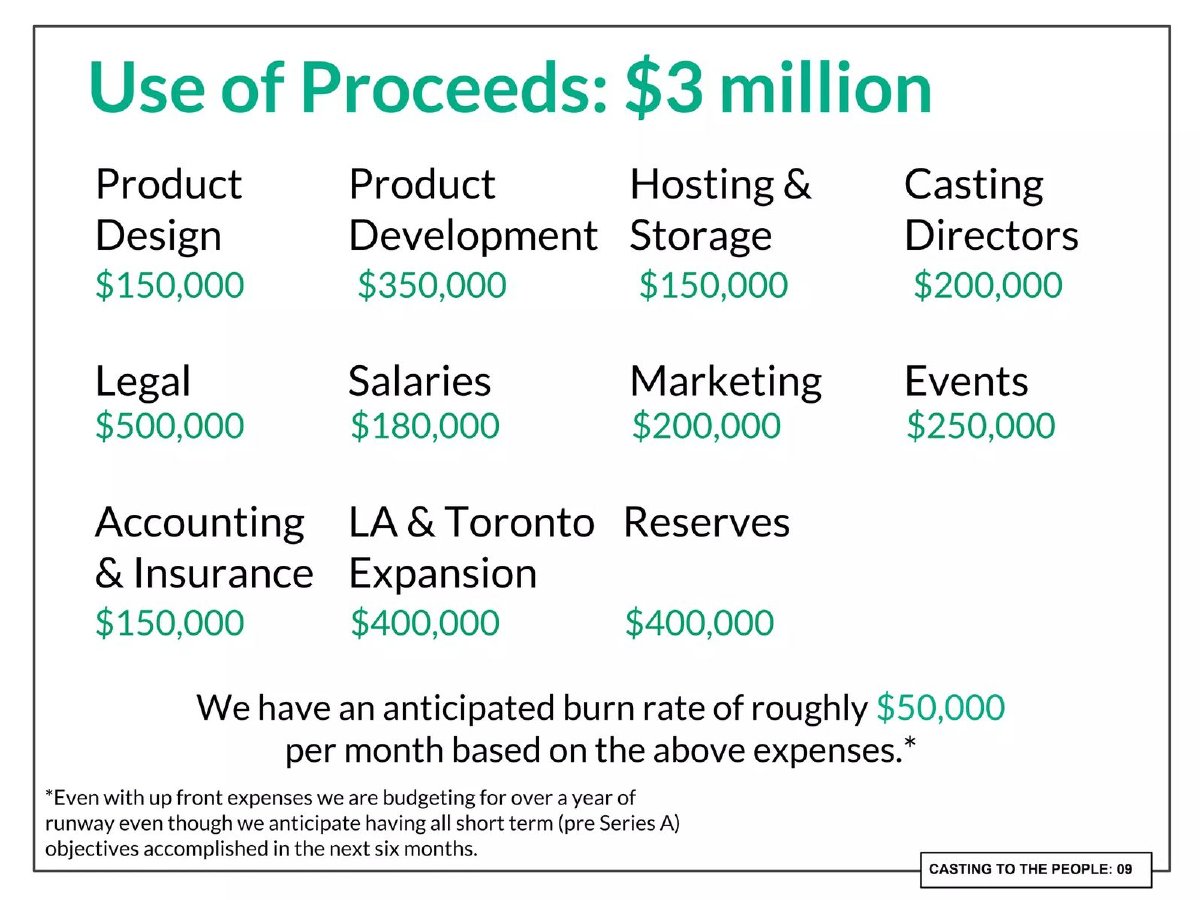
Online casting platform. "Use of Proceeds: $3 million" slide (numbered 09 in the deck, PDF page 10).
Casting to the People deck, slide 10. Exact stored slide matched to this analysis.
Our analysis: A detailed budget makes the check possible. By our calculation the eleven items total $2,930,000; the $3 million headline is $70,000 more. The slide does not say whether the headline is rounded up, whether the $70,000 is unallocated, or whether an item is missing. "Over a year" of runway is consistent with the budget.
Evidence and limitation: The slide says the $50,000 monthly burn is "based on the above expenses" but does not say which items are one-off and which monthly, so the burn cannot be reconciled with the budget from what is shown. Legal ($500,000) is nearly three times salaries ($180,000), also unexplained.
What a founder can adapt: Add the items and make them equal the raise; then show which items are one-off and which are monthly, so the burn follows from the budget.
Supporting analysis
What the deck claims: Eleven line items: Product Design $150,000; Product Development $350,000; Hosting & Storage $150,000; Casting Directors $200,000; Legal $500,000; Salaries $180,000; Marketing $200,000; Events $250,000; Accounting & Insurance $150,000; LA & Toronto Expansion $400,000; Reserves $400,000. "We have an anticipated burn rate of roughly $50,000 per month based on the above expenses." Footnote: "Even with up front expenses we are budgeting for over a year of runway even though we anticipate having all short term (pre Series A) objectives accomplished in the next six months."
Presentation choice: A detailed budget makes the check possible. By our calculation the eleven items total $2,930,000; the $3 million headline is $70,000 more. The slide does not say whether the headline is rounded up, whether the $70,000 is unallocated, or whether an item is missing. "Over a year" of runway is consistent with the budget.
When it does not fit: The slide says the $50,000 monthly burn is "based on the above expenses" but does not say which items are one-off and which monthly, so the burn cannot be reconciled with the budget from what is shown. Legal ($500,000) is nearly three times salaries ($180,000), also unexplained.
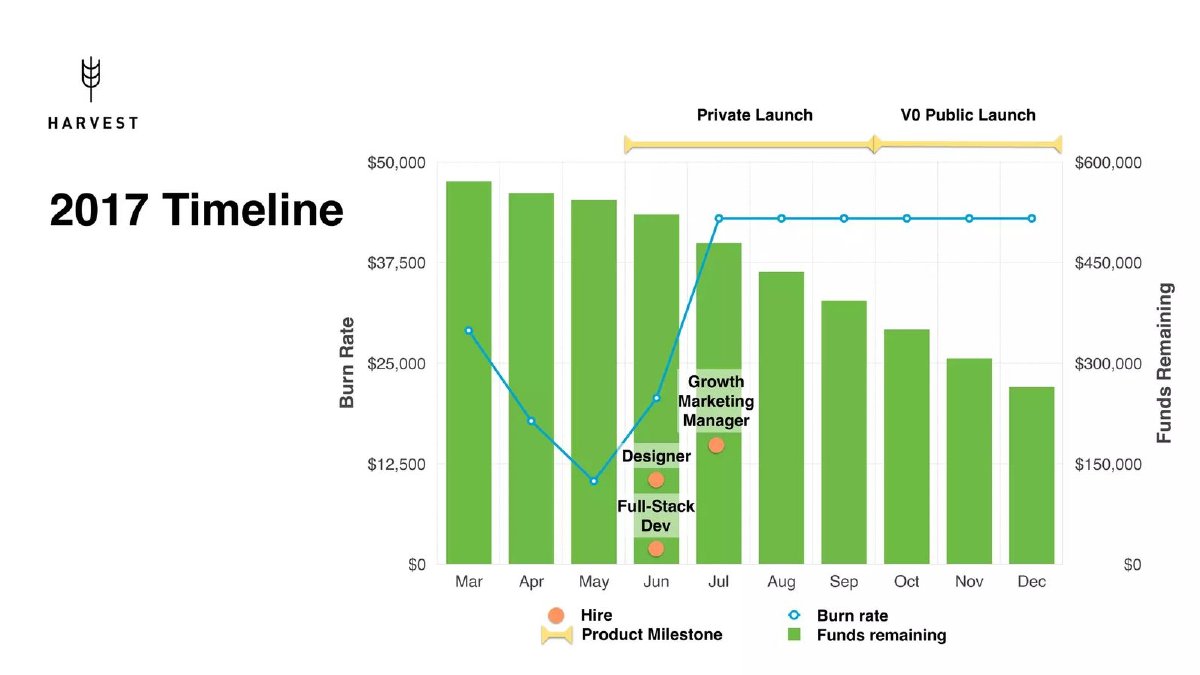
Harvest deck, slide 13. Exact stored slide matched to this analysis.
Our analysis: It shows burn changing over time and why: the burn line steps up when three people are hired, and funds remaining fall faster afterwards. Our approximate reading of the unlabelled chart: burn rises from about $12,500 in May to about $43,000 from July; funds remaining fall from about $575,000 to about $265,000.
Evidence and limitation: Every figure is approximate. The chart does not say whether funds remaining include a new raise or only existing cash, and it ends in December with cash left and no date when it runs out. The raise is not on this slide.
What a founder can adapt: Chart burn and cash remaining by month, and mark the hires and launches that change the burn.
Supporting analysis
What the deck claims: Monthly bars for "Funds remaining" (right axis, $0–$600,000) and a line for "Burn rate" (left axis, $0–$50,000) from March to December 2017, with hires marked in June and July (Full-Stack Dev, Designer, Growth Marketing Manager) and "Private Launch" and "V0 Public Launch" milestones.
Presentation choice: It shows burn changing over time and why: the burn line steps up when three people are hired, and funds remaining fall faster afterwards. Our approximate reading of the unlabelled chart: burn rises from about $12,500 in May to about $43,000 from July; funds remaining fall from about $575,000 to about $265,000.
When it does not fit: Every figure is approximate. The chart does not say whether funds remaining include a new raise or only existing cash, and it ends in December with cash left and no date when it runs out. The raise is not on this slide.
E-commerce company. "Budget" slide with two yearly tables.
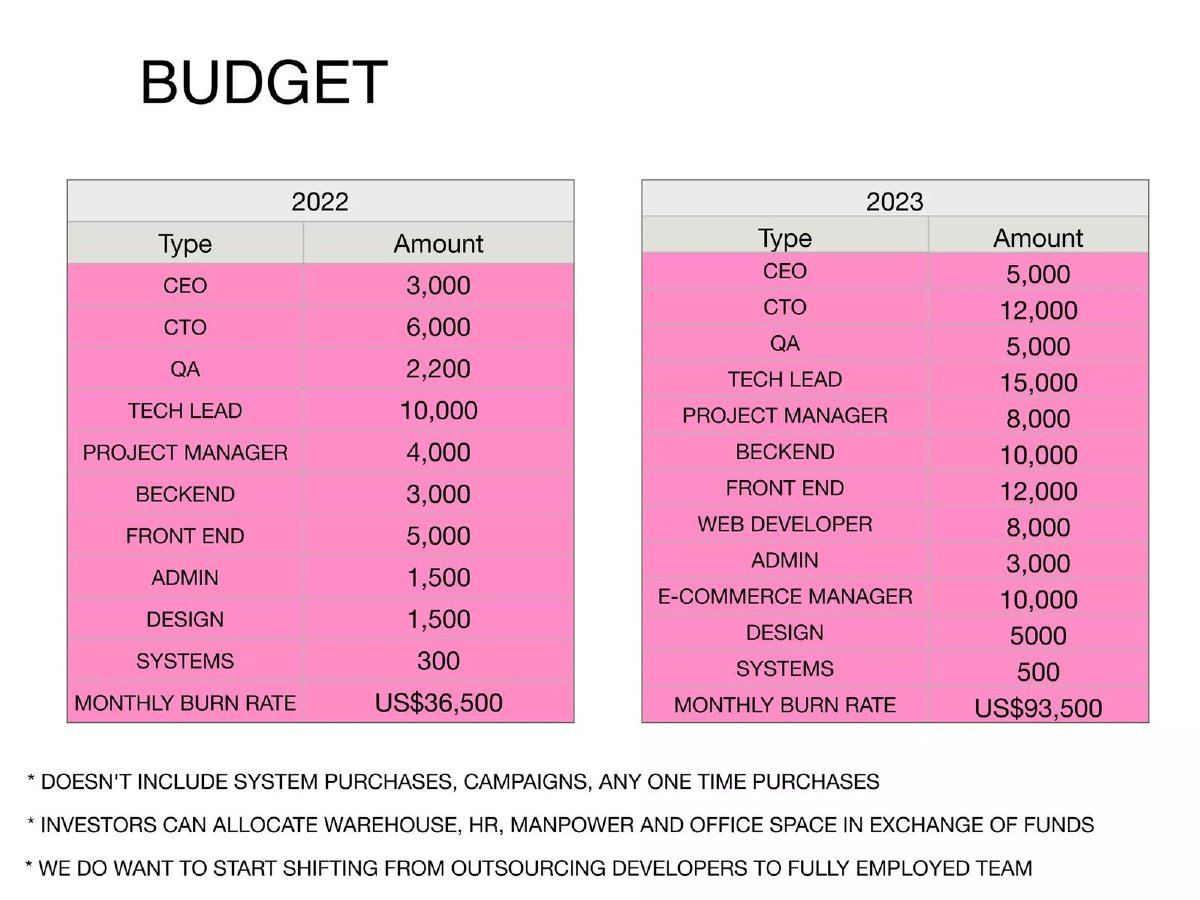
Grivo deck, slide 22. Exact stored slide matched to this analysis.
Our analysis: Both tables add up exactly (our check), and the step from $36,500 to $93,500 a month shows the reader how burn grows. It is the clearest line-by-line burn in this set.
Evidence and limitation: The burn excludes marketing campaigns and one-off purchases, so it understates spending, and the slide gives no raise or runway to divide it into.
What a founder can adapt: Give monthly burn by role for each year of the plan, and state what the burn excludes.
Supporting analysis
What the deck claims: 2022 monthly costs by role (CEO 3,000; CTO 6,000; QA 2,200; Tech Lead 10,000; Project Manager 4,000; Backend 3,000; Front End 5,000; Admin 1,500; Design 1,500; Systems 300) totalling "Monthly burn rate US$36,500"; 2023 adds a web developer and e-commerce manager and totals "US$93,500". Notes: "Doesn't include system purchases, campaigns, any one time purchases"; "Investors can allocate warehouse, HR, manpower and office space in exchange of funds".
Presentation choice: Both tables add up exactly (our check), and the step from $36,500 to $93,500 a month shows the reader how burn grows. It is the clearest line-by-line burn in this set.
When it does not fit: The burn excludes marketing campaigns and one-off purchases, so it understates spending, and the slide gives no raise or runway to divide it into.
Shared inbox software. "We've been capital efficient" slide from its Series A deck.
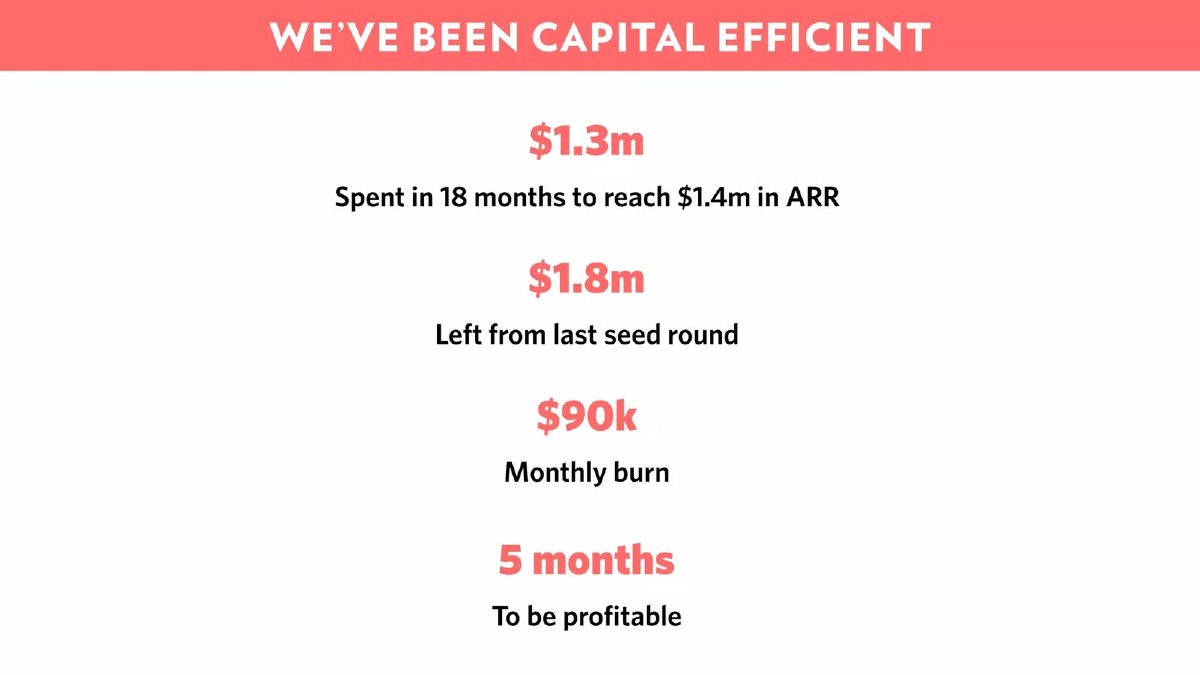
Front deck, slide 14. Exact stored slide matched to this analysis.
Our analysis: It describes existing cash, not the proposed raise: the point is that the company does not need the round to survive. At a constant $90k a month, $1.8m lasts 20 months (our calculation); if the company is profitable in 5 months as it forecasts, it would use about $450K at today's burn.
Evidence and limitation: "5 months to be profitable" is a forecast with no assumptions shown, and the slide does not say whether $90k is net of revenue. Average past spending ($1.3m ÷ 18, about $72K a month by our calculation) is below today's $90k, consistent with rising spending, but the slide does not say.
What a founder can adapt: If you have cash left, show months of runway on existing cash, so investors can see the new round is for growth, not survival.
Supporting analysis
What the deck claims: "$1.3m Spent in 18 months to reach $1.4m in ARR"; "$1.8m Left from last seed round"; "$90k Monthly burn"; "5 months To be profitable".
Presentation choice: It describes existing cash, not the proposed raise: the point is that the company does not need the round to survive. At a constant $90k a month, $1.8m lasts 20 months (our calculation); if the company is profitable in 5 months as it forecasts, it would use about $450K at today's burn.
When it does not fit: "5 months to be profitable" is a forecast with no assumptions shown, and the slide does not say whether $90k is net of revenue. Average past spending ($1.3m ÷ 18, about $72K a month by our calculation) is below today's $90k, consistent with rising spending, but the slide does not say.
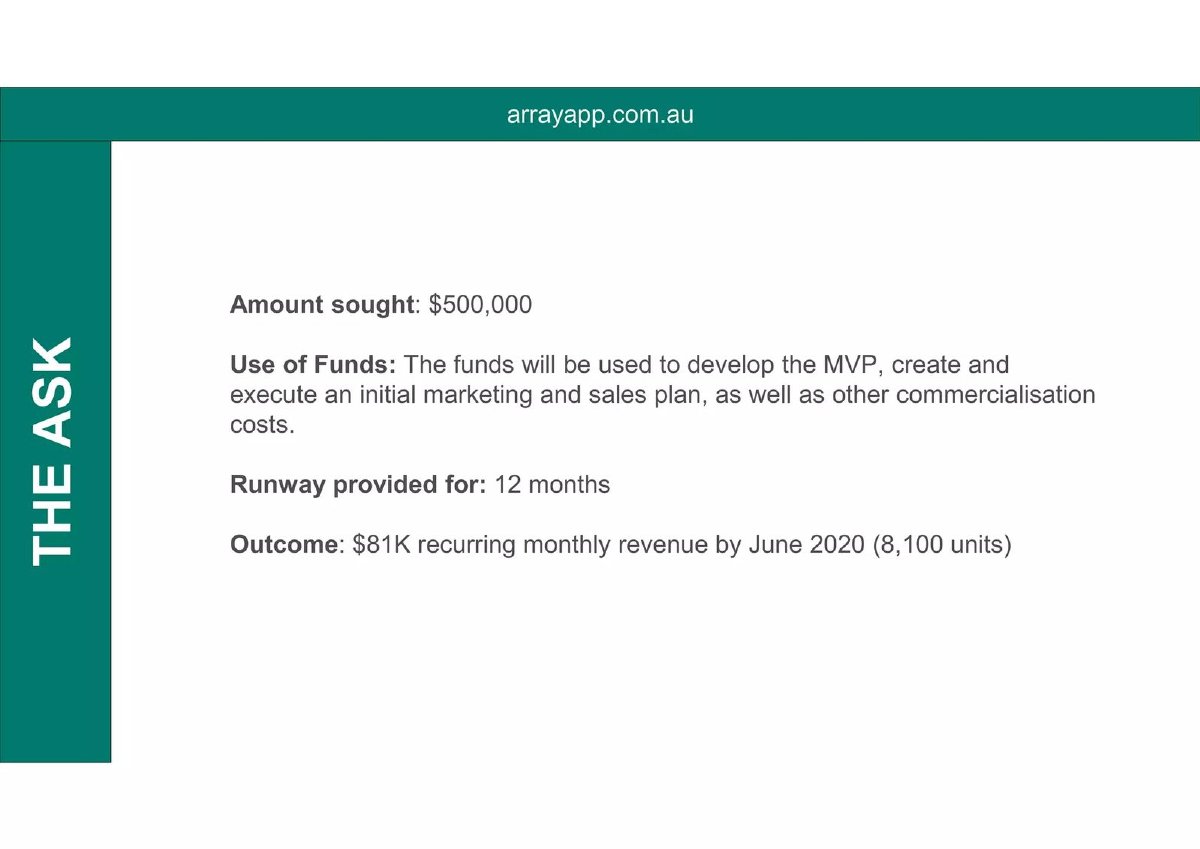
Array deck, slide 10. Exact stored slide matched to this analysis.
Our analysis: It states raise, runway and an outcome, which many ask slides leave out. If the whole raise were spent evenly, it would imply about $41,700 a month (our calculation), but the slide does not say so.
Evidence and limitation: No burn and no allocation are given, so the 12 months cannot be tested. $81K of monthly revenue is a forecast, and the slide does not say whether revenue is counted in the runway.
What a founder can adapt: Add the monthly burn so the runway can be checked, and split use of funds into amounts.
Supporting analysis
What the deck claims: "Amount sought: $500,000"; "Use of Funds: The funds will be used to develop the MVP, create and execute an initial marketing and sales plan, as well as other commercialisation costs"; "Runway provided for: 12 months"; "Outcome: $81K recurring monthly revenue by June 2020 (8,100 units)".
Presentation choice: It states raise, runway and an outcome, which many ask slides leave out. If the whole raise were spent evenly, it would imply about $41,700 a month (our calculation), but the slide does not say so.
When it does not fit: No burn and no allocation are given, so the 12 months cannot be tested. $81K of monthly revenue is a forecast, and the slide does not say whether revenue is counted in the runway.
Figures are what each slide states. "Mismatch on the slide" means the slide's own numbers disagree; "Cannot reconcile" means the slide lacks the information to check. Divisions are ours and assume constant burn.
Example
Raise or cash
Monthly burn
Runway stated
What the check shows
Merge
$500K raise
$40K
12 months + $20K reserve
Reconciles exactly
Project Travel
Up to $450K raise
$27K
15 months to break-even
Mismatch: allocation sums to 95%. ≈16.7 months at constant burn; difference unexplained
Items sum to $2.93M vs $3M headline; $70K not explained. Burn cannot be derived from items shown
Harvest
Funds remaining (source not stated)
~$12.5K rising to ~$43K (approximate)
Not stated
Shows burn changing with hires
Grivo
Not stated
$36,500 (2022); $93,500 (2023)
Not stated
Tables add up; excludes campaigns and one-offs
Front
Existing cash $1.8m (not the raise)
$90k
5 months to profitable (forecast)
≈20 months on existing cash
Array
$500,000 raise
Not stated
12 months
Cannot check: no burn given
Key Takeaways
Write the raise as its parts. Merge: "$40K/Month x 12 Months + $20K Reserve" equals its $500K seed.
State the assumptions behind your runway: net or gross burn, cash already in the bank, expected revenue, and whether spending rises with hires.
Make line items add up to the headline, or say what the difference is. Casting to the People's items total $2.93M under a $3M headline, and the slide does not say what the $70,000 difference is.
Account for the whole raise. M&A Nexus's burn and break-even date cover $225K of $500K; the slide does not say what the other $275K pays for.
Keep existing cash separate from the new round. Front's $1.8m and $90k burn describe the last round's money; Harvest charts funds remaining without the raise.
Write your runway line
Fill in each field, then check that the division works before the line goes on the slide.
Raise. How much are you raising?
Burn. Monthly net burn now, and after planned hires.
Assumptions. Is burn net of revenue? Does it rise with hires? Does cash already in the bank count?
Months. Under those assumptions, do the parts add up to your stated runway?
Reserve and one-offs. What is held back or spent once, outside the monthly burn?
Milestone. What will be true when the money runs out?
Copyable framework: $[raise] + $[cash on hand] = $[burn now]/mo for [x] months rising to $[burn later]/mo after [hires] + $[one-offs] + $[reserve] → [total months] of runway to [milestone].
Illustrative example 1 — written by us
Before: Raising $500K. Burn: $15K. Break-even in 15 months.
After: $500K = $15K/mo for 6 months + $35K/mo for 9 months after two hires + $95K reserve → 15 months to break-even at $60K MRR.
What improved: The pieces add up to the raise, and the change in burn is explained.
What this slide has to prove
The raise, the burn and the runway are three views of one plan. An investor checks that they agree, because a mismatch suggests the plan is unfinished or the costs are missing.
The main ask-slide guide covers the amount, milestones, runway and allocation, and the financials guide says burn should match runway. This page is the arithmetic check itself: dividing the raise by the burn, testing line items against the total, and what to do when burn changes over time.
Three checks to run before you send the deck
Assumptions first: say whether burn is net of revenue, whether it rises with hires, whether cash already in the bank counts, and how much of the raise is one-off costs or a reserve. Only then does raise ÷ burn mean anything.
Sum: line items or percentages add up to the raise. A 95% allocation or $70,000 missing from a $3M budget is an arithmetic mismatch a reader can see without any assumptions.
Whole raise: every dollar of the raise is either monthly burn, a one-off cost, a hire that starts later, or a reserve. If the stated burn over the stated period uses only part of the raise, name the rest.
Scope: the burn includes everything the round pays for. Grivo's budget excludes "system purchases, campaigns, any one time purchases", so its monthly burn is not the full cost.
Common mistakes
Part of the raise unexplained. If burn × months uses less than the raise, name what the rest pays for.
Line items that don't sum. Add the budget before the slide goes out; a missing 5% is noticed.
Burn with no period. "$15k" could be weekly or monthly; say "per month".
A burn that leaves costs out. State what is excluded, such as campaigns and one-off purchases.
Current cash presented as the round. Say whether the runway uses money in the bank, the new round, or both.
Diagnostic checklist
Every part of the raise is accounted for: monthly burn × months, one-off costs, later hires and reserve.
The slide says whether burn is net of revenue and whether it changes over time.
Line items or percentages add up to the raise.
Burn changes with planned hires are shown or noted.
The runway says whether it includes cash on hand and expected revenue.
The milestone at the end of the runway is named.
Frequently asked questions
How much runway should a seed round buy?
These slides cannot settle that; they state 12 to 15 months, or "over a year". The main ask-slide guide discusses runway to the next round. This guide checks only that your stated runway follows from your raise and burn.
Should the burn be gross or net of revenue?
Net burn (spending minus revenue) determines runway. None of the eight slides says which it uses, so state it on yours.
How we chose these examples
Search (2026-09-30): the durable corpus index (docs/seo/artifacts/corpus-search, 70,729 unique pages across every deck page, deduplicated by deck-file sha256 + page) was searched for burn rate, monthly burn and runway with a stated amount or number of months (59 burn and 17 runway matches before filtering).
Eight pages were rendered from the original public deck files and read against the text; all eight are used: Merge 14, Project Travel 13, M&A Nexus 13, Casting to the People 10, Harvest 13, Grivo 22, Front 14, Array 10. All are founder pitch decks from public sources recorded in our deck inventory (Front: PitchDeckHunt; the others: SlideShare).
Our divisions assume constant net burn and no other cash unless the slide says otherwise; where a slide does not state those facts, we report a figure as unreconciled, not wrong. Left out: token-sale and ICO decks (Blockchain 17), listed companies reporting quarterly cash burn (OxySure 20), the drone deck already analysed in the financials guide, and slides where burn or runway is redacted (Klue 12, Airbase memo 10).
All divisions and sums marked "our calculation" are ours. Harvest's figures are read from an unlabelled chart and are approximate. How we built this: drafted and checked with AI assistance (editorial model review against the original slide images); no human editor has reviewed this guide.