Market Share Targets on a Pitch Deck: Does "Just 1%
How startups state a market share or penetration target on a pitch deck: which market, which unit, by when.
How to Show a Market Share Target on Your Pitch Deck So the Arithmetic Holds
Fourteen slides from real pitch decks that state a target share of their market: "just 1%", "a 5% market share would", "we seek to capture 20%". For each, we record which market and unit the share applies to, the time frame, whether share multiplied by market gives the customers or revenue on the slide, and whether the target is backed by a plan.
TL;DR
A market share target says how much of a defined market the company expects to win and by when. Investors are wary of the classic version, "if we get just 1% of a huge market", because it describes the size of the market, not how the company will win customers. A useful target does three things: it names the market in the same unit as the company sells (users, devices, boats, square feet, euros of spend), it gives a date, and it multiplies through: share times market equals the customers or revenue shown, and those customers can be reached with the plan and budget in the deck.
In this set, Pillar, Studnt, Peer to Pier and Matchory all multiply through correctly (our checks). Lord of the Trees builds its 2% of global tree planting step by step, and iSprout targets 10% of market growth rather than of the whole market. The problems: Breathe Easy's 0.5% of 4.3 million children is about 21,500 devices, not the 259,000 a year it shows; Filevine labels a serviceable obtainable market of $4.1B as a 60% market share; Hard Asset Management, a storage business, targets 30–40% of all precious metal sales; Angle Health's "just 1% market share in" leaves the market blank; and Smatbeba targets 40% of a market it never sizes.
Market share targets from real pitch decks
Each example records the exact slide, the share it states, the market it applies to, and whether the arithmetic holds. Checks and implied figures are our calculations.
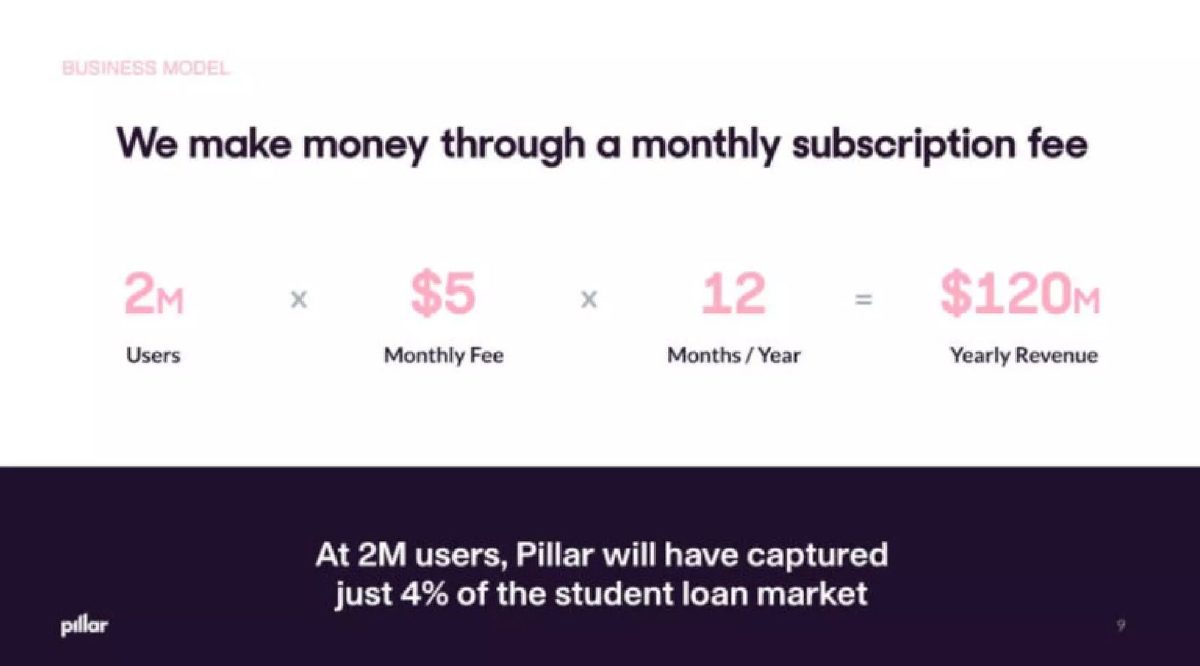
Pillar market slide — slide 9
Student loan app. Business model slide.
Pillar deck, slide 9. Exact stored slide matched to this analysis.
Our analysis: Unit, price and arithmetic shown; no date.
Evidence and limitation: Our checks: the product is $120M; 2M at 4% implies 50M borrowers.
What a founder can adapt: Add the year and the channel plan that reaches 2M users.
Supporting analysis
What the deck claims: "2M Users × $5 Monthly Fee × 12 Months / Year = $120M Yearly Revenue"; "At 2M users, Pillar will have captured just 4% of the student loan market."
Presentation choice: Every step can be multiplied and divided back.
When it does not fit: Don't let "just 4%" hide a two-million-customer target.
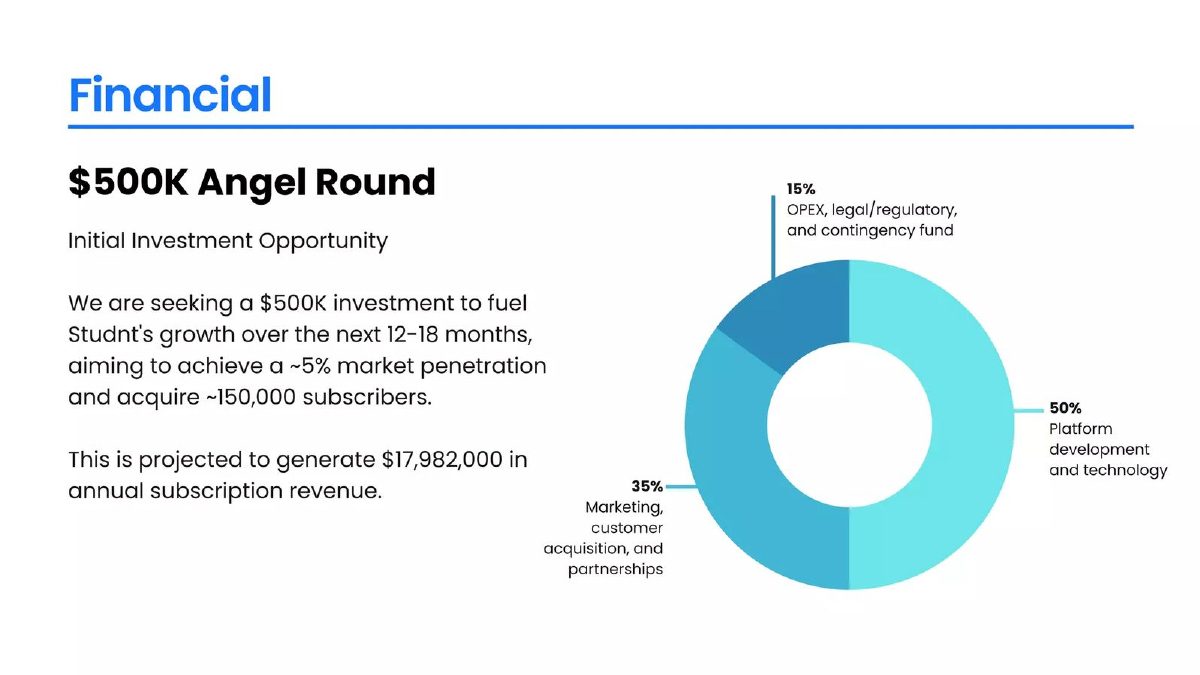
Student app. Financial and use-of-funds slide for a $500K angel round.
Studnt deck, slide 23. Exact stored slide matched to this analysis.
Our analysis: Arithmetic and date hold; the budget looks small for the target.
Evidence and limitation: Our calculations: implied market about 3M; $119.88 a year ($9.99 a month) per subscriber; about $1.17 of marketing per subscriber.
What a founder can adapt: Show the acquisition cost that makes 150,000 reachable.
Supporting analysis
What the deck claims: "~5% market penetration", "~150,000 subscribers" in 12–18 months, "$17,982,000 in annual subscription revenue"; 35% of funds to marketing.
Presentation choice: Tying the share to the raise lets investors test it against spend.
When it does not fit: Don't set a share the use of funds cannot pay for.
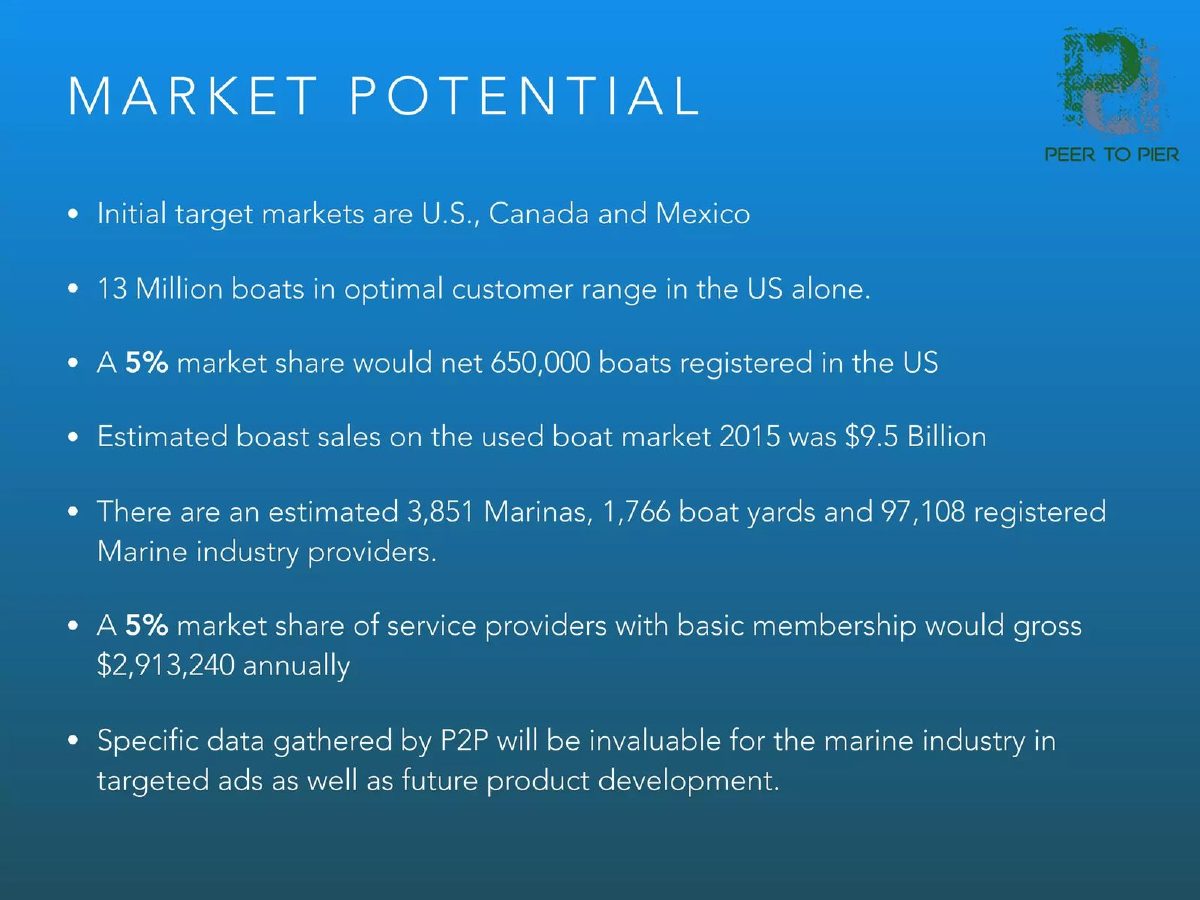
Peer to Pier deck, slide 9. Exact stored slide matched to this analysis.
Our analysis: Bases shown and both shares multiply through; price and date missing.
Evidence and limitation: Our checks: 650,000 is 5% of 13M; 5% of 102,725 providers is about 5,136, implying about $567 a year each.
What a founder can adapt: State the membership price and the year.
Supporting analysis
What the deck claims: "A 5% market share would net 650,000 boats" of 13 million; 5% of 3,851 marinas, 1,766 boat yards and 97,108 providers "would gross $2,913,240 annually".
Presentation choice: An investor can rebuild both lines.
When it does not fit: Don't make investors back out your price.
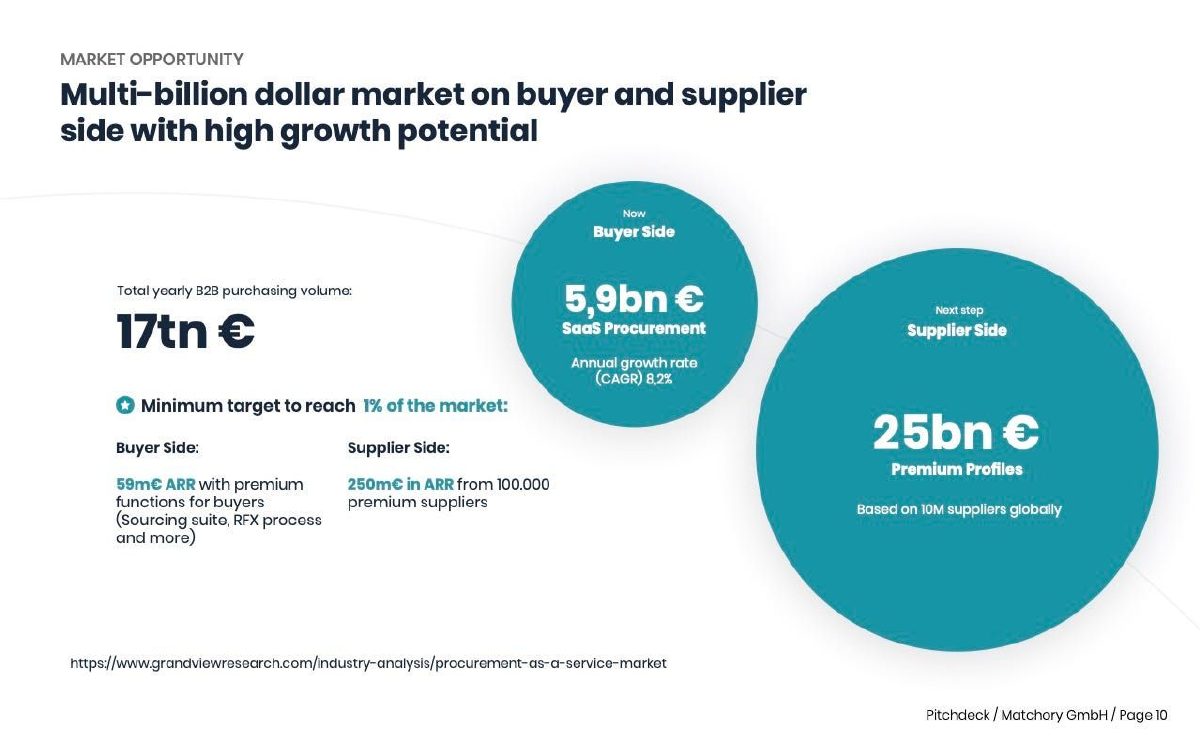
Matchory deck, slide 10. Exact stored slide matched to this analysis.
Our analysis: The share is applied to software spend, not the 17tn € headline.
Evidence and limitation: Our checks: both 1% figures multiply; 250m € over 100,000 is 2,500 € each; 100,000 is 1% of 10M suppliers.
What a founder can adapt: Add a date.
Supporting analysis
What the deck claims: 17tn € purchasing volume; 5.9bn € buyer-side SaaS; 25bn € supplier-side; "Minimum target to reach 1% of the market": 59m € ARR and 250m € ARR from 100,000 premium suppliers.
Presentation choice: Using the unit you sell keeps the target meaningful.
When it does not fit: Don't apply a share to total trade volume.
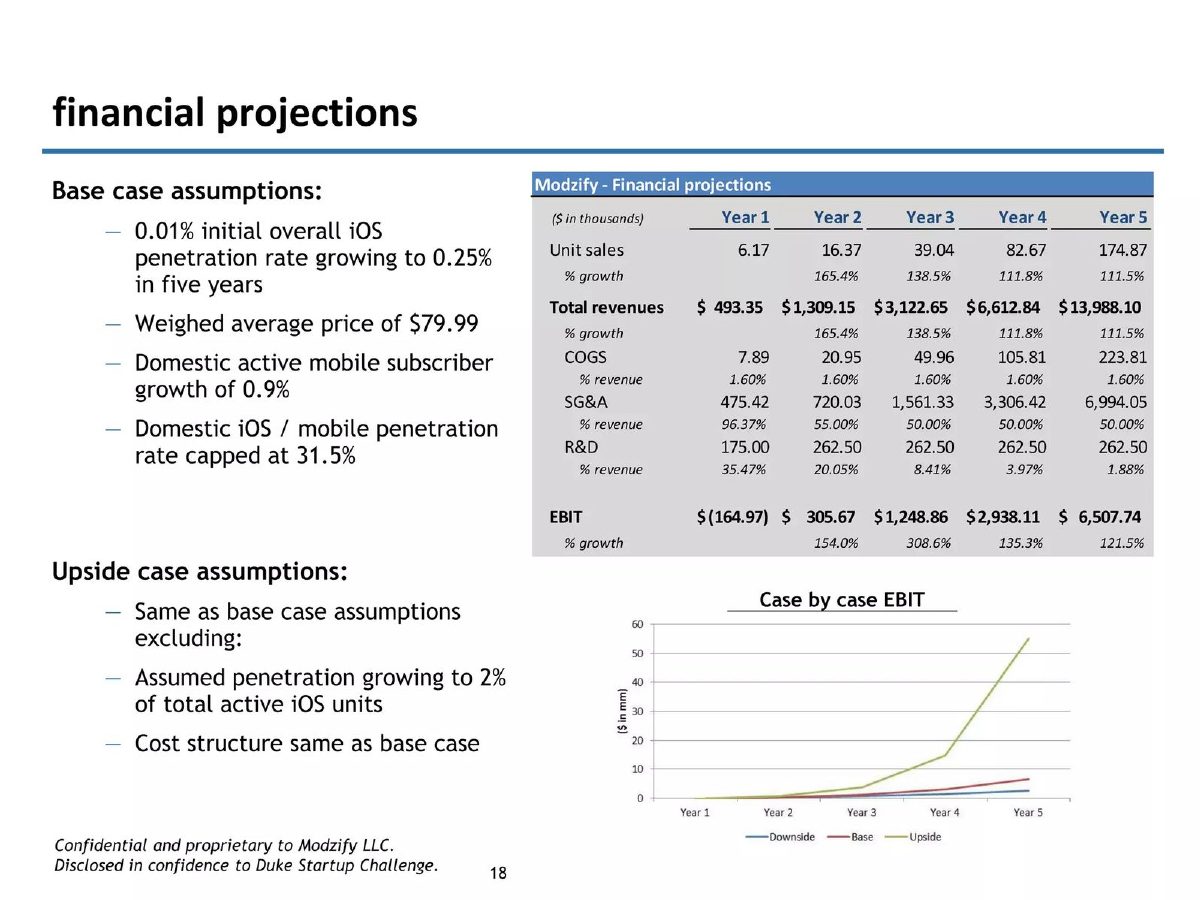
Modzify deck, slide 18. Exact stored slide matched to this analysis.
Our analysis: Explicit penetration path that multiplies through; cost line needs explaining.
Evidence and limitation: Our checks: units × price give the revenues; implied iOS base about 62M then 70M. COGS is 1.60% of revenue each year.
What a founder can adapt: Explain the cost assumption.
Supporting analysis
What the deck claims: "0.01% initial overall iOS penetration rate growing to 0.25% in five years"; $79.99 price; units 6.17K to 174.87K; revenue $493.35K to $13,988.10K; upside case 2%.
Presentation choice: A dated penetration path is testable.
When it does not fit: Don't pair a sound share with an unexplained cost line.
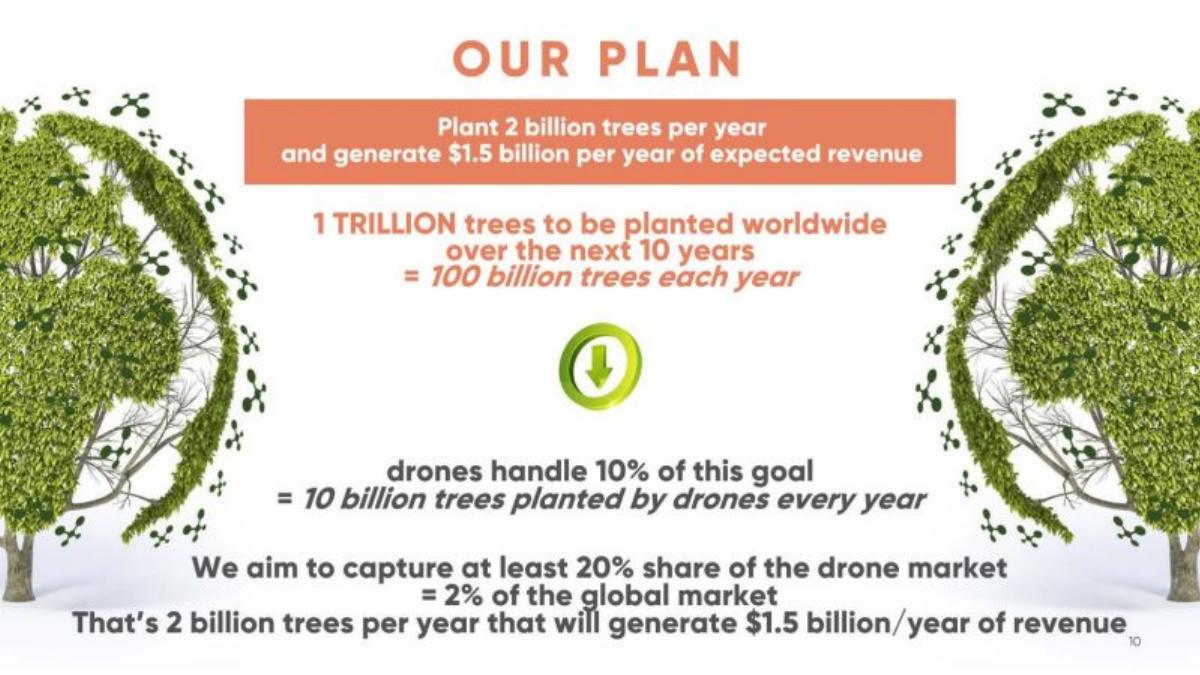
Lord of the Trees deck, slide 5. Exact stored slide matched to this analysis.
Our analysis: Clear steps; the 10% drone share is an unsourced assumption.
Evidence and limitation: Our checks: each step multiplies; $0.75 per tree.
What a founder can adapt: Source or justify the drone share of planting.
Supporting analysis
What the deck claims: 100 billion trees a year; drones handle 10%; "at least 20% share of the drone market = 2% of the global market"; 2 billion trees, $1.5 billion a year.
Presentation choice: Step-by-step shares show exactly where the risk sits.
When it does not fit: Don't bury an assumption inside a chain of correct arithmetic.
Data platform for anti-recidivism services. Combined team and strategy page.
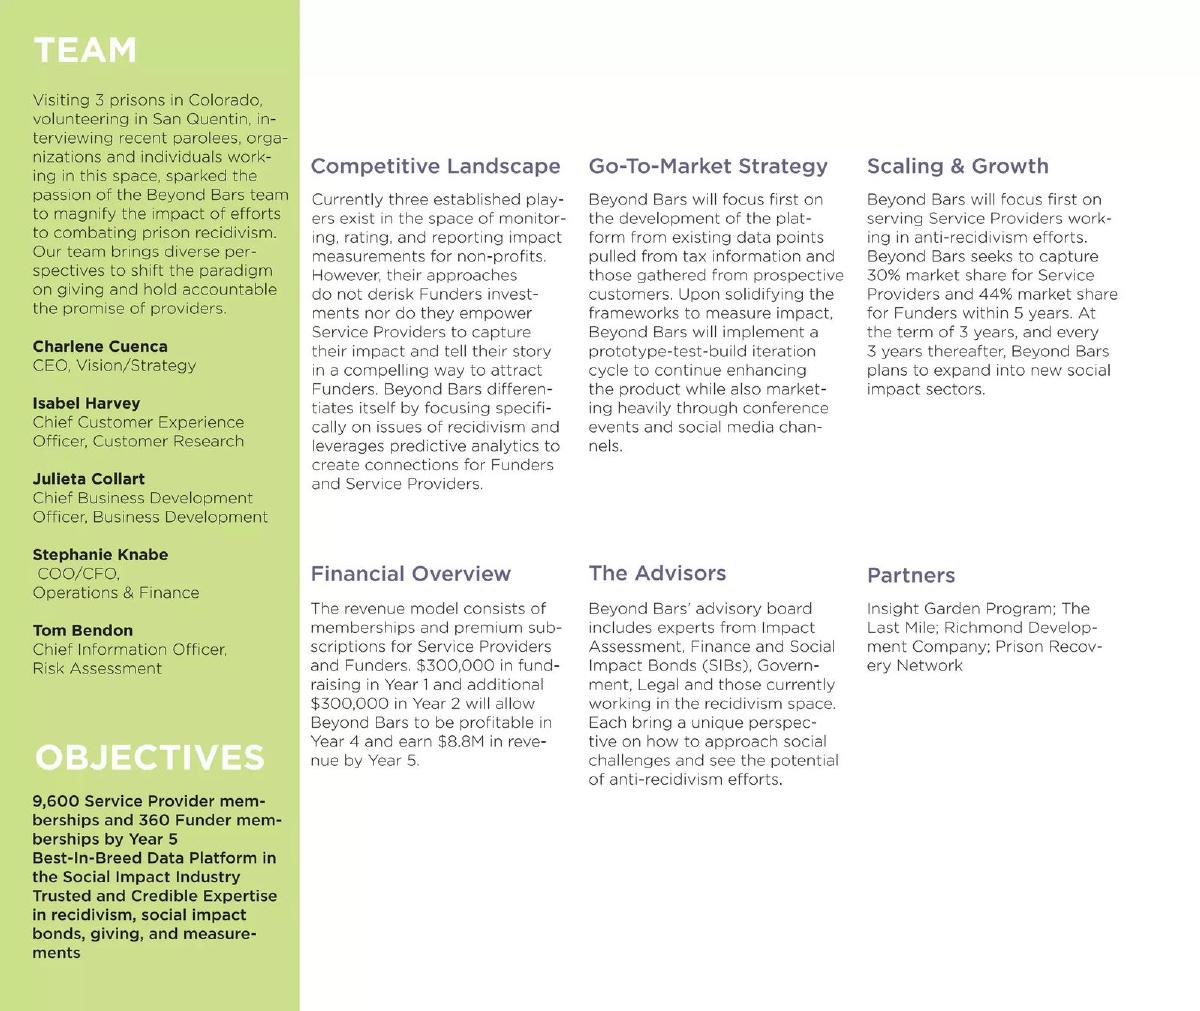
Beyond Bars deck, slide 6. Exact stored slide matched to this analysis.
Our analysis: Shares, counts and date given; very large shares with three competitors named.
Evidence and limitation: Our calculations: implied markets about 32,000 providers and 818 funders; neither is sized on the slide.
What a founder can adapt: Size both markets and explain the path to a third of each.
Supporting analysis
What the deck claims: "30% market share for Service Providers and 44% market share for Funders within 5 years"; 9,600 and 360 memberships by year 5; $8.8M revenue by year 5.
Presentation choice: Counts let investors back out the assumed market.
When it does not fit: Don't set a 30–44% share without saying who you take it from.
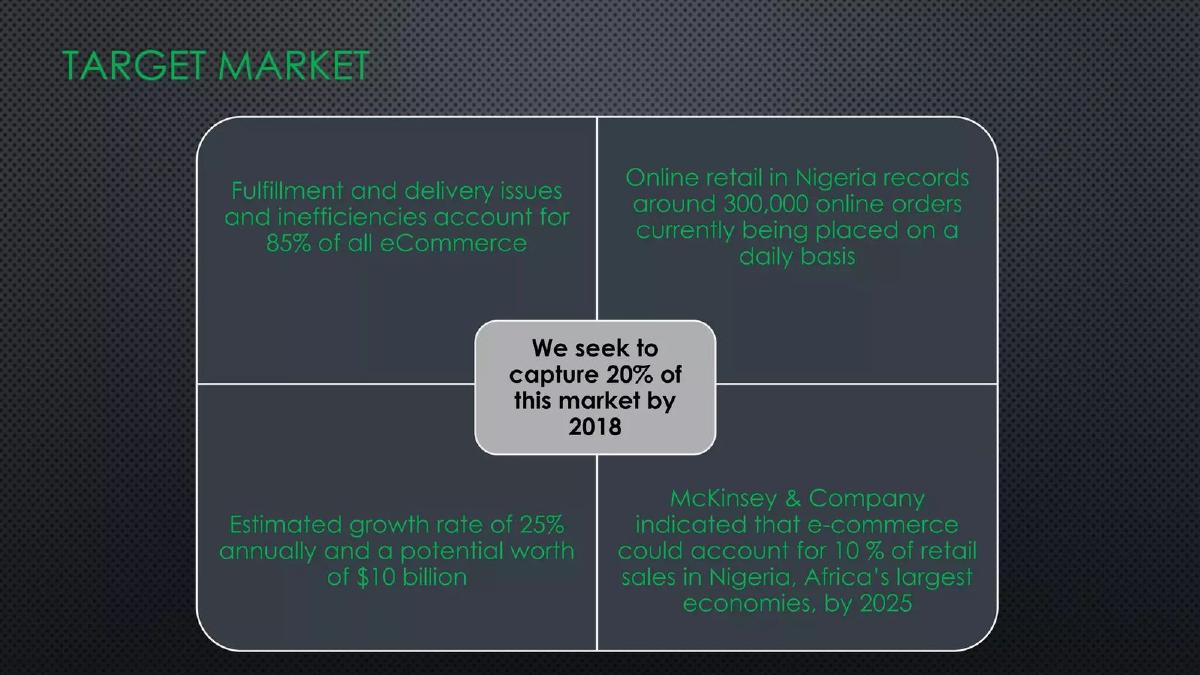
E-commerce delivery in Nigeria. Target market slide.
Delivery Bros deck, slide 3. Exact stored slide matched to this analysis.
Our analysis: A date, but four candidate markets.
Evidence and limitation: Our calculation: 20% of 300,000 daily orders would be about 60,000 deliveries a day, if that is the market meant.
What a founder can adapt: Say which figure the 20% applies to.
Supporting analysis
What the deck claims: "We seek to capture 20% of this market by 2018", surrounded by 300,000 daily orders, $10 billion potential, 25% growth and 10% of retail by 2025.
Presentation choice: "This market" must point to one number.
When it does not fit: Don't surround a share with several different markets.
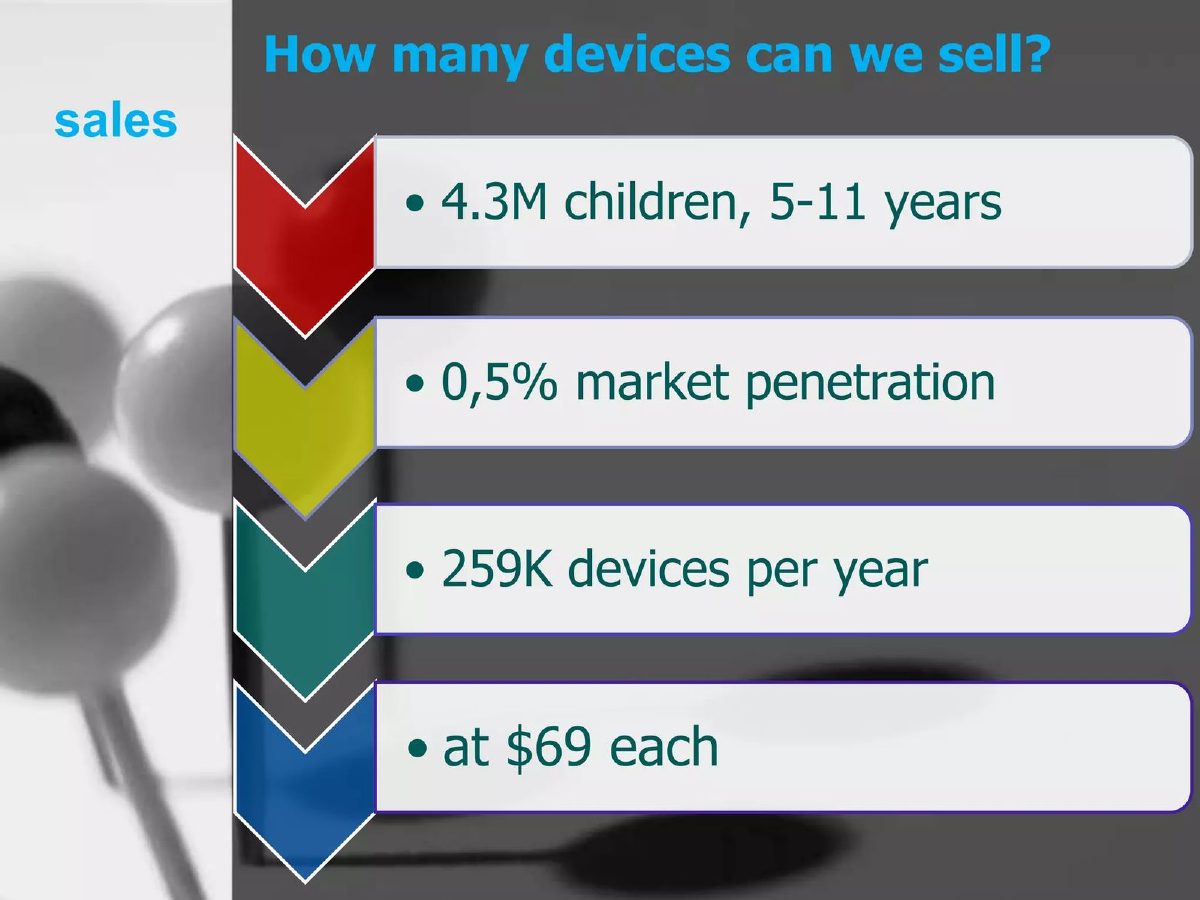
Before: 4.3M children, 0,5% market penetration, 259K devices per year
After: 4.3M children aged 5–11 × 0.5% penetration = 21,500 devices a year × $69 = $1.5M (or show the step that produces 259K).
What improved: Makes Breathe Easy's steps multiply through.
What a market share target tells an investor, and what it doesn't
Market sizing slides usually end with a target: the part of the market the company expects to win. Stated as a share, it connects the market slide to the financial plan. If the market is 13 million boats and the target is 5%, the company is saying it expects 650,000 customers, and every later number (revenue, sales team, marketing budget) should be consistent with that.
Investors distrust the target when it stands in for a plan. "If we capture just 1% of a $10B market, that's $100M" tells an investor the market is large, which the previous slide already said. It says nothing about which customers come first, how they will be reached or why they will switch. A small percentage also sounds modest while hiding a large absolute number: 1% of a big market can mean hundreds of thousands of customers, more than many successful companies have.
A useful target has four parts. The market is defined in the unit the company sells: users for a subscription app, devices for a hardware product, square feet for office space, euros of software spend for a SaaS platform. The share has a date: 5% by year five, not 5% at some point. The arithmetic is on the slide and multiplies through. And somewhere in the deck, a plan shows how those customers will be won: channels, conversion rates, a sales team, a budget. When the target is built from the bottom up, customers per channel adding up to a share, the share becomes a check on the plan rather than a substitute for it.
Two further checks catch most errors. First, divide: customers or revenue shown divided by the share gives the market the company is assuming, which should match the market on the slide. Second, look at the size of the share. Taking 30% or more of an established market means taking customers from incumbents, and the slide needs to say why that is likely.
Targets that multiply through
Pillar's page 9, "We make money through a monthly subscription fee", shows "2M Users × $5 Monthly Fee × 12 Months / Year = $120M Yearly Revenue" and a banner: "At 2M users, Pillar will have captured just 4% of the student loan market." Our checks: 2 million × $5 × 12 is $120 million, so the revenue line is right; 2 million at 4% implies a market of 50 million borrowers. The slide gives the unit (users), the price and the arithmetic. It does not give a date, and "just 4%" is still 2 million paying subscribers, a large number that the deck needs to reach through a stated plan.
Studnt's page 23, "Financial", asks for a "$500K Angel Round" and says the money will fuel growth "over the next 12-18 months, aiming to achieve a ~5% market penetration and acquire ~150,000 subscribers. This is projected to generate $17,982,000 in annual subscription revenue." A pie chart splits the use of funds: 50% platform and technology, 35% marketing and partnerships, 15% operations and contingency. Our calculations: 150,000 subscribers at about 5% implies a market of about 3 million; $17,982,000 over 150,000 is $119.88 a year, which is $9.99 a month. The arithmetic holds and has a date. The question it raises is scale: $175,000 of marketing (35% of $500K, our calculation) would need to win 150,000 subscribers, about $1.17 each.
Peer to Pier's page 9, "Market Potential", says there are "13 Million boats in optimal customer range in the US alone" and "A 5% market share would net 650,000 boats registered in the US." For service providers it lists "3,851 Marinas, 1,766 boat yards and 97,108 registered Marine industry providers" and says "A 5% market share of service providers with basic membership would gross $2,913,240 annually." Our checks: 5% of 13 million is 650,000. The providers add to 102,725; 5% is about 5,136, and $2,913,240 divided by that is about $567 a year per member, about $47 a month. The slide shows its bases and each share multiplies through, but it never states the membership price, so an investor has to back it out, and it gives no date for either share.
Matchory's page 10, "Multi-billion dollar market on buyer and supplier side with high growth potential", shows total yearly B2B purchasing volume of 17tn €, a buyer-side market of 5.9bn € in SaaS procurement (CAGR 8.2%) and a supplier-side market of 25bn € in premium profiles "based on 10M suppliers globally". Its "Minimum target to reach 1% of the market" is "59m€ ARR with premium functions for buyers" and "250m€ in ARR from 100,000 premium suppliers". Our checks: 1% of 5.9bn € is 59m €; 1% of 25bn € is 250m €; 100,000 is 1% of 10 million suppliers; and 250m € across 100,000 suppliers is 2,500 € each a year. The targets use the same unit as the business (software revenue), not the 17tn € headline, which is the right choice. There is no date.
Modzify's page 18, "financial projections", sets a base case of "0.01% initial overall iOS penetration rate growing to 0.25% in five years" at a weighted average price of $79.99, with an upside case of 2%. The table shows unit sales (in thousands) of 6.17 in year 1 and 174.87 in year 5, with revenues of $493.35K and $13,988.10K. Our checks: 6,170 × $79.99 is about $493,500 and 174,870 × $79.99 is about $13,988,000, so revenue follows from units. Dividing units by penetration implies about 62 million iOS units in year 1 and about 70 million in year 5. The penetration path is explicit and the numbers agree. One figure needs explaining: cost of goods is 1.60% of revenue every year, which is unusually low for a product that sells units.
Targets built from a narrower base
Lord of the Trees' page 5, "Our Plan", builds its share in steps: "1 trillion trees to be planted worldwide over the next 10 years = 100 billion trees each year"; "drones handle 10% of this goal = 10 billion trees planted by drones every year"; "We aim to capture at least 20% share of the drone market = 2% of the global market"; "That's 2 billion trees per year that will generate $1.5 billion/year of revenue." Our checks: 20% of 10 billion is 2 billion, which is 2% of 100 billion; $1.5 billion over 2 billion trees is $0.75 a tree. Every step multiplies through. The weakest link is the second step: that drones will plant 10% of all trees is an assumption, not a measured share, and the slide gives no source for it or for the global goal.
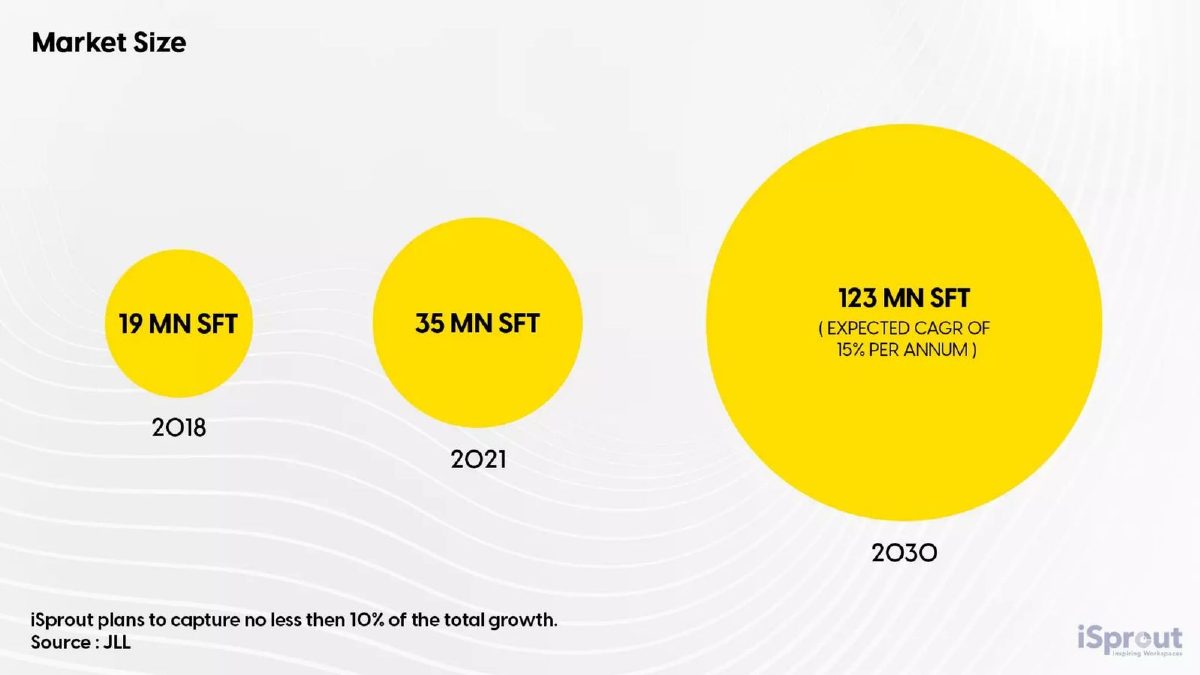
iSprout's page 8, "Market Size", shows flexible office space of 19 million square feet in 2018, 35 million in 2021 and 123 million in 2030 ("expected CAGR of 15% per annum"), sourced to JLL, and says "iSprout plans to capture no less then 10% of the total growth." Our calculations: growth from 2021 to 2030 is 88 million square feet, so 10% is about 8.8 million square feet; 35 to 123 million over nine years is about 15% a year, matching the stated CAGR. Targeting a share of new supply rather than of the whole market is a sensible way to frame a target in a growing market, since it does not require taking space from existing operators. The slide does not say how much space iSprout operates today, so the size of the step is unknown.
Beyond Bars' page 6 combines team, strategy and objectives. Under "Scaling & Growth" it says it "seeks to capture 30% market share for Service Providers and 44% market share for Funders within 5 years". Its objectives are "9,600 Service Provider memberships and 360 Funder memberships by Year 5", and the financial overview says it plans to be profitable in year 4 and "earn $8.8M in revenue by Year 5". Our calculations: 9,600 at 30% implies about 32,000 service providers; 360 at 44% implies about 818 funders. The slide gives shares, counts and a date, which is more than most. But neither market is sized on the slide, and 30–44% of a market within five years is a very large share for a new data platform; the slide's own competitive section says three established players already exist.
Targets whose arithmetic or unit does not hold
Breathe Easy's page 10 asks "How many devices can we sell?" and answers in four steps: "4.3M children, 5-11 years", "0,5% market penetration", "259K devices per year", "at $69 each". Our calculations: 0.5% of 4.3 million is 21,500, not 259,000; 259,000 is about 6% of 4.3 million. At $69, 259,000 devices is about $17.9 million a year, while 21,500 devices is about $1.5 million. The slide does not show what connects the steps; there may be a missing multiplier (devices per child, or a wider population), but as shown the revenue is about twelve times what the stated penetration supports.
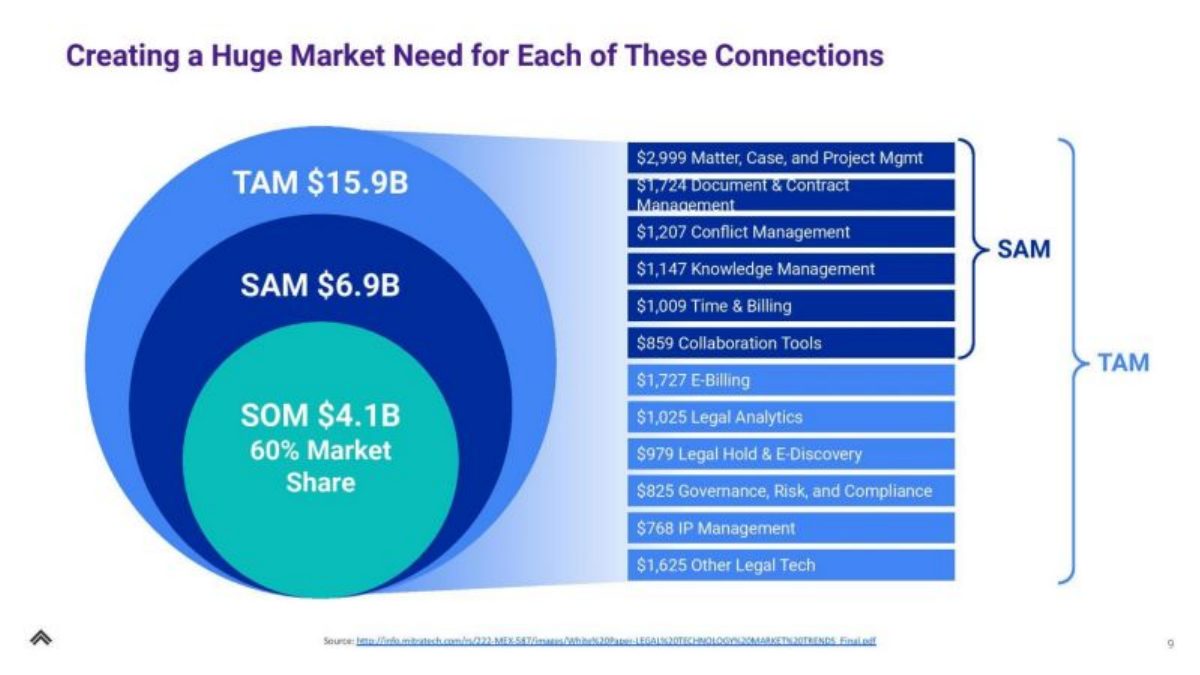
Filevine's page 9, "Creating a Huge Market Need for Each of These Connections", shows nested circles: TAM $15.9B, SAM $6.9B and "SOM $4.1B 60% Market Share", with a list of software categories adding to the totals. Our calculation: $4.1B is about 59% of $6.9B, so the label is consistent. But a serviceable obtainable market is meant to be the part a company can realistically win in the near term, and labelling it as 60% of the serviceable market asks an investor to accept that Filevine will take most of a market spread across a dozen existing software categories. The slide gives no date and no reason.
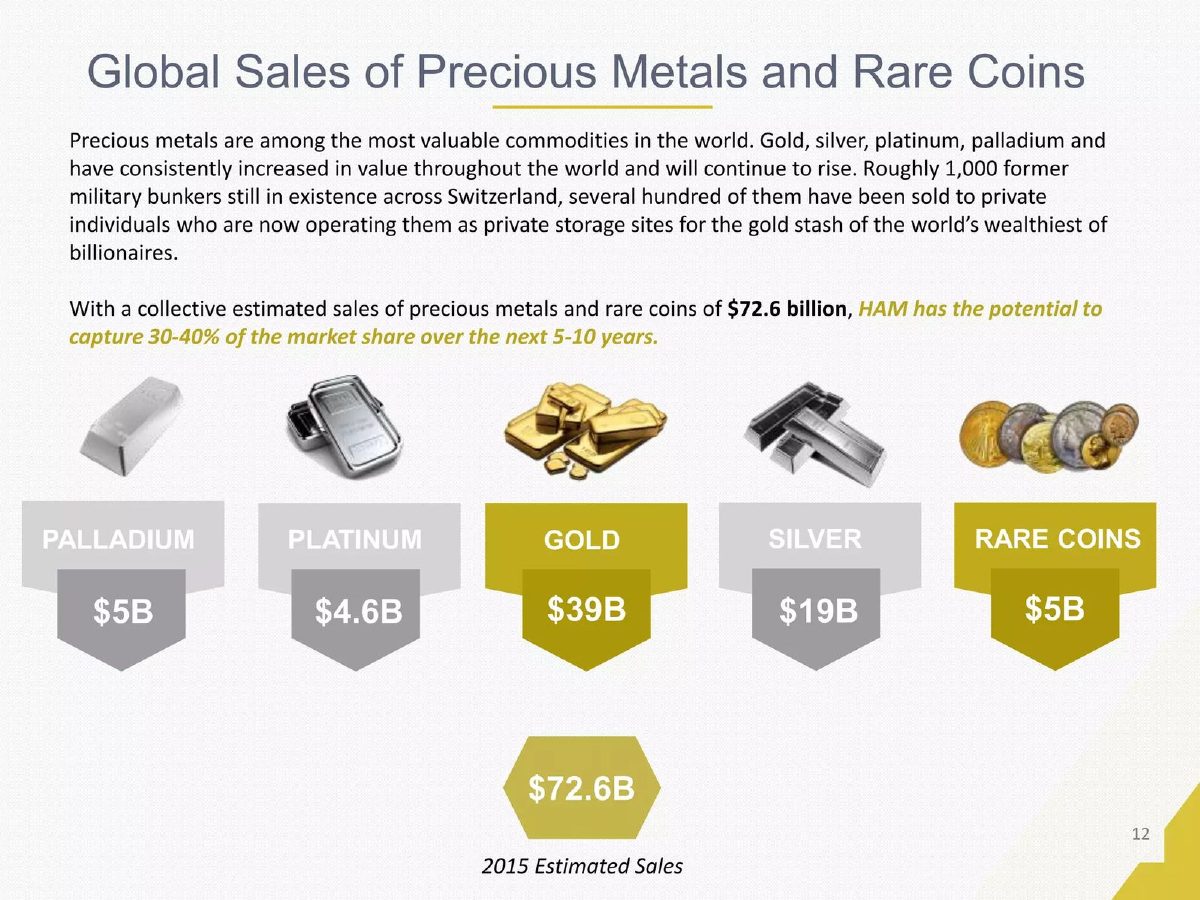
Hard Asset Management's page 12, "Global Sales of Precious Metals and Rare Coins", describes former military bunkers in Switzerland used as private storage sites, then says: "With a collective estimated sales of precious metals and rare coins of $72.6 billion, HAM has the potential to capture 30-40% of the market share over the next 5-10 years." Tiles show palladium $5B, platinum $4.6B, gold $39B, silver $19B and rare coins $5B, labelled 2015 estimated sales. Our calculations: the tiles add to $72.6B, and 30–40% is about $22–29B. The unit is the problem: sales of metals are not storage revenue. A storage company would need the value of metal stored and the fee it charges, and the share and time frame (five to ten years) are both very wide.
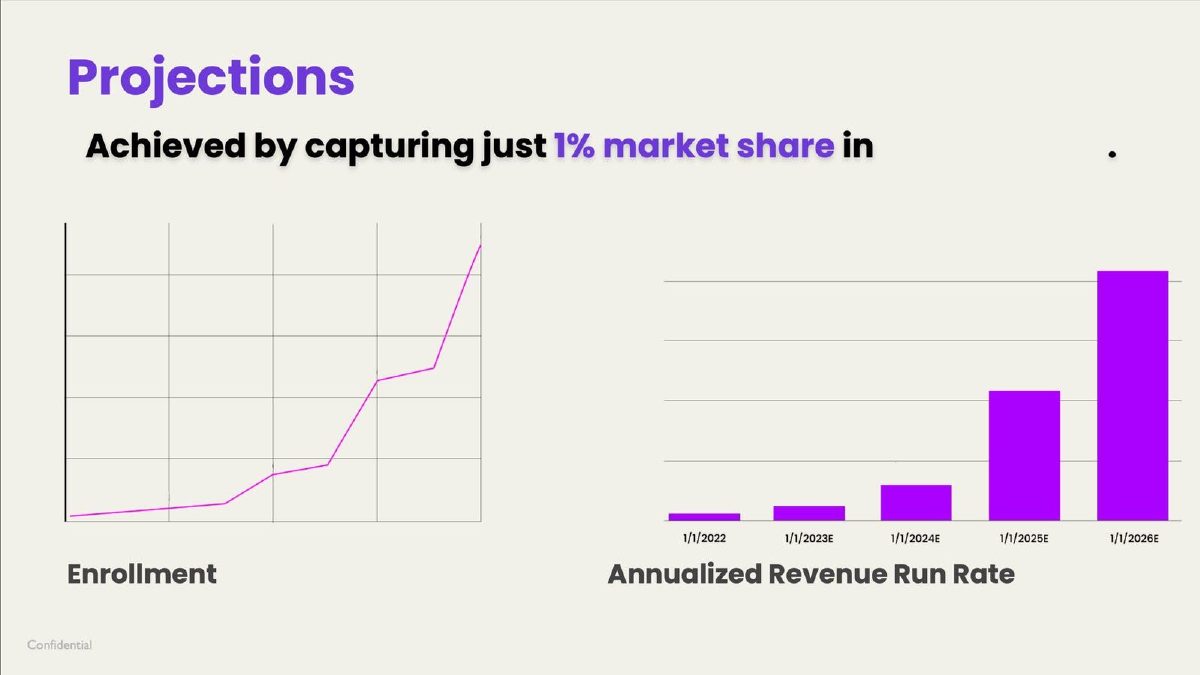
Angle Health's page 10, "Projections", is headed "Achieved by capturing just 1% market share in", and the sentence stops there. Two charts, enrollment and annualized revenue run rate from 1/1/2022 to 1/1/2026, have no values on their axes. The slide tells an investor that the projection depends on a market share, but not which market, what 1% is, or what the charts show.
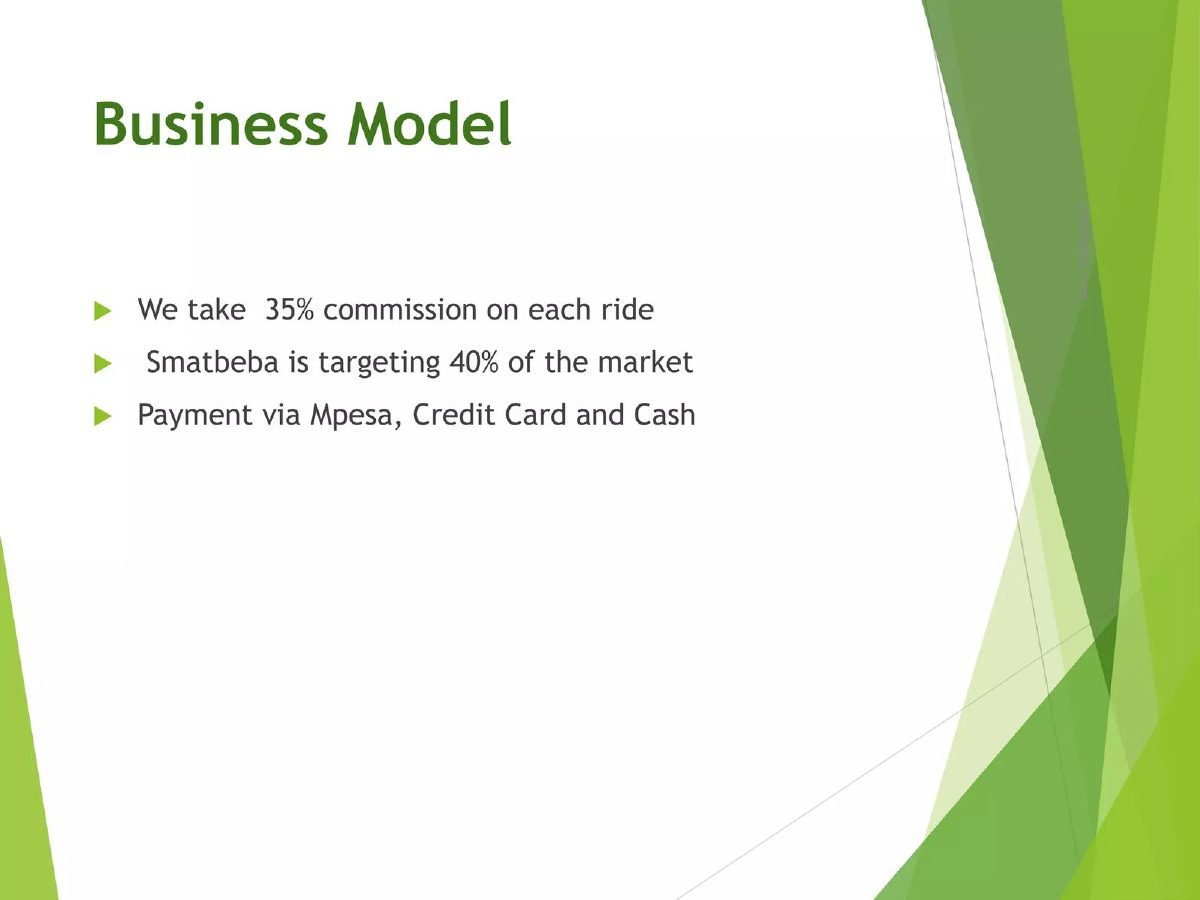
Smatbeba's page 17, "Business Model", says "We take 35% commission on each ride", "Smatbeba is targeting 40% of the market" and "Payment via Mpesa, Credit Card and Cash". A 40% target is a claim to be one of the leading ride operators in the market, but the slide does not say which market (city, country, ride type), how large it is, or by when.
Delivery Bros' page 3, "Target Market", surrounds "We seek to capture 20% of this market by 2018" with four statements: fulfilment and delivery issues account for 85% of all e-commerce; around 300,000 online orders are placed daily in Nigeria; an estimated growth rate of 25% annually and a potential worth of $10 billion; and McKinsey's estimate that e-commerce could be 10% of retail sales in Nigeria by 2025. Our calculation: if "this market" is the 300,000 daily orders, 20% is about 60,000 deliveries a day. The slide gives a date, but four different markets surround the target and it does not say which one the 20% applies to.
How to state a market share target
Write the arithmetic out: "13M boats × 5% = 650,000 customers by year 5 × $X a year = $Y." Pillar and Peer to Pier do this, and it lets an investor check each step. Then run the check backwards: customers divided by share should give back the market you sized.
Use the unit you sell. A subscription app's market is people who could subscribe; a storage business's market is value stored or storage spend, not the value of goods traded. Matchory's choice of software spend over total purchasing volume is the model.
Give a date and connect the share to a plan. A share with no date cannot be tested. The plan does not have to be on the same slide, but the go-to-market and financial slides should reach the same customer count.
Size the share to the market's structure. Targeting a share of new growth, as iSprout does, is easier to defend in a growing market. A share above about a quarter of an established market implies displacing incumbents; say how.
Prefer bottom-up customer counts, then show the share as a result. "4 sales reps × 40 customers a year × 3 years = 480 customers, 2% of the 24,000 target firms" says more than "2% of the market" alone.
Common mistakes
Share and result disagree. Multiply the share by the market on the slide.
Market not named. Say which market and where.
Wrong unit. Apply the share to what you sell.
No date. Give the year the share is reached.
Very large share without a reason. Explain who you take customers from.
Share instead of a plan. Connect the share to channels and budget.
Diagnostic checklist
The market is named, sized and sourced.
The market is in the unit the company sells.
The share has a date.
Share × market equals the customers or revenue shown.
Customers ÷ share gives back the market.
Large shares have a stated reason.
The go-to-market plan reaches the same customer count.
Frequently asked questions
Is "just 1% of the market" a bad argument?
On its own, yes: it restates market size. Pillar's version works better because it multiplies through to users and revenue, though it still needs a date and a plan.
What market share target is realistic?
It depends on the market's structure. A share of new growth, as iSprout uses, is easier to defend. Filevine's 60% and Hard Asset Management's 30–40% need reasons the slides do not give.
Should the share apply to TAM, SAM or SOM?
To the market you can serve, in the unit you sell. Matchory applies 1% to software spend rather than to 17tn € of purchasing.
How do I check my own slide?
Multiply share by market, then divide your customer count by the share. Breathe Easy's slide fails the first check: 0.5% of 4.3M is 21,500, not 259K.
Should I show a share at all?
Yes, as a result of a bottom-up plan. Studnt ties 5% to 150,000 subscribers and a funded budget, which invites the right questions.
How we chose these examples
Search (2026-09-30): the durable corpus index (docs/seo/artifacts/corpus-search, 70,729 unique pages, deduplicated by deck-file sha256 + page) was searched for market share, market penetration, "just/only X%" and capture/penetrate near a percentage; 181 pages matched after excluding public companies, SPACs, mining, oil and financial firms.
Twenty candidate pages were rendered from the original public deck files and read from the images; fourteen are used: Pillar 9, Studnt 23, Peer to Pier 9, Matchory 10, Modzify 18, Lord of the Trees 5, iSprout 8, Beyond Bars 6, Breathe Easy 10, Filevine 9, Hard Asset Management 12, Angle Health 10, Smatbeba 17 and Delivery Bros 3.
Left out: Calltree 5 (assumptions too small to read reliably at source resolution), Chiper 13 and Novoflow 7 (penetration shown among other targets; same lesson as Studnt), Edurino 13 and GradGears 9 (same lesson as iSprout and Modzify); Almanac 19 (deck file unavailable); Brain Backups 8, Lawkick 9 and Complyant 5 (already used in other guides). Market-structure pages (incumbents' shares, such as Agility Health 11 or Alan 16) were excluded because they describe competitors, not a target.
Figures are as printed on each slide; we did not have the companies' underlying data. How we built this: drafted and checked with AI assistance (editorial model review against the original slide images); no human editor has reviewed this guide.