Market Growth Rate (CAGR) on a Pitch Deck: Does It Match?
How founders show market growth rates on a pitch deck, and how to check a CAGR against its own start and end figures.
How to Show Market Growth (CAGR) on Your Pitch Deck
Fourteen market slides from real pitch decks that state a growth rate. For each, we recalculate the rate from the slide's own start and end figures, note what the slide leaves out, and say whether the growth figure describes the market the company actually sells into.
TL;DR
A compound annual growth rate (CAGR) is the steady yearly rate that would take a market from one value to another over a stated number of years. On a pitch deck it supports the claim that a market is growing, but a CAGR is only checkable when the slide gives three things together: a start value with its year, an end value with its year, and the source. With those, anyone can recalculate it: divide the end value by the start value, raise the result to the power of one over the number of years, and subtract one.
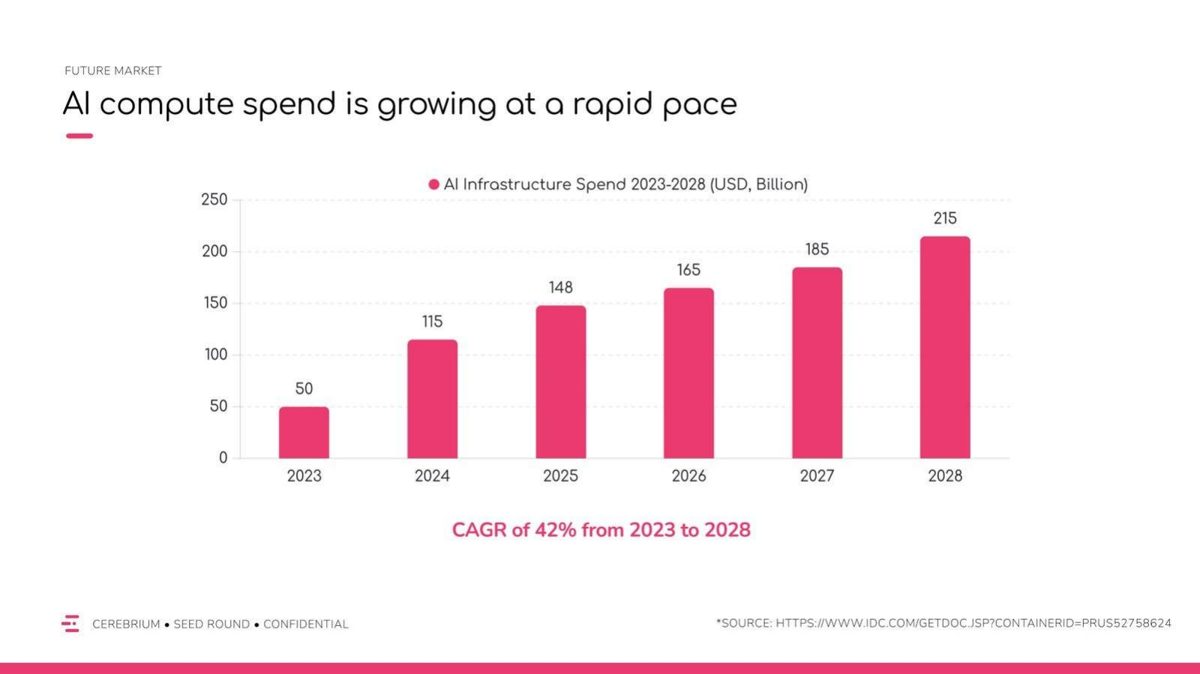
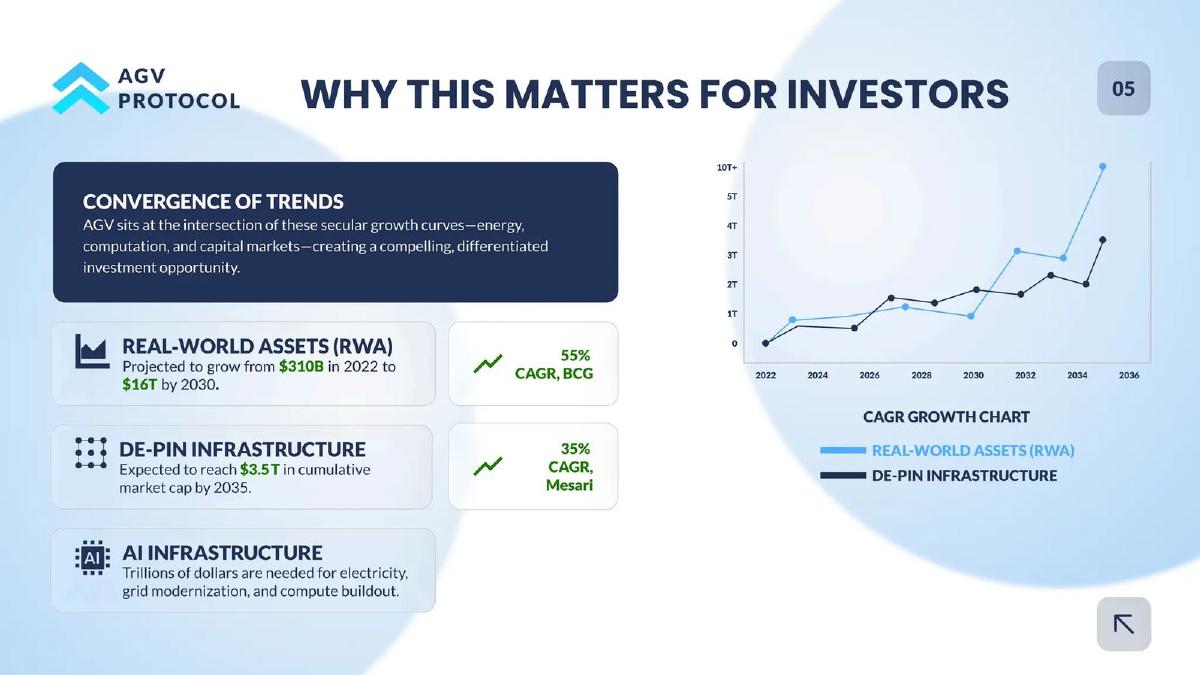
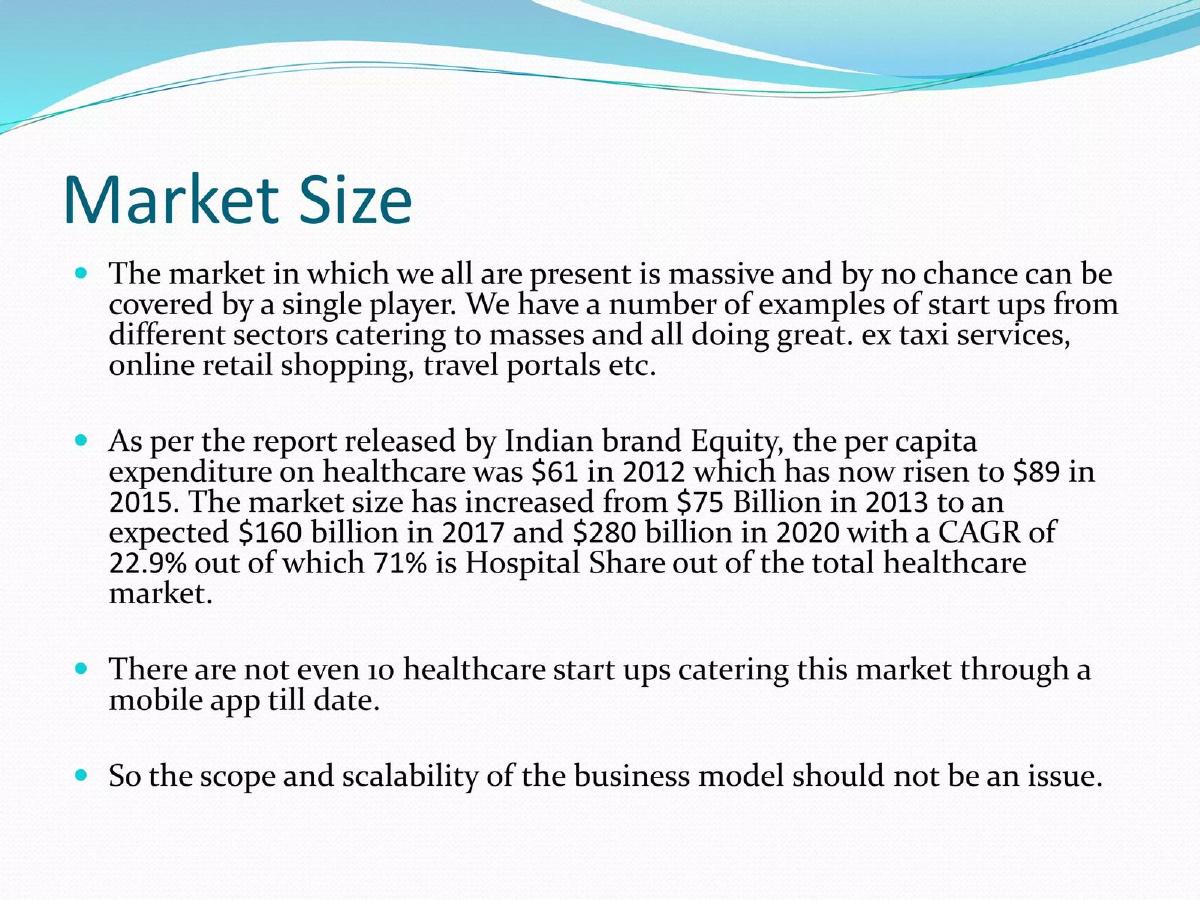
In this set, most CAGRs match their own figures to within rounding: Boxcryptor, Apheros, Breathe Easy, AI Beauty Bot and Dartrays all check out. Three do not. Cerebrium's chart runs from $50B in 2023 to $215B in 2028, which is about 34% a year, not the 42% it states. AGV Protocol's $310B in 2022 to $16T by 2030 is about 64% a year, not 55%. Call The's $75 billion in 2013 to $280 billion in 2020 is about 21%, not 22.9% (all our calculations). Several other slides state a rate with no base year, or apply a growth rate from a much larger market than the one the company addresses.
Market growth slides from real pitch decks
Each example records what the slide states, our recalculation of its growth rate from its own figures, and what to copy or avoid. "Our calculation" marks arithmetic we did; the slides do not show it.
Cerebrium market slide — slide 18
Serverless AI infrastructure company. "Future Market" page of a seed-round deck.
Cerebrium deck, slide 18. Exact stored slide matched to this analysis.
Our analysis: A stated CAGR that its own chart does not support.
Evidence and limitation: Our calculation: $50B to $215B over five years is about 33.9% a year, not 42%. Spend rises 130% from 2023 to 2024, then 12% to 29% a year.
What a founder can adapt: Recalculate the rate from the chart's endpoints, or give the source's own start value if it differs.
Supporting analysis
What the deck claims: "AI Infrastructure Spend 2023-2028 (USD, Billion)": 50, 115, 148, 165, 185, 215. "CAGR of 42% from 2023 to 2028". Source: an IDC document link.
Presentation choice: The chart shows every year and cites a source, so the mismatch is easy to find and fix.
When it does not fit: Don't put a CAGR under a chart without checking it against the first and last bars.
Web3 infrastructure project. "Why This Matters for Investors" page of an institutional deck.
AGV Protocol deck, slide 6. Exact stored slide matched to this analysis.
Our analysis: Text, stated rate and chart that describe three different growth paths.
Evidence and limitation: Our calculation: $310B to $16T in eight years is about 64% a year; 55% would reach about $10.3T. The chart shows real-world assets near $1T in 2030.
What a founder can adapt: Use the source's own endpoints and rate, and redraw the chart from them.
Supporting analysis
What the deck claims: Real-world assets "Projected to grow from $310B in 2022 to $16T by 2030", "55% CAGR, BCG". DePIN infrastructure "Expected to reach $3.5T in cumulative market cap by 2035", "35% CAGR, Mesari". Chart "CAGR Growth Chart" from 2022 to 2036.
Presentation choice: It names a source for each rate, which lets a reader go back to the original.
When it does not fit: Don't draw an illustrative curve under a label that says it shows the CAGR.
Indian healthcare booking company. "Market Size" page.
Call The deck, slide 5. Exact stored slide matched to this analysis.
Our analysis: A stated rate that none of the slide's own periods produces, mixing actuals and forecasts.
Evidence and limitation: Our calculation: 2013–2020 is about 20.7% a year; 2013–2017 about 20.9%; 2017–2020 about 20.5%. No period gives 22.9%.
What a founder can adapt: State which values are forecasts and recalculate the rate for the period quoted.
Supporting analysis
What the deck claims: Per capita healthcare spending "$61 in 2012" rising to "$89 in 2015"; market "increased from $75 Billion in 2013 to an expected $160 billion in 2017 and $280 billion in 2020 with a CAGR of 22.9%"; 71% hospital share. Source: "a report released by Indian brand Equity".
Presentation choice: It gives three dated values, so the rate can be tested over each period.
When it does not fit: Don't combine an actual figure and two forecasts in one sentence without labelling them.
German cloud encryption company, deck presented under its company name acomba. Market page in German.
Boxcryptor (acomba) deck, slide 3. Exact stored slide matched to this analysis.
Our analysis: Two dated values, a rate that matches them and a dated source.
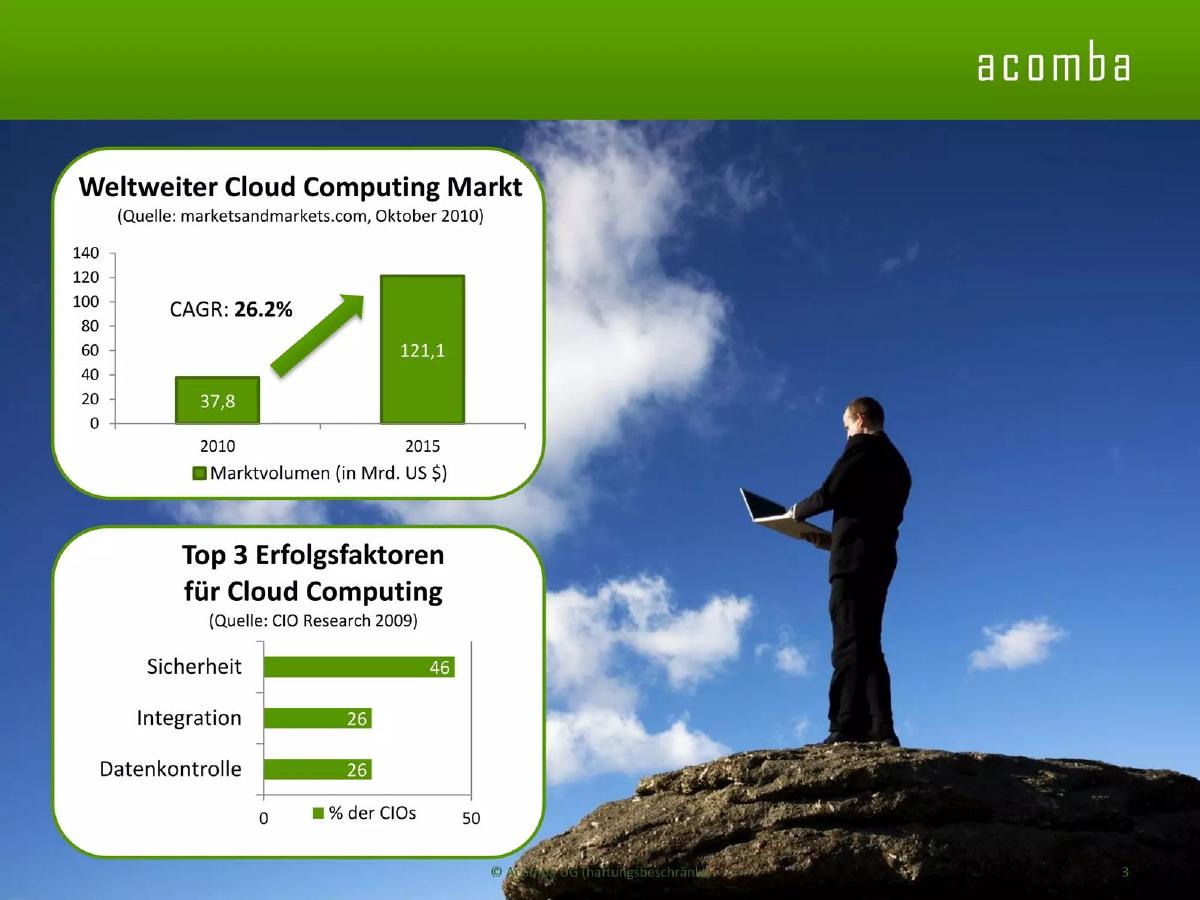
Evidence and limitation: Our calculation: 121.1 ÷ 37.8 over five years is 26.2% a year exactly.
What a founder can adapt: Add the market Boxcryptor addresses within cloud computing.
Supporting analysis
What the deck claims: "Weltweiter Cloud Computing Markt" (worldwide cloud computing market): 37.8 (2010) and 121.1 (2015), in billions of US dollars; "CAGR: 26.2%"; source "marketsandmarkets.com, Oktober 2010".
Presentation choice: Every input needed to check the rate is on the slide, and it checks.
When it does not fit: Don't draw bars for years the source does not report.
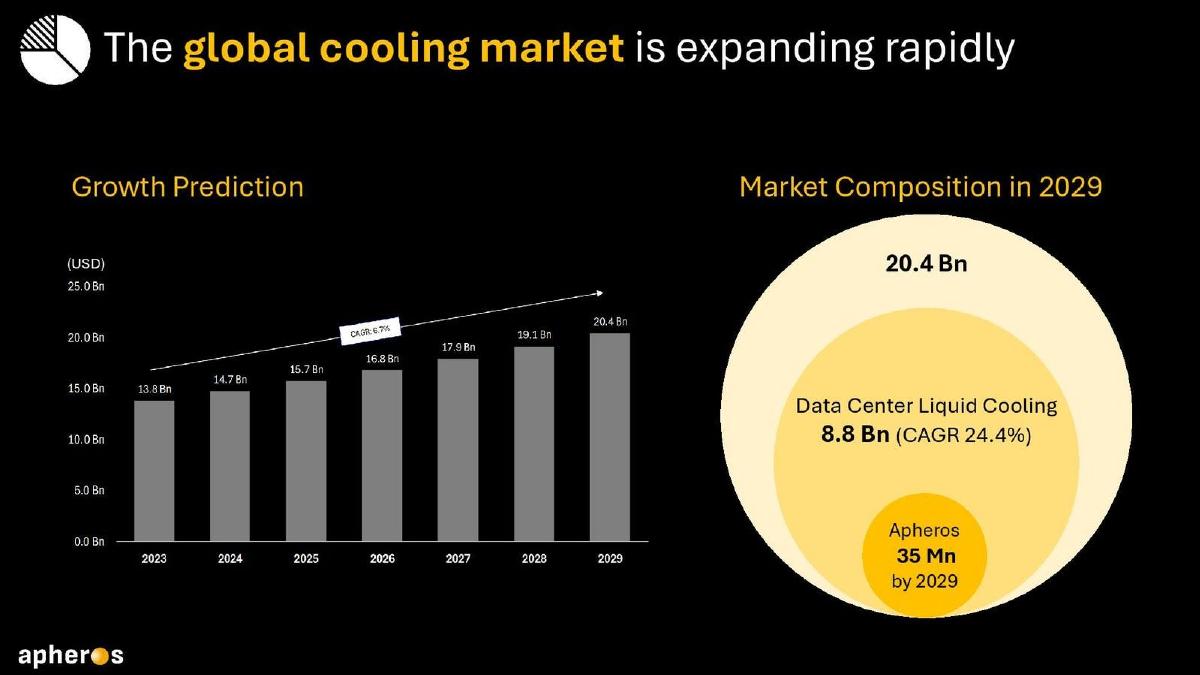
Swiss thermal materials company. "The global cooling market is expanding rapidly".
Apheros deck, slide 6. Exact stored slide matched to this analysis.
Our analysis: A checkable total-market rate beside an uncheckable segment rate.
Evidence and limitation: Our calculation: 13.8 to 20.4 over six years is 6.7% a year. The 24.4% has no start value. Apheros's target is about 0.4% of the 8.8 Bn segment.
What a founder can adapt: Give the liquid cooling segment's start value and a source for both rates.
Supporting analysis
What the deck claims: Growth Prediction: 13.8 Bn (2023), 14.7, 15.7, 16.8, 17.9, 19.1, 20.4 Bn (2029), CAGR label about 6.7%. Market Composition in 2029: 20.4 Bn; "Data Center Liquid Cooling 8.8 Bn (CAGR 24.4%)"; "Apheros 35 Mn by 2029".
Presentation choice: The overall chart reconciles year by year.
When it does not fit: Don't state a segment CAGR with only its end value.
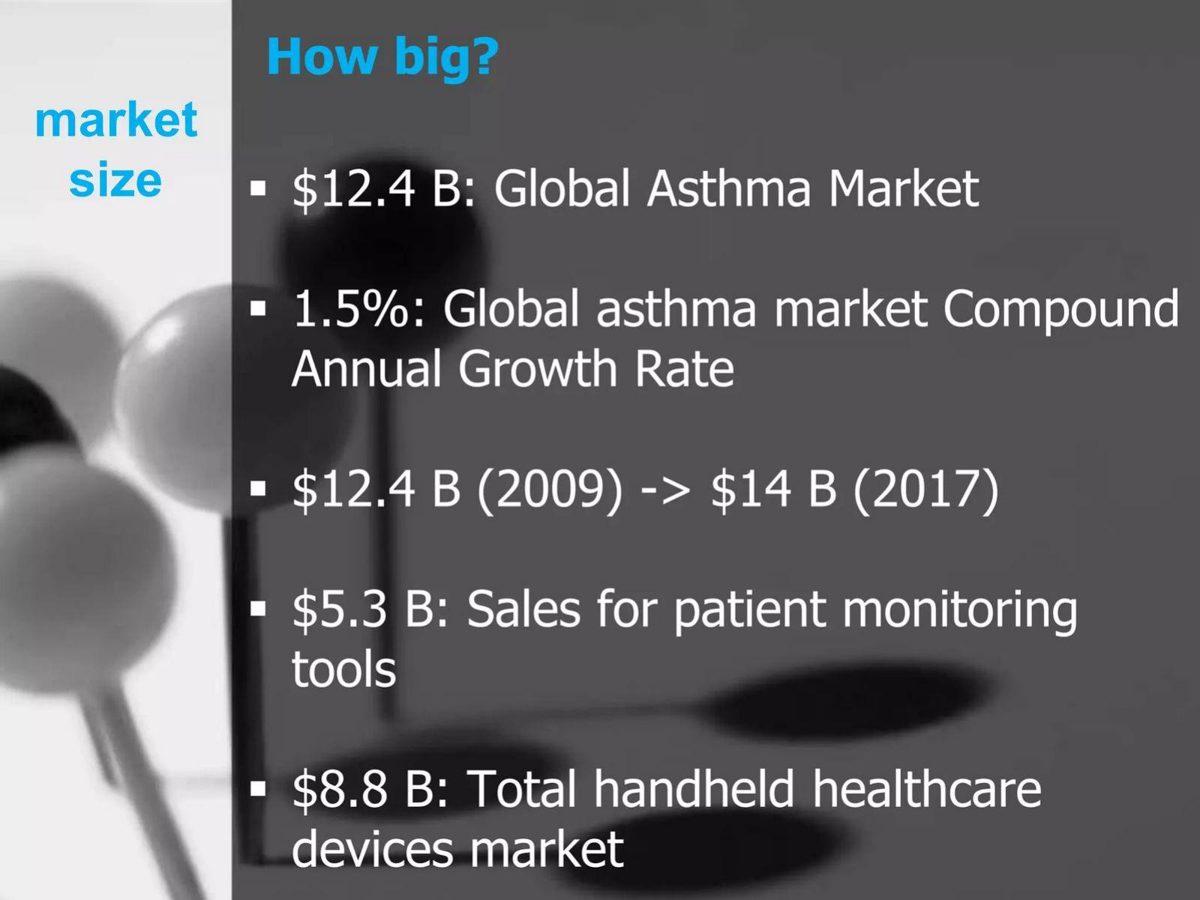
Breathe Easy deck, slide 8. Exact stored slide matched to this analysis.
Our analysis: An honest low growth rate, with the headline figure's year given only lower down.
Evidence and limitation: Our calculation: $12.4B to $14B over eight years is about 1.5% a year, matching the stated rate.
What a founder can adapt: Put the year next to the headline $12.4B and add growth for the monitoring-tools segment.
Supporting analysis
What the deck claims: "$12.4 B: Global Asthma Market"; "1.5%: Global asthma market Compound Annual Growth Rate"; "$12.4 B (2009)" to "$14 B (2017)"; "$5.3 B: Sales for patient monitoring tools"; "$8.8 B: Total handheld healthcare devices market".
Presentation choice: It shows a founder can present a slow-growing market plainly.
When it does not fit: Don't present an old figure as today's market size.
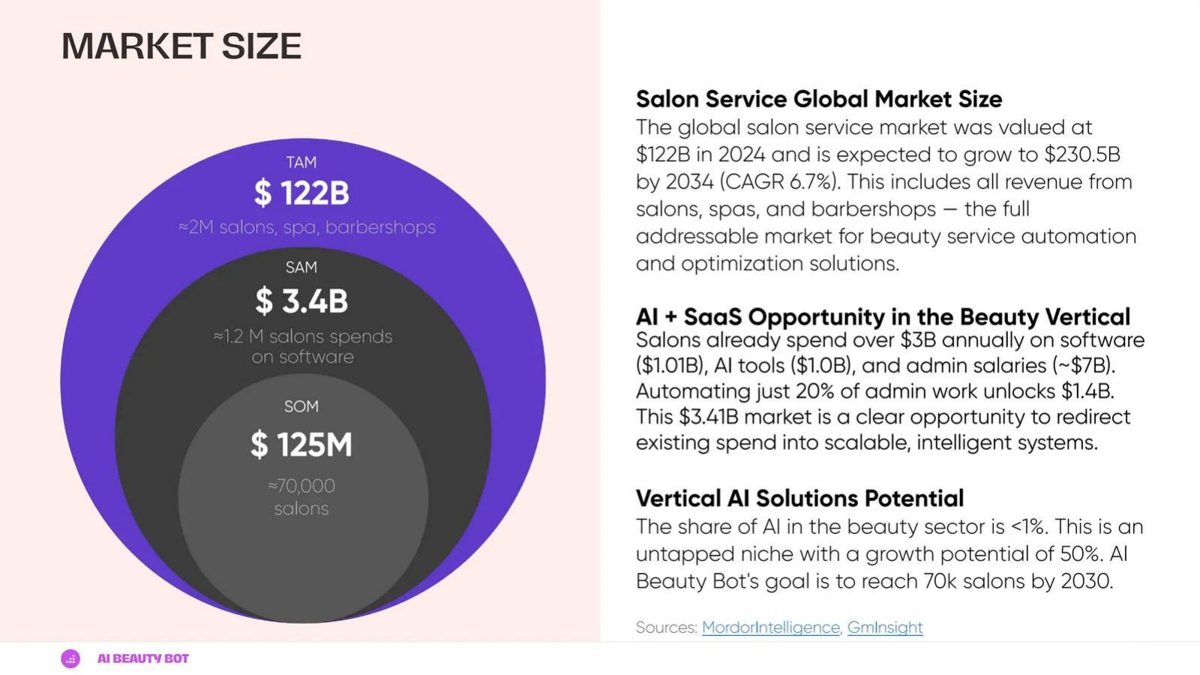
AI software for salons. "Market Size" page with TAM, SAM and SOM circles.
AI Beauty Bot deck, slide 10. Exact stored slide matched to this analysis.
Our analysis: A checkable market CAGR beside an unexplained 50% growth figure.
Evidence and limitation: Our calculation: about 6.6% a year over ten years, matching within rounding. The $3.41B SAM equals $1.01B + $1.0B + $1.4B.
What a founder can adapt: Give a period and base for the 50% figure, or remove it.
Supporting analysis
What the deck claims: Salon services "valued at $122B in 2024 and is expected to grow to $230.5B by 2034 (CAGR 6.7%)"; SAM $3.4B, SOM $125M; salons spend "over $3B annually on software ($1.01B), AI tools ($1.0B), and admin salaries (~$7B)"; "growth potential of 50%". Sources: Mordor Intelligence, GMInsight.
Presentation choice: Start value, end value, years and sources are all given for the TAM.
When it does not fit: Don't mix a sourced CAGR with an unsourced growth claim on one page.
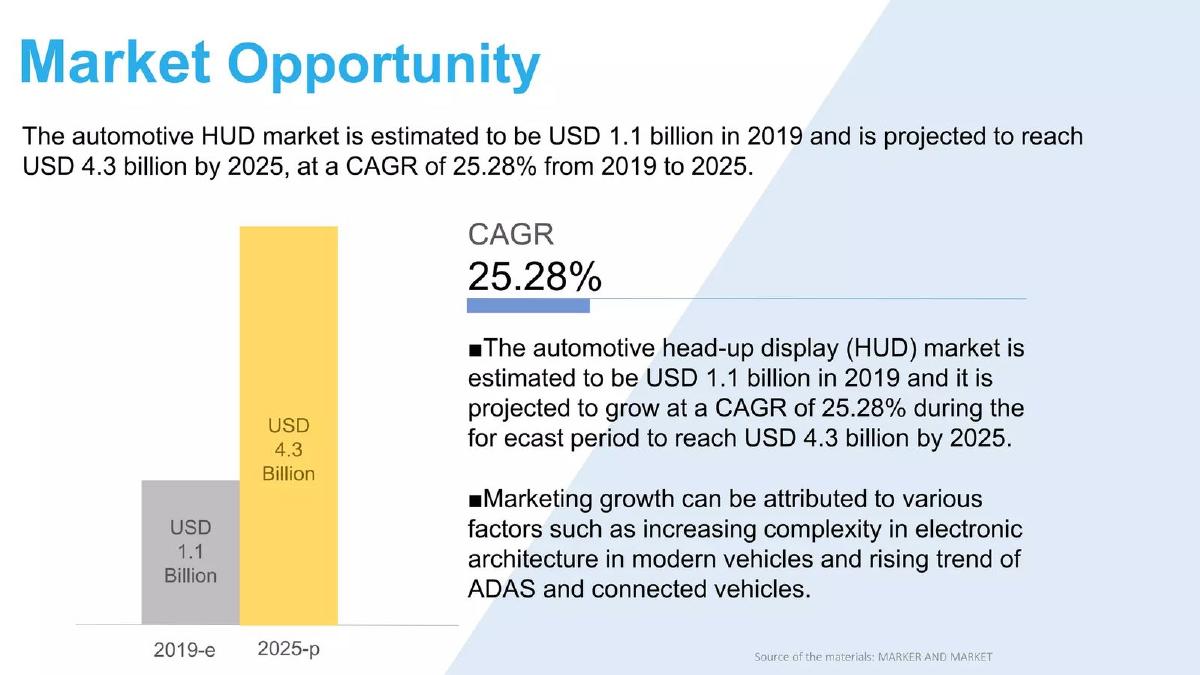
Dartrays deck, slide 5. Exact stored slide matched to this analysis.
Our analysis: A correct rate given to more precision than the slide's figures support.
Evidence and limitation: Our calculation: about 25.5% a year; with one-decimal rounding, the endpoints support roughly 24.3% to 26.7%.
What a founder can adapt: Round the rate to 25%, or give the report's unrounded endpoints.
Supporting analysis
What the deck claims: Automotive HUD market "USD 1.1 billion in 2019", "projected to reach USD 4.3 billion by 2025, at a CAGR of 25.28% from 2019 to 2025". Source: "MARKER AND MARKET".
Presentation choice: Dated endpoints and a source make it checkable.
When it does not fit: Don't quote two decimal places when the inputs are rounded to one.
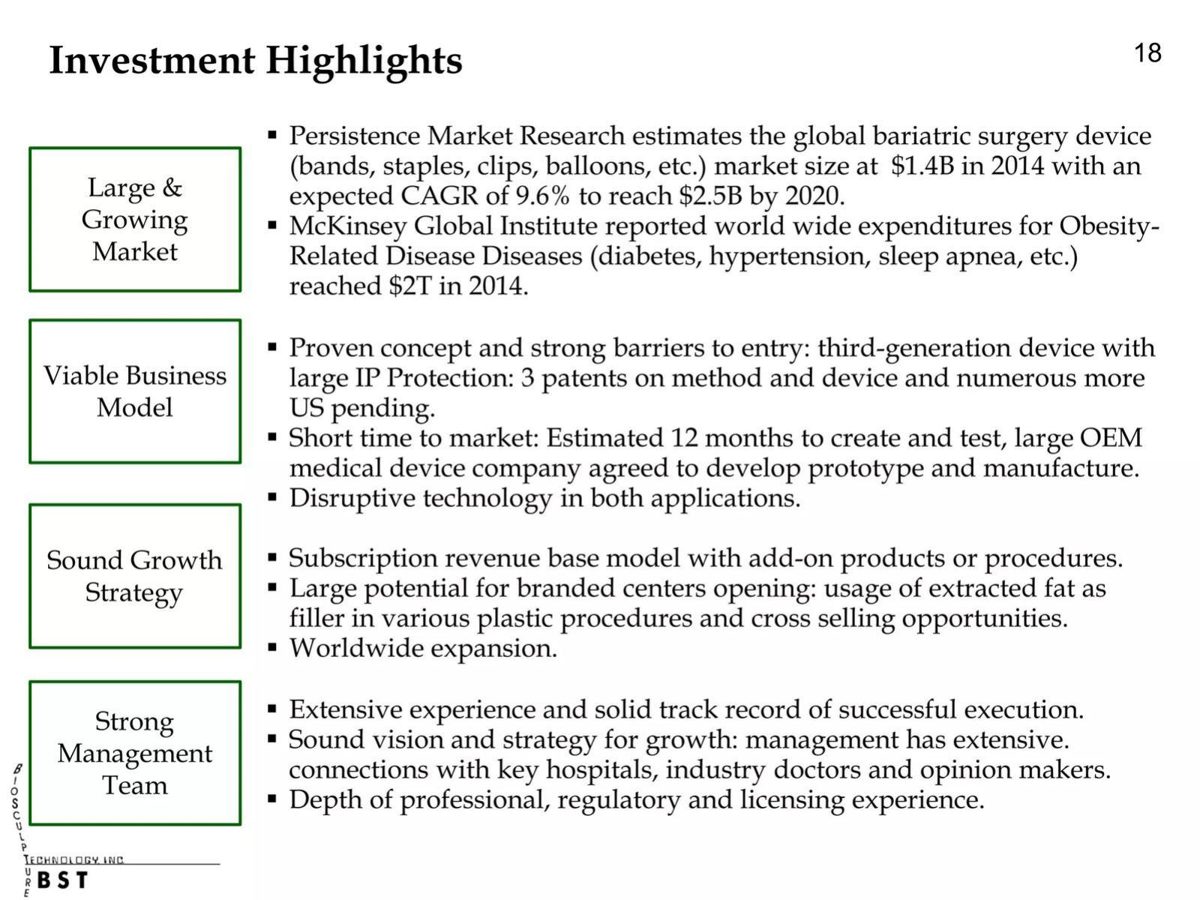
Medical device company. "Investment Highlights" page (numbered 18) of an August 2017 deck.
BioSculpture Technology deck, slide 19. Exact stored slide matched to this analysis.
Our analysis: A small apparent mismatch that rounding explains.
Evidence and limitation: Our calculation: 1.4 to 2.5 over six years is about 10.1% a year; allowing for rounding, 9.1% to 11.2%, so 9.6% is consistent.
What a founder can adapt: Say which segment of bariatric devices the company addresses.
Supporting analysis
What the deck claims: Persistence Market Research estimates the bariatric surgery device market "at $1.4B in 2014 with an expected CAGR of 9.6% to reach $2.5B by 2020"; McKinsey reports obesity-related disease spending of "$2T in 2014".
Presentation choice: It names the research firm and both dated endpoints.
When it does not fit: Don't call a rate wrong before checking whether rounded endpoints explain the difference.
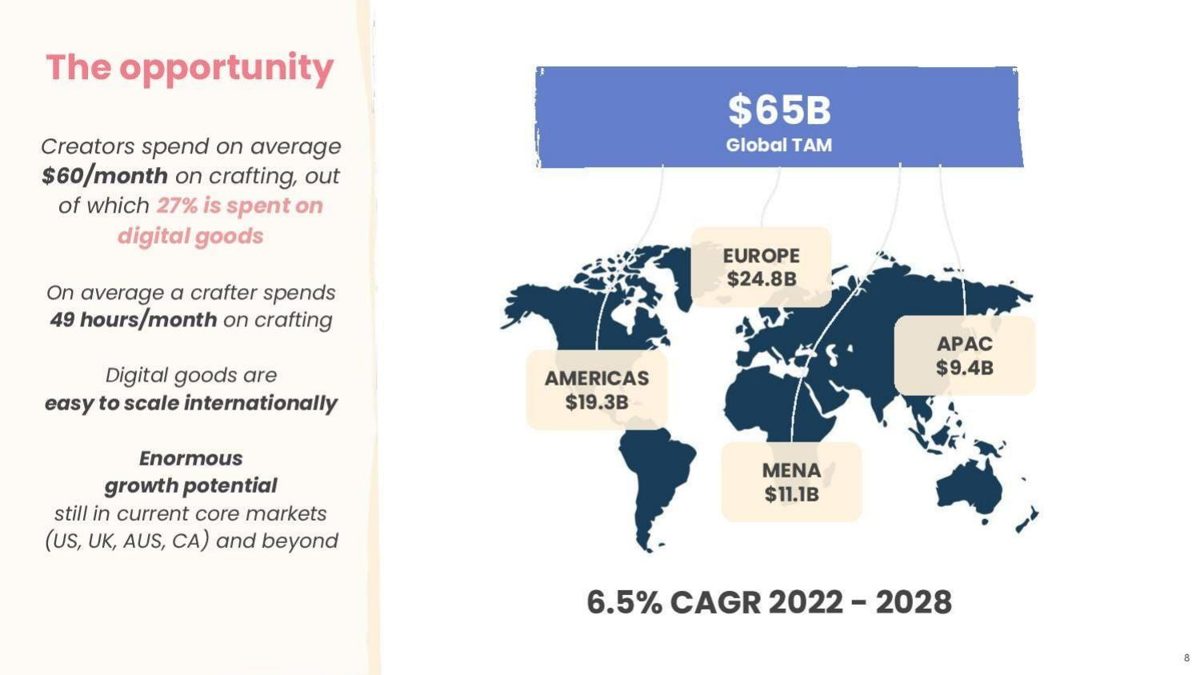
Digital crafting assets marketplace. "The opportunity" page.
Creative Fabrica deck, slide 8. Exact stored slide matched to this analysis.
Our analysis: A growth rate with a period but no base year for the market it grows.
Evidence and limitation: Our calculation: regions add to $64.6B. If $65B is the 2022 value, 2028 is about $94.8B; if 2028, 2022 was about $44.5B. No source is given.
What a founder can adapt: Say which year the $65B describes and name the source.
Supporting analysis
What the deck claims: "$65B Global TAM": Europe $24.8B, Americas $19.3B, MENA $11.1B, APAC $9.4B; "6.5% CAGR 2022 - 2028"; creators spend "$60/month on crafting", 27% on digital goods.
Presentation choice: The regional split reconciles to the headline.
When it does not fit: Don't pair a CAGR period with an undated market size.
Cake deck, slide 10. Exact stored slide matched to this analysis.
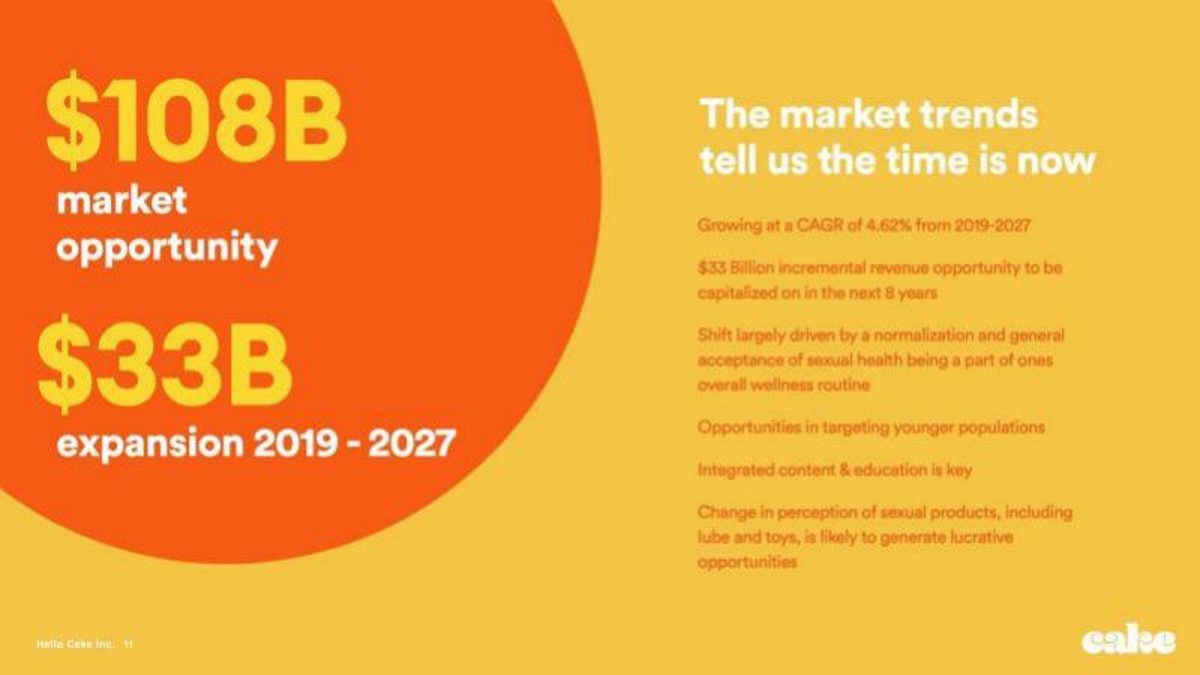
Our analysis: A headline market size that is an unlabelled end-year forecast.
Evidence and limitation: Our calculation: 4.62% for eight years is about 43.5% growth. Only a 2019 base of about $75.2B gives a $33B increase, so $108B is the 2027 forecast.
What a founder can adapt: Label $108B as the 2027 forecast and give the 2019 figure and source.
Supporting analysis
What the deck claims: "$108B market opportunity"; "$33B expansion 2019 - 2027"; "Growing at a CAGR of 4.62% from 2019-2027"; "$33 Billion incremental revenue opportunity to be capitalized on in the next 8 years".
Presentation choice: Rate, period and increase are all given, so the base can be worked out.
When it does not fit: Don't headline a future-year forecast as the market opportunity without its year.
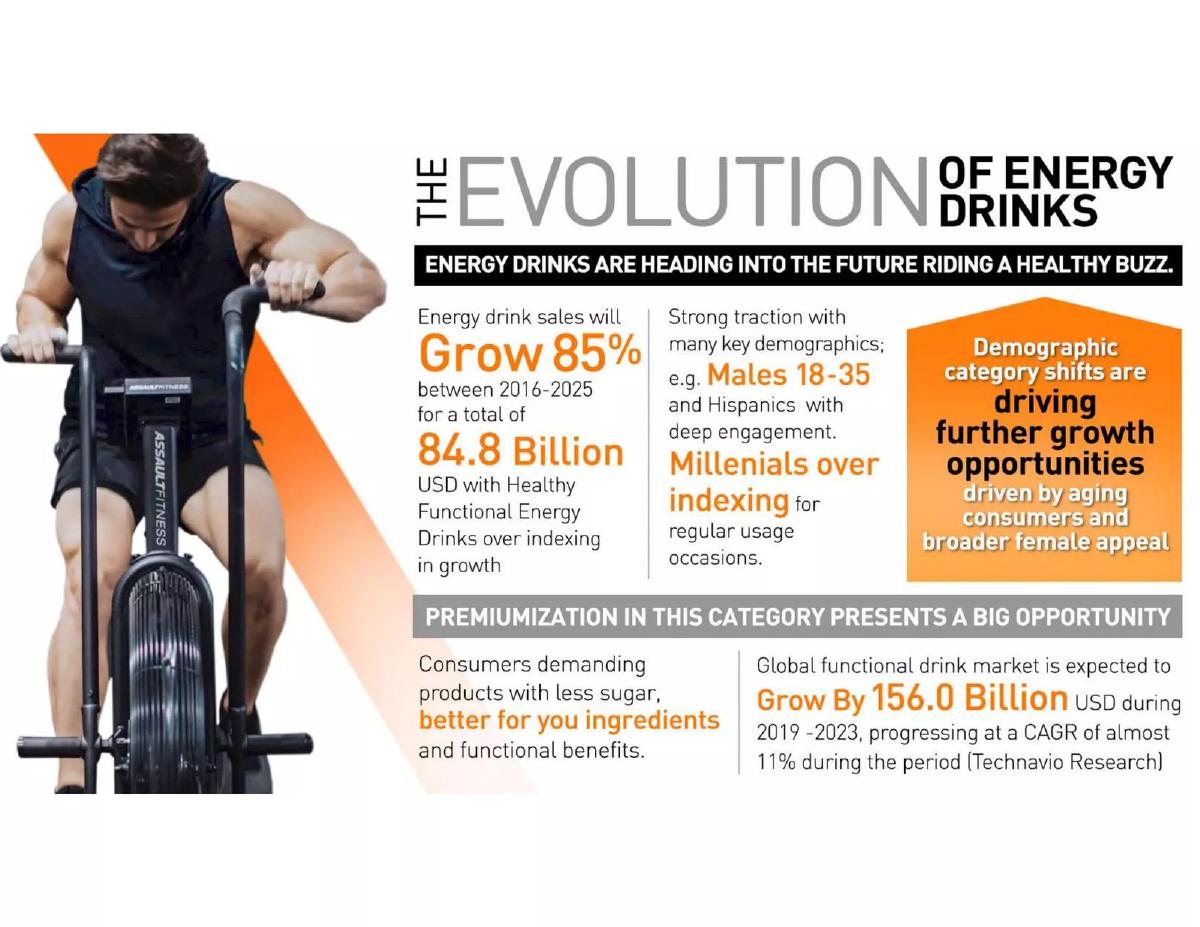
Functional energy drink company. "The Evolution of Energy Drinks".
Celsius deck, slide 5. Exact stored slide matched to this analysis.
Our analysis: Growth stated as increases and percentages with no start values.
Evidence and limitation: Our calculation: 85% over nine years is about 7.1% a year. An 11% CAGR over four years with a $156B increase implies about $301B growing to about $457B.
What a founder can adapt: Give start and end values for both markets and say which one Celsius sells into.
Supporting analysis
What the deck claims: "Energy drink sales will Grow 85% between 2016-2025 for a total of 84.8 Billion USD"; "Global functional drink market is expected to Grow By 156.0 Billion USD during 2019-2023, progressing at a CAGR of almost 11% during the period (Technavio Research)".
Presentation choice: It names Technavio for the second claim.
When it does not fit: Don't write "grow 85% for a total of" when the reader can't tell if the total is the end value or the increase.
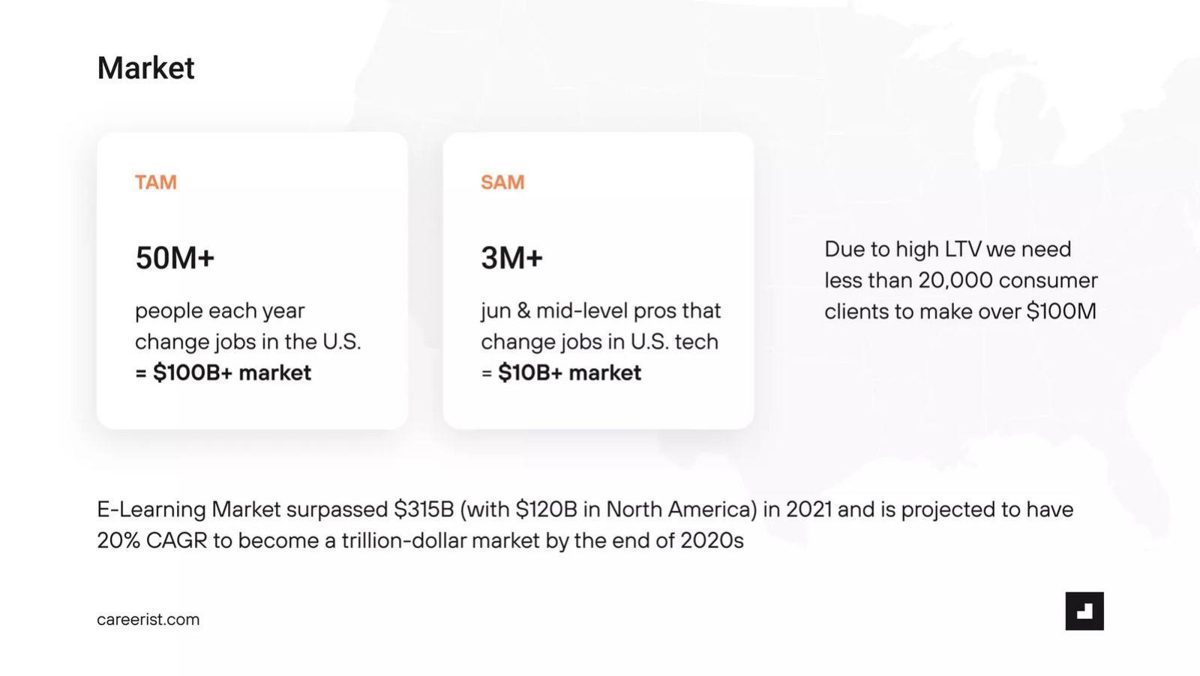
Career training company for tech job seekers. "Market" page.
Careerist deck, slide 11. Exact stored slide matched to this analysis.
Our analysis: A consistent growth rate for a broader market than the one the company addresses.
Evidence and limitation: Our calculation: $315B at 20% passes $1 trillion in 2028, so the sentence is consistent, but it describes e-learning, not the $100B+ TAM.
What a founder can adapt: Give a growth rate for job changers or tech hiring, or explain why e-learning growth applies.
Supporting analysis
What the deck claims: TAM "50M+ people each year change jobs in the U.S. = $100B+ market"; SAM "3M+ jun & mid-level pros that change jobs in U.S. tech = $10B+ market"; "E-Learning Market surpassed $315B (with $120B in North America) in 2021 and is projected to have 20% CAGR to become a trillion-dollar market by the end of 2020s".
Presentation choice: The TAM and SAM are defined by who buys, which makes them testable.
When it does not fit: Don't borrow a larger market's growth rate for your own TAM.
Product analytics company. "Market Size Overview (Top Down)" page of an early deck.
Amplitude deck, slide 24. Exact stored slide matched to this analysis.
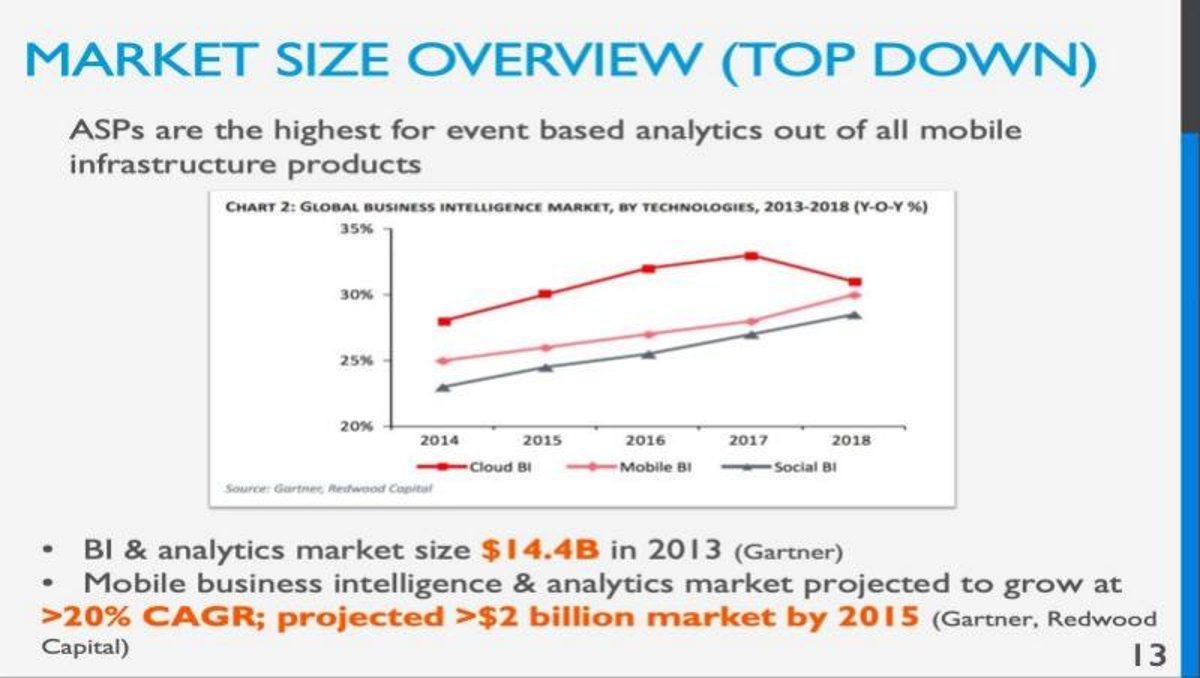
Our analysis: Three accurate-looking numbers that describe three different things.
Evidence and limitation: The $14.4B is the whole BI market; the rate and $2 billion are for mobile BI; the chart plots yearly growth percentages, not size.
What a founder can adapt: Choose one market, the one Amplitude sells into, and give its size, growth and source together.
Supporting analysis
What the deck claims: Chart of year-on-year growth for cloud, mobile and social BI, 2014–2018 (Gartner, Redwood Capital); "BI & analytics market size $14.4B in 2013 (Gartner)"; mobile BI "projected to grow at more than 20% CAGR; projected more than $2 billion market by 2015".
Presentation choice: Each figure is sourced and dated.
When it does not fit: Don't put a growth-percentage chart on a market-size slide without saying what it measures.
The first four columns report what each slide states. The last two record our recalculation from the slide's own figures.
Example
Start
End
Stated CAGR
Our recalculation
Verdict
Cerebrium
$50B (2023)
$215B (2028)
42%
About 33.9%
Does not match
AGV Protocol
$310B (2022)
$16T (2030)
55%
About 64%
Does not match; chart differs
Call The
$75B (2013)
$280B (2020)
22.9%
About 20.7%
Does not match
Boxcryptor
$37.8B (2010)
$121.1B (2015)
26.2%
26.2%
Matches
Apheros
13.8 Bn (2023)
20.4 Bn (2029)
About 6.7%
6.7%
Matches; segment rate uncheckable
Breathe Easy
$12.4B (2009)
$14B (2017)
1.5%
About 1.5%
Matches
AI Beauty Bot
$122B (2024)
$230.5B (2034)
6.7%
About 6.6%
Matches within rounding
Dartrays
$1.1B (2019)
$4.3B (2025)
25.28%
About 25.5%
Matches; false precision
BioSculpture
$1.4B (2014)
$2.5B (2020)
9.6%
About 10.1%
Consistent with rounding
Creative Fabrica
Not stated
Not stated
6.5%
Cannot check
No base year
Cake
Not stated
$108B (implied 2027)
4.62%
Base about $75.2B
Headline is a forecast
Celsius
Not stated
Not stated
Almost 11%
Cannot check
Increase only
Careerist
$315B (2021)
About $1T (2020s)
20%
Consistent
Different market from TAM
Amplitude
Not stated
More than $2B (2015)
More than 20%
Cannot check
Mixed measures
Key Takeaways
Recalculate every CAGR. Cerebrium's figures give about 34% a year, not 42%; AGV Protocol's give about 64%, not 55% (our calculations).
Give the start year. Creative Fabrica's $65B with 6.5% CAGR 2022–2028 does not say whether $65B is the 2022 or 2028 figure; Cake's $108B turns out to be the end value.
Use the growth rate of the market you sell into. Careerist quotes 20% growth for all of e-learning beside a $100B+ job-change TAM.
Don't use two decimal places on rounded inputs. Dartrays' 25.28% comes from endpoints rounded to one decimal; they support anything from about 24.3% to 26.7% (our calculation).
Make the chart agree with the text. AGV Protocol's text says $16T by 2030; its chart shows real-world assets at roughly $1T in 2030.
Label old data as old. Breathe Easy's $12.4B headline is the 2009 figure; its 2017 forecast is $14B.
Check and write your growth line
Fill this in from the source report. If a field is missing from the report, leave it blank on the slide rather than estimate it.
Market definition. Which market exactly, and is it your TAM, SAM or a broader category?
Start. Value and year, as published?
End. Value and year, and is it a forecast?
Stated CAGR. What rate does the source give?
Recalculated CAGR. (End ÷ start) to the power of 1/years, minus 1: does it match within rounding?
Source. Research firm, report name and publication year?
Copyable framework: [Market], [start value] in [year] to [end value] in [year] (forecast), [CAGR]% a year ([source], [publication year]). This is our [TAM/SAM/broader category]; [one reason our segment grows at a similar rate].
Illustrative example 1 — written by us
Before: Massive market growing at 42% CAGR.
After: AI infrastructure spend, $50B in 2023 to a forecast $215B in 2028, about 34% a year (research firm, report year). This is a broader category than our SAM; inference workloads are the fastest-growing part of it.
What improved: Uses Cerebrium's own chart figures with a recalculated rate, labels the forecast and connects the category to the company's market.
What a CAGR does and does not tell an investor
A compound annual growth rate smooths a market's path into one number. If a market grows from $100 to $200 over five years, its CAGR is about 14.9%, whether it grew evenly, fell and then jumped, or doubled in the first year and stayed flat. That makes CAGR useful for comparing markets and dangerous as a description of any one year. A market with a 14.9% CAGR could have shrunk last year.
On a pitch deck, market growth supports two separate claims. The first is that the market is large enough to build a big company in. The second is that it is growing, so a new company can win share without taking all of it from incumbents. The second claim is where CAGR appears, and it is often the least-checked number on the slide, because it comes from a market research report and founders repeat it without checking it against the report's own start and end values.
The check takes a calculator and thirty seconds. Divide the end value by the start value; raise the result to the power of one divided by the number of years between them; subtract one. For $50B in 2023 to $215B in 2028, that is 215 ÷ 50 = 4.3; 4.3 to the power of 1/5 is about 1.339; so the CAGR is about 33.9%. Investors who do this and find a mismatch will ask what else on the deck was not checked.
A CAGR also says nothing about how much of the market a startup can reach. Two slides in this set quote the growth rate of a large, general market next to a much narrower addressable market. The number may be accurate and still irrelevant.
Slides whose rate does not match their own figures
Cerebrium's page 18, "AI compute spend is growing at a rapid pace", charts "AI Infrastructure Spend 2023-2028 (USD, Billion)" at 50, 115, 148, 165, 185 and 215, with the line "CAGR of 42% from 2023 to 2028" and an IDC source link. Our calculation: $50B to $215B over five years is about 33.9% a year. The 42% cannot come from these endpoints. The chart itself has an unusual shape: spend more than doubles from 2023 to 2024 (130%, our calculation), then grows between about 12% and 29% a year. A CAGR hides that shape; the chart shows it. The slide does not say whether the 2023 figure is on the same basis as the later years.
AGV Protocol's page 6, "Why This Matters for Investors", says real-world assets are "Projected to grow from $310B in 2022 to $16T by 2030" beside "55% CAGR, BCG". Our calculation: $310B to $16T over eight years is about 64% a year; at 55% a year, $310B would reach about $10.3T by 2030. The chart on the same page, labelled "CAGR Growth Chart", shows real-world assets at roughly $1T in 2030 and reaching the top of its axis, "10T+", only around 2035. The text, the stated rate and the chart describe three different paths. The slide also cites DePIN infrastructure at "35% CAGR, Mesari" reaching "$3.5T in cumulative market cap by 2035" with no start value, so that rate cannot be checked.
Call The's page 5, "Market Size", says Indian healthcare "has increased from $75 Billion in 2013 to an expected $160 billion in 2017 and $280 billion in 2020 with a CAGR of 22.9%". Our calculation: 2013 to 2020 gives about 20.7% a year; 2013 to 2017 about 20.9%; 2017 to 2020 about 20.5%. None of the three periods gives 22.9%. The difference matters less than the fact that the slide's own numbers do not produce it. The slide also mixes an actual figure (2013) with two forecasts (2017 and 2020) in one sentence without marking which is which, and names the source only as "a report released by Indian brand Equity".
Slides whose rate checks out
Boxcryptor's page 3 (the deck was presented under its company name, acomba) shows "Weltweiter Cloud Computing Markt" — the worldwide cloud computing market — at 37.8 in 2010 and 121.1 in 2015, in billions of US dollars, with "CAGR: 26.2%" and the source "marketsandmarkets.com, Oktober 2010". Our calculation: 121.1 ÷ 37.8 over five years is 26.2% a year exactly. The chart has only two bars, which is honest: it does not draw a smooth curve through years it has no data for.
Apheros's page 6, "The global cooling market is expanding rapidly", charts the market from 13.8 Bn in 2023 to 20.4 Bn in 2029, with a CAGR label of about 6.7% on the arrow. Our calculation: 13.8 to 20.4 over six years is 6.7% a year, and the bars in between rise by amounts consistent with that. The slide then nests "Data Center Liquid Cooling 8.8 Bn (CAGR 24.4%)" inside the 2029 total and "Apheros 35 Mn by 2029" inside that. The 24.4% has no start value, so it cannot be checked, and the slide gives no source for either rate. Apheros's own target is about 0.4% of the liquid cooling segment in 2029 (our calculation).
Breathe Easy's page 8, "How big?", lists "$12.4 B: Global Asthma Market", "1.5%: Global asthma market Compound Annual Growth Rate" and "$12.4 B (2009)" to "$14 B (2017)". Our calculation: that is about 1.5% a year over eight years, so the figures agree. The slide is useful as a contrast: a founder who shows a low growth rate honestly is making the case that the opportunity is winning share in a large, stable market, not riding growth. The first line presents the 2009 figure as the market size without its year; the year appears only two lines later.
AI Beauty Bot's page 10, "Market Size", says the global salon service market "was valued at $122B in 2024 and is expected to grow to $230.5B by 2034 (CAGR 6.7%)", citing Mordor Intelligence and GMInsight. Our calculation: about 6.6% a year over ten years, which matches within rounding. The same page is less consistent elsewhere: salons "spend over $3B annually on software ($1.01B), AI tools ($1.0B), and admin salaries (~$7B)", and "Automating just 20% of admin work unlocks $1.4B"; the $3.41B SAM is the sum of $1.01B, $1.0B and $1.4B (our calculation). The "growth potential of 50%" for AI in beauty has no period or base.
Dartrays' page 5, "Market Opportunity", says the automotive head-up display market is "USD 1.1 billion in 2019" and "projected to reach USD 4.3 billion by 2025, at a CAGR of 25.28%", with the source given as "MARKER AND MARKET". Our calculation: 1.1 to 4.3 over six years is about 25.5% a year, close to the stated rate. Because both endpoints are rounded to one decimal place, they are consistent with any rate from about 24.3% to 26.7%. The two decimal places in 25.28% come from the report, not from the figures on the slide; a founder quoting it should either give the report's unrounded endpoints or round the rate to 25%.
BioSculpture's page 19, "Investment Highlights" (numbered 18 on the page), says Persistence Market Research estimates the bariatric surgery device market "at $1.4B in 2014 with an expected CAGR of 9.6% to reach $2.5B by 2020". Our calculation: 1.4 to 2.5 over six years is about 10.1% a year. Allowing for rounding of both endpoints, the range is about 9.1% to 11.2%, so 9.6% is consistent with the report's unrounded figures. This is the right way to judge a small mismatch: check whether rounding could explain it before calling it an error.
Slides with no base year, or the wrong base
Creative Fabrica's page 8, "The opportunity", shows "$65B Global TAM" split into Europe $24.8B, Americas $19.3B, MENA $11.1B and APAC $9.4B, with "6.5% CAGR 2022 - 2028" below the map. Our calculation: the regions add to $64.6B, which rounds to $65B. The slide does not say which year the $65B describes. If it is 2022, the market would be about $94.8B by 2028 at 6.5%; if it is 2028, it was about $44.5B in 2022 (our calculations). The difference is more than $30B either way, and the slide gives no source.
Cake's page 10 has "$108B market opportunity" and "$33B expansion 2019 - 2027" beside "Growing at a CAGR of 4.62% from 2019-2027" and "$33 Billion incremental revenue opportunity to be capitalized on in the next 8 years". Our calculation: at 4.62% a year for eight years, a market grows by about 43.5%. If $108B were the 2019 value, the increase would be about $47B; if $108B is the 2027 value, the 2019 value is about $75.2B and the increase about $32.8B, which matches the $33B. So the $108B is a 2027 forecast, not today's market, and the slide does not say so. It gives no source.
Celsius's page 5, "The Evolution of Energy Drinks", says "Energy drink sales will Grow 85% between 2016-2025 for a total of 84.8 Billion USD" and "Global functional drink market is expected to Grow By 156.0 Billion USD during 2019-2023, progressing at a CAGR of almost 11% during the period (Technavio Research)". The first claim can be read two ways: 85% growth to $84.8B, or growth totalling $84.8B. If it is the first, the implied yearly rate is about 7.1% (our calculation). The second claim gives an increase and a rate but no start value. If the 11% runs for the four years from 2019 to 2023, a $156B increase implies a market of about $301B growing to about $457B (our calculation, assuming four compounding years). The slide does not say, and Technavio's own figures are not shown.
When the growth rate belongs to a different market
Careerist's page 11, "Market", shows a TAM of "50M+ people each year change jobs in the U.S. = $100B+ market" and a SAM of "3M+ jun & mid-level pros that change jobs in U.S. tech = $10B+ market". Below them it says "E-Learning Market surpassed $315B (with $120B in North America) in 2021 and is projected to have 20% CAGR to become a trillion-dollar market by the end of 2020s". Our calculation: $315B growing 20% a year passes $1 trillion in 2028, so the e-learning sentence is internally consistent. But the growth rate is for all of e-learning, a market more than three times the size of Careerist's own TAM, and the slide gives no growth rate for the job-change market it actually addresses.
Amplitude's page 24, "Market Size Overview (Top Down)", has a similar gap. It says "BI & analytics market size $14.4B in 2013 (Gartner)" and "Mobile business intelligence & analytics market projected to grow at more than 20% CAGR; projected more than $2 billion market by 2015 (Gartner, Redwood Capital)". The chart above plots year-on-year growth percentages for cloud, mobile and social BI from 2014 to 2018, not market size. The $14.4B is the whole BI market, the growth rate and $2 billion are for the mobile segment, and the chart shows a third measure. Each number may be right; together they do not tell the reader how big Amplitude's market is or how fast it is growing. This is an early Amplitude deck, from before the company went public.
The practical rule: quote the growth rate of the narrowest market you can source that still contains your customers. If you can only source growth for a broader market, say so and explain why your segment should grow at least as fast.
How to build the growth line on your market slide
Start from the source report, not from a secondary article. Write down the report's start value and year, end value and year, and stated CAGR, exactly as published. Recalculate the CAGR from the endpoints. If your result differs from the report's by more than rounding, check whether the report uses a different base year from the one it headlines; this is a common cause.
On the slide, show the start value with its year, the end value with its year, the CAGR, and the source name and publication year. Round the CAGR to a whole number unless the endpoints are precise enough to support a decimal. If you show a chart, plot only years the source reports and make sure the chart, the text and the stated rate describe the same path.
Mark forecasts as forecasts. A market figure for a future year is a prediction by a research firm, not a size. If your headline number is a forecast, as Cake's $108B is, say so next to it. If it is several years old, as Breathe Easy's $12.4B is, give the year in the same line.
Finally, connect the growth rate to your addressable market. State whether the CAGR applies to your TAM, your SAM or a broader category, and if it is broader, give one reason your segment grows at a similar rate. A slower growth rate for the right market is more useful to an investor than a faster one for the wrong market.
Common mistakes
A rate that doesn't match the endpoints. Recalculate before the slide goes out.
No base year. Give the year for both the start and end values.
Forecast shown as today's size. Label future-year values as forecasts.
False precision. Round the rate to match the precision of the inputs.
Chart and text disagree. Draw the chart from the same figures the text quotes.
Borrowed growth. Use your own market's rate, or say the rate is for a broader category.
Diagnostic checklist
Start value and year are given.
End value and year are given and marked as a forecast.
The stated CAGR matches the endpoints within rounding.
The rate is rounded to the precision of the inputs.
The chart, text and rate describe the same path.
The source and publication year are named.
The slide says whether the rate applies to the TAM, the SAM or a broader market.
Frequently asked questions
How do I calculate CAGR?
Divide the end value by the start value, raise the result to the power of 1 divided by the number of years, and subtract 1. For $50B to $215B over five years: 4.3 to the power of 0.2 is about 1.339, so about 33.9% a year.
What if my recalculation differs slightly from the report?
Check whether rounding explains it. BioSculpture's 9.6% looks low against its rounded endpoints, but the unrounded values could give anything from about 9.1% to 11.2%.
Is a low market growth rate bad for my pitch?
Not necessarily. Breathe Easy shows a 1.5% rate plainly. A large stable market can still support a company that takes share; say that is the case you are making.
Should I show a chart or just the numbers?
A chart helps if it shows real yearly figures from the source. Cerebrium's chart reveals a jump in the first year that the CAGR hides; AGV Protocol's chart contradicts its own text.
Can I use a broader market's growth rate?
Only if you say it is broader and explain why your segment should grow similarly. Careerist quotes e-learning growth next to a job-change TAM without that link.
How we chose these examples
Search (2026-09-30): the durable corpus index (docs/seo/artifacts/corpus-search, 70,729 unique pages, deduplicated by deck-file sha256 + page) was searched for "CAGR" and "compound annual" near two years; 108 pages matched after removing mining, banking and oil company decks.
Fifteen candidate pages were rendered from the original public deck files and read from the images; fourteen are used: Cerebrium 18, AGV Protocol 6, Call The 5, Boxcryptor 3, Apheros 6, Breathe Easy 8, AI Beauty Bot 10, Dartrays 5, BioSculpture 19, Creative Fabrica 8, Cake 10, Celsius 5, Careerist 11 and Amplitude 24.
Left out: Apricity 4 (original deck file unavailable), Arkive 10 (the same e-learning sentence as Careerist), public-company revenue and EBITDA CAGRs (Alteryx, CPI Card Group, Cedar Fair, Daseke, Atento), SPAC comparable tables (BuzzFeed, Circle), company revenue CAGRs rather than market growth (Canndescent, Cematrix, Cancer Genetics), and charts where the start and end values cannot be read from the image.
All calculations are ours and labelled; we allow for rounding of the slide's endpoints before calling a rate inconsistent. Market forecasts are the research firms' predictions as quoted on the slides; we did not check the underlying reports. How we built this: drafted and checked with AI assistance (editorial model review against the original slide images); no human editor has reviewed this guide.