Break-Even Point on a Pitch Deck: Does the Volume Add Up?
How founders show a break-even volume on a pitch deck (units, customers or users needed to cover costs) and how to check it against the slide's own price.
How to Show a Break-Even Volume on Your Pitch Deck That Investors Can Check
Twelve slides from real pitch decks that state how many units, customers or users a company needs to break even. For each, we try to reproduce the number from the figures on the same slide, note which input is missing, and say what kind of break-even the slide actually means.
TL;DR
A break-even volume is the number of units, customers or users at which the money a company makes on each one covers its fixed costs. It is reproducible only when three things appear together: the price or revenue per unit, the variable cost or margin per unit, and the fixed costs the volume has to cover. Divide fixed costs by the margin per unit and you get the break-even volume. With all three on the slide, an investor can check it in seconds; with one missing, the number has to be taken on trust.
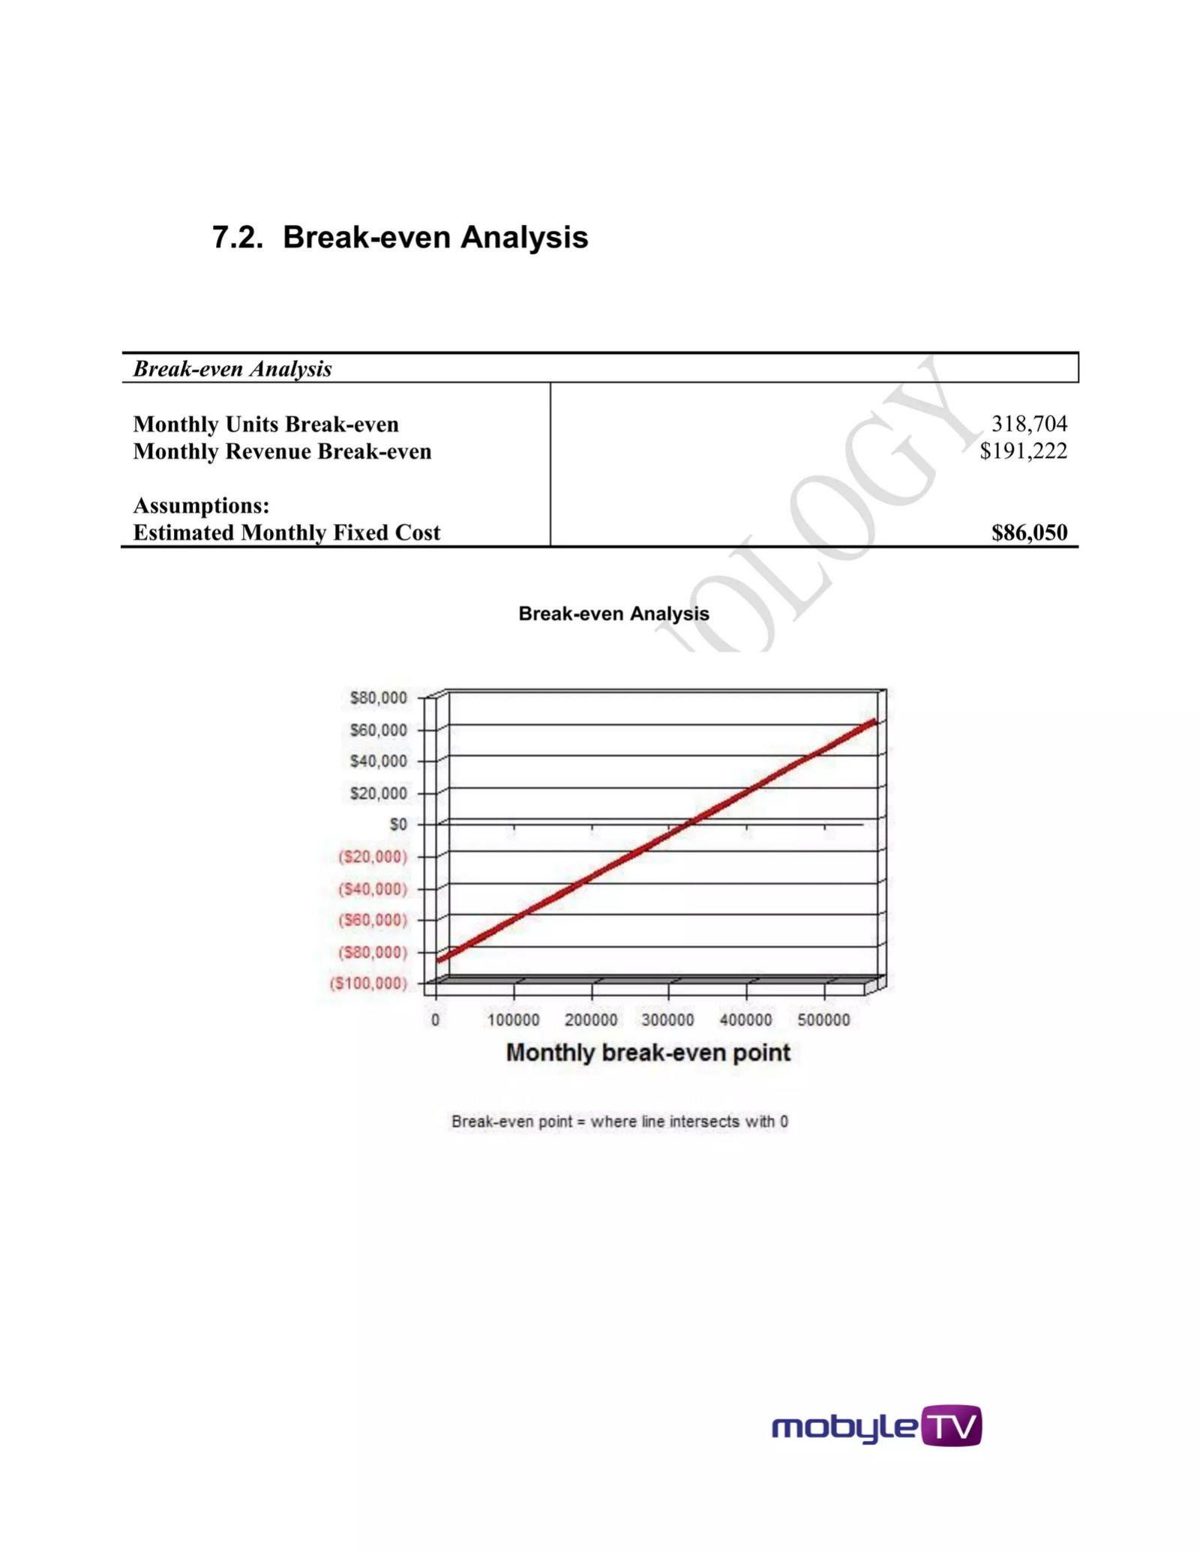
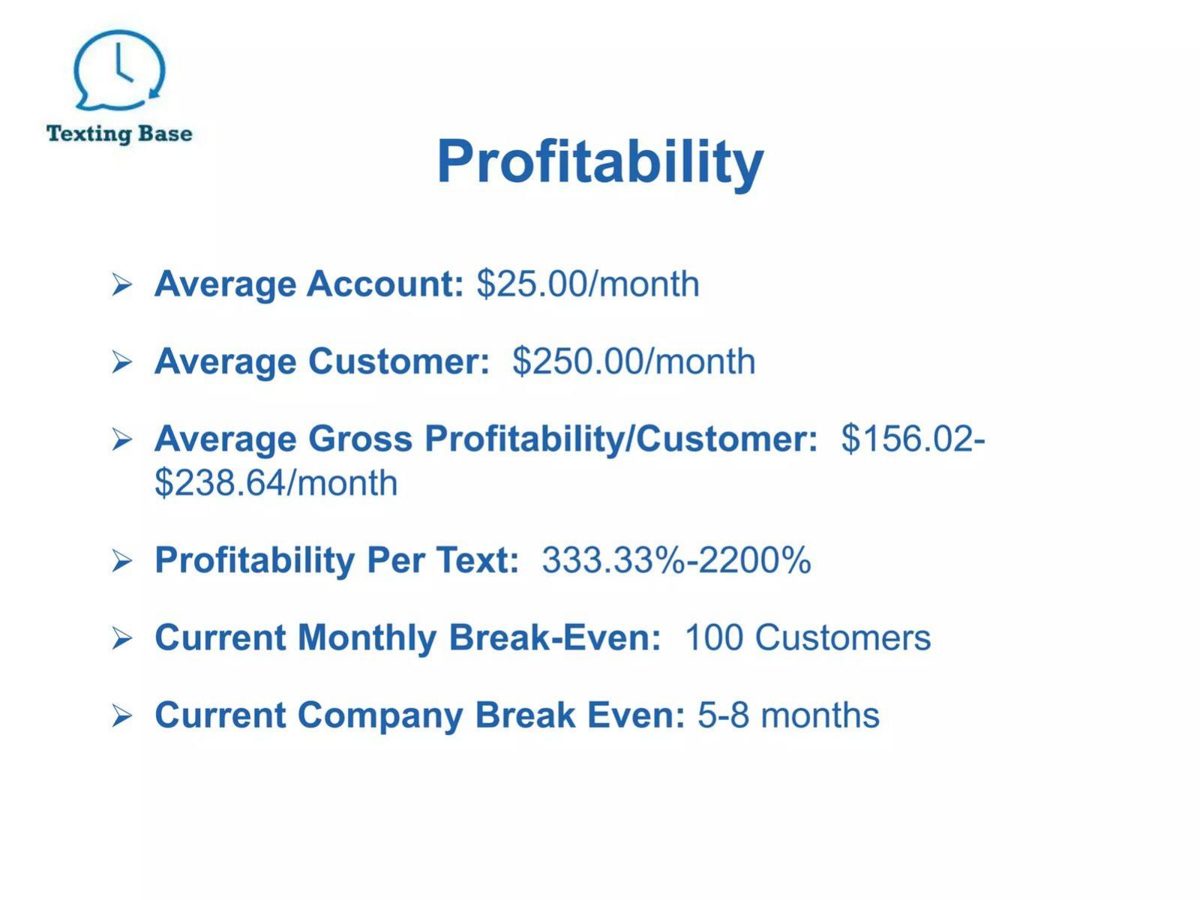
Only one slide in this set shows all three. MobyleTV's break-even table gives 318,704 monthly units, $191,222 monthly revenue and $86,050 monthly fixed costs; together they imply a price of about $0.60 and a margin of about $0.27 a unit, and the figures reconcile exactly (our calculation). Most others give the margin but not the fixed costs (Be Visible, Texting Base), the costs but not the price (DirectDairy), or only a count (Hatch). Brain Backups' footnote reveals that its ~1,200 tests are the volume needed to earn back a $2.5M Series A, not to cover running costs. Tomato Sherpa's own chart labels do not add up to the operating profit it shows at its break-even month.
Break-even slides from real pitch decks
Each example records what the slide states, whether we could reproduce its break-even from its own figures, and what to copy or avoid. "Our calculation" marks arithmetic we did; the slides do not show it.
MobyleTV unit economics slide — slide 42
Mobile TV service in Malaysia. "Break-even Analysis" page of an investment proposal.
MobyleTV deck, slide 42. Exact stored slide matched to this analysis.
Our analysis: A fully reproducible break-even volume.
Evidence and limitation: Our calculation: about $0.60 revenue and $0.27 margin per unit; 45.0% of revenue left after variable costs; 318,704 × $0.27 is $86,050. The chart starts near minus $86,000.
What a founder can adapt: Show all three, and add what the unit is and how many units you have today.
Supporting analysis
What the deck claims: "Monthly Units Break-even 318,704"; "Monthly Revenue Break-even $191,222"; "Estimated Monthly Fixed Cost $86,050"; chart note "Break-even point = where line intersects with 0".
Presentation choice: Volume, revenue at that volume and fixed costs appear together, so every number can be checked against the others.
When it does not fit: Don't stop at the arithmetic; name the unit and where the price assumption comes from.
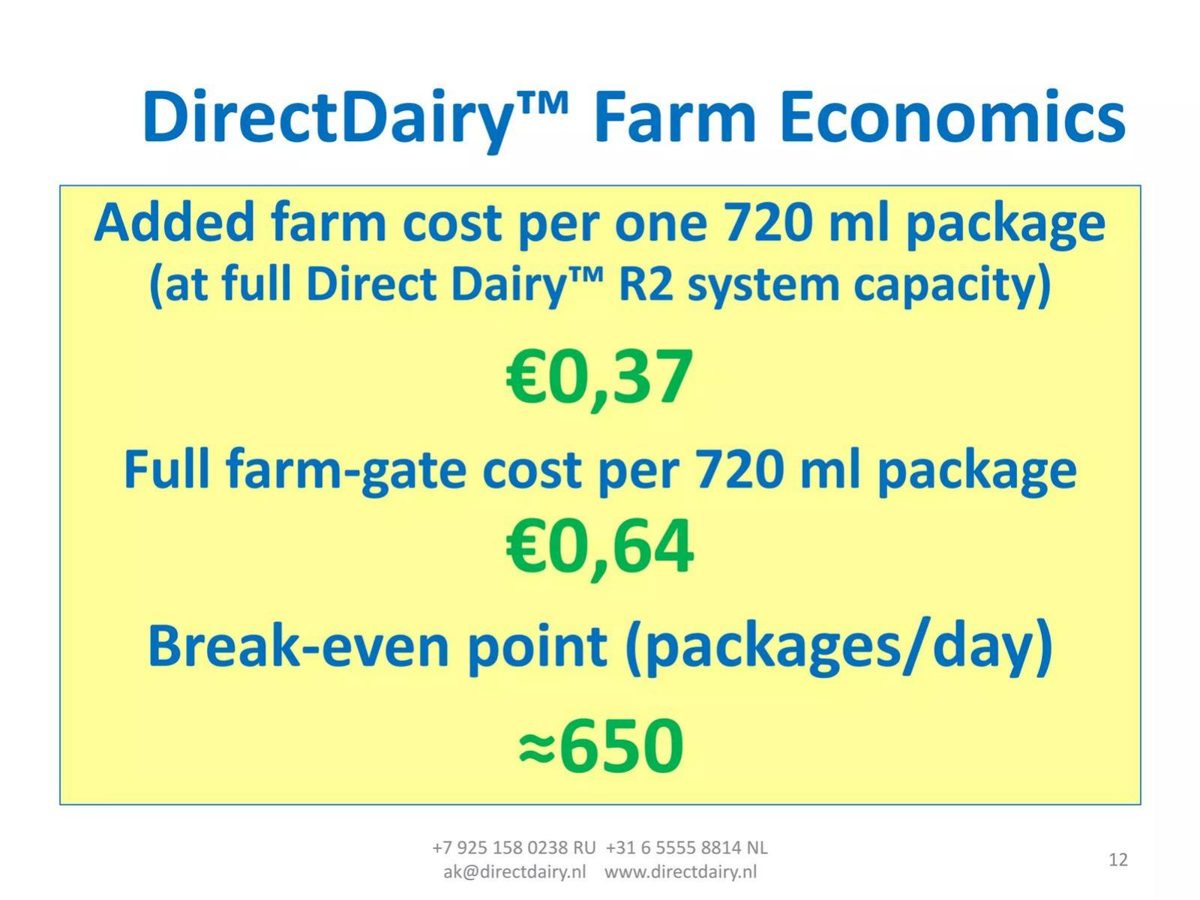
DirectDairy deck, slide 12. Exact stored slide matched to this analysis.
Our analysis: A cost-side break-even with the revenue side missing.
Evidence and limitation: No selling price or daily fixed cost is given, so 650 cannot be reproduced. Costs are quoted at full capacity; break-even happens below it.
What a founder can adapt: Add the price per package and the system's daily fixed cost.
Supporting analysis
What the deck claims: "Added farm cost per one 720 ml package (at full Direct Dairy R2 system capacity) €0,37"; "Full farm-gate cost per 720 ml package €0,64"; "Break-even point (packages/day) ≈650".
Presentation choice: It gives the break-even in the customer's own unit (packages a day).
When it does not fit: Don't quote unit cost at full capacity next to a break-even that happens below it.
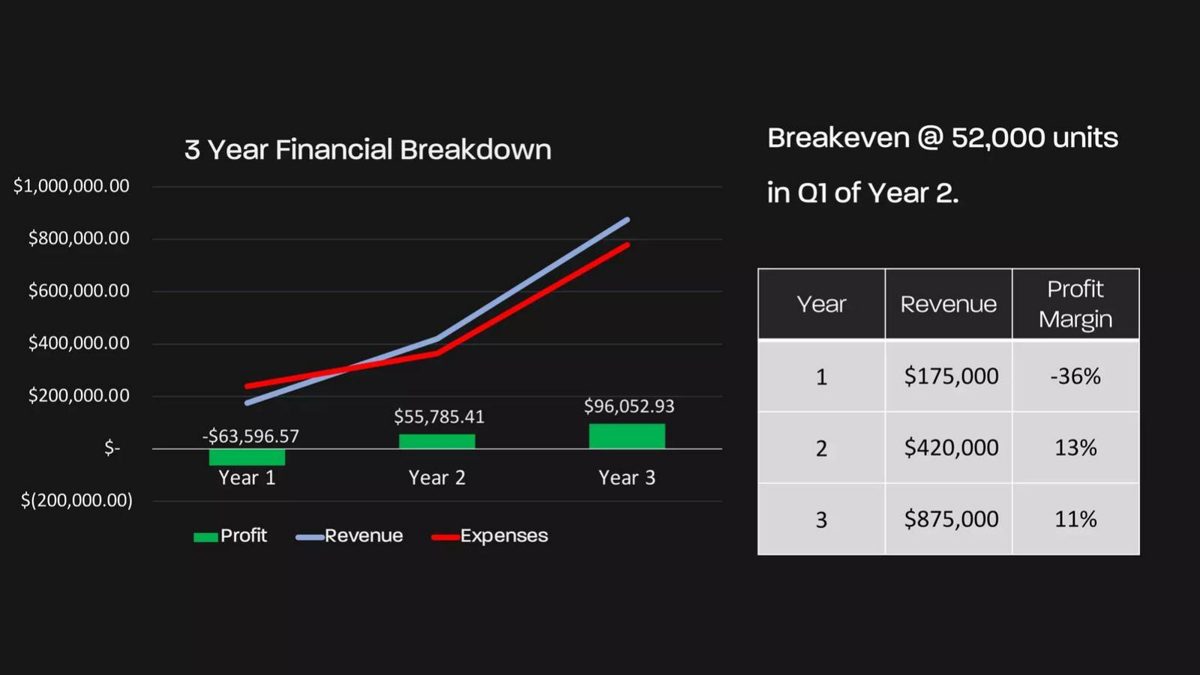
Evidence and limitation: Our calculation: margins match the profit labels (−36.3%, 13.3%, 11.0%). No unit price, so 52,000 cannot be checked; cumulative or quarterly not stated.
What a founder can adapt: Give the price per unit and say whether the unit count is cumulative.
Supporting analysis
What the deck claims: "Breakeven @ 52,000 units in Q1 of Year 2"; revenue $175,000, $420,000, $875,000; margin −36%, 13%, 11%; profit −$63,596.57, $55,785.41, $96,052.93.
Presentation choice: The margins and profit labels agree with each other.
When it does not fit: Don't show cents on a three-year forecast, or let margin fall as revenue doubles without a reason.
Fastbox deck, slide 11. Exact stored slide matched to this analysis.
Our analysis: Cash to break-even, not a volume; timing not shown monthly.
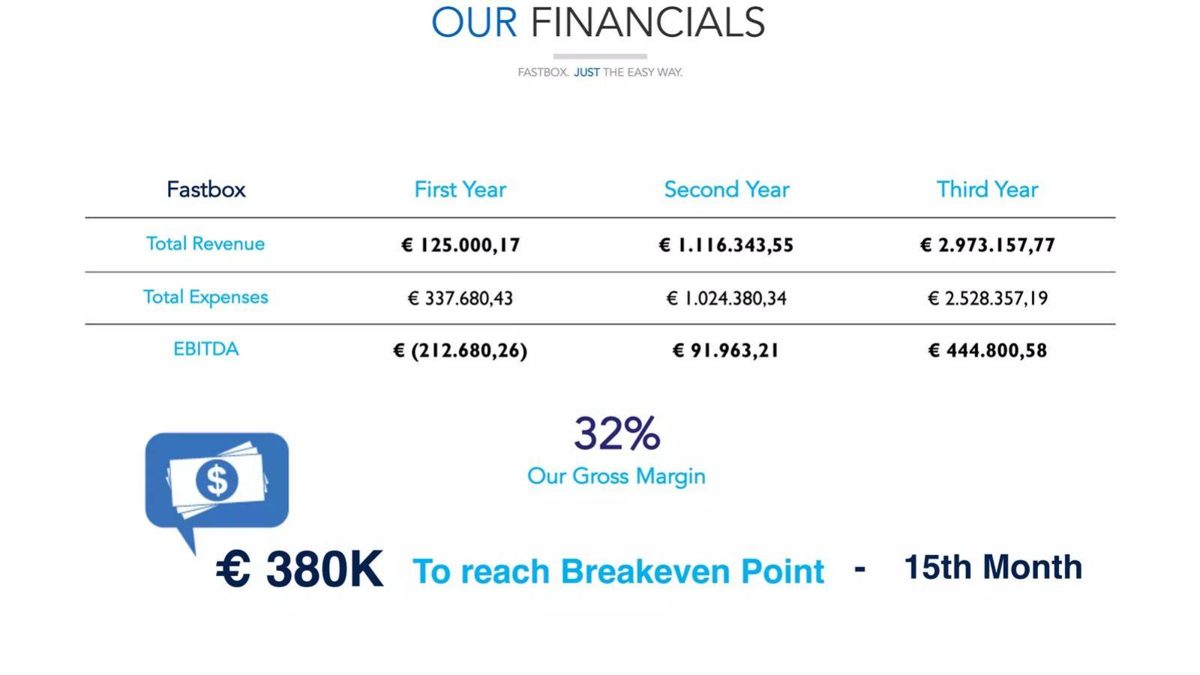
Evidence and limitation: Our checks: EBITDA equals revenue minus expenses in all three years. Reaching €380K implies about €167,000 of losses in months 13-15 while Year 2 makes €91,963.
What a founder can adapt: Show the monthly path to month 15 and the volume at break-even.
Supporting analysis
What the deck claims: Revenue, expenses and EBITDA for three years; "32%" gross margin; "€ 380K To reach Breakeven Point - 15th Month".
Presentation choice: The table's arithmetic is exact and the cash need is stated.
When it does not fit: Don't quote a forecast to the cent.
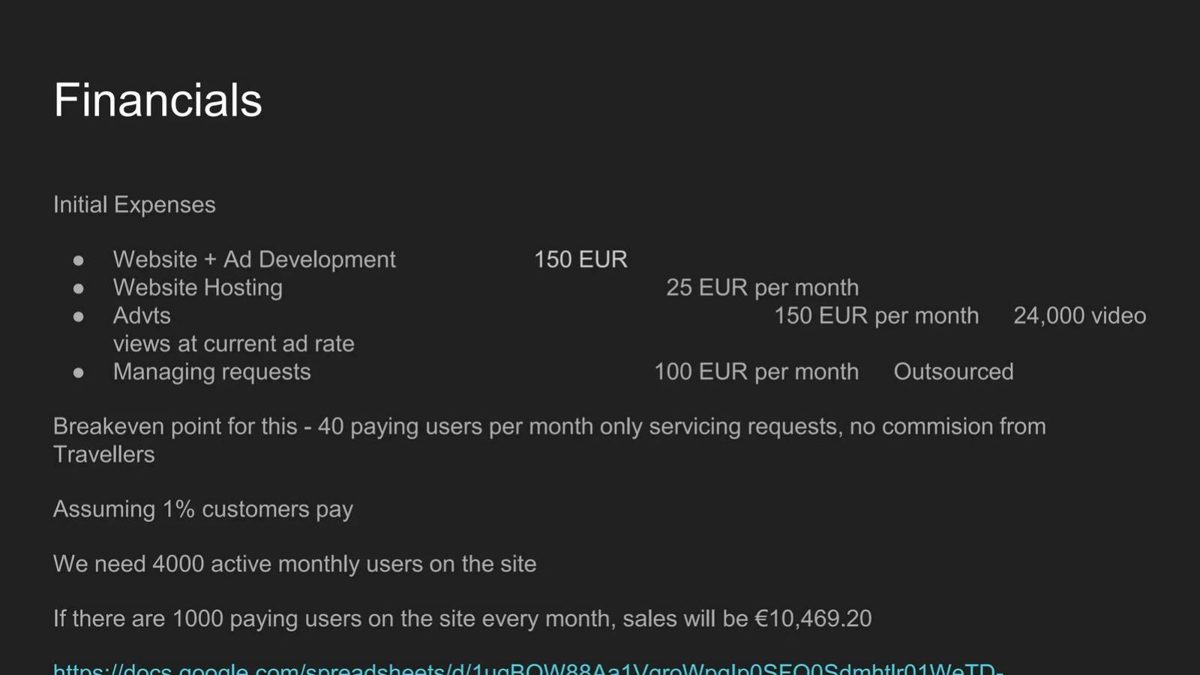
The 3 Travellers deck, slide 16. Exact stored slide matched to this analysis.
Our analysis: Costs itemised; revenue per user not stated, so the two figures disagree.
Evidence and limitation: Our calculation: €275 a month of costs; 40 users implies about €6.88 each; the 1,000-user line implies €10.47 each, at which about 26 users would cover €275.
What a founder can adapt: State the revenue per paying user used for break-even.
Supporting analysis
What the deck claims: Costs: 150 EUR one-off, 25, 150 and 100 EUR a month; "Breakeven point for this - 40 paying users per month"; "Assuming 1% customers pay"; "We need 4000 active monthly users"; 1,000 paying users gives "€10,469.20".
Presentation choice: Every cost line is listed with its period.
When it does not fit: Don't mix revenue assumptions between lines on the same slide.
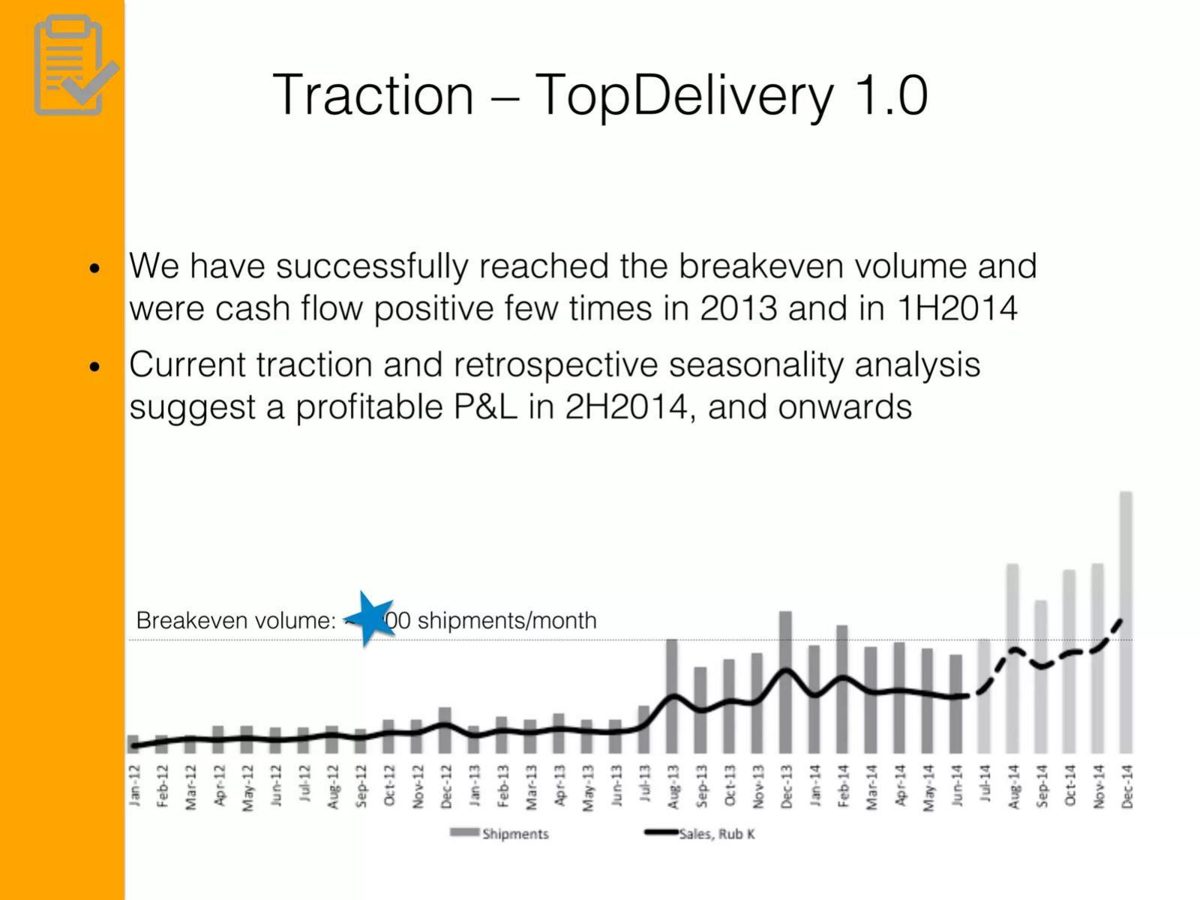
TopDelivery deck, slide 13. Exact stored slide matched to this analysis.
Our analysis: Break-even plotted against measured volume, separated from forecast.
Evidence and limitation: Several measured months from August 2013 onward clear the line. A star graphic covers the first digit of the volume in the copy reviewed.
What a founder can adapt: Plot your break-even line over real monthly volume, and keep the figure legible.
Supporting analysis
What the deck claims: "Breakeven volume: [figure partly covered] shipments/month"; "We have successfully reached the breakeven volume and were cash flow positive few times in 2013 and in 1H2014"; monthly bars Jan 2012 to Dec 2014, dashed forecast from Jul 2014.
Presentation choice: It is the only slide in the set that shows real volume against the break-even line.
When it does not fit: Don't cover the key number with decoration.
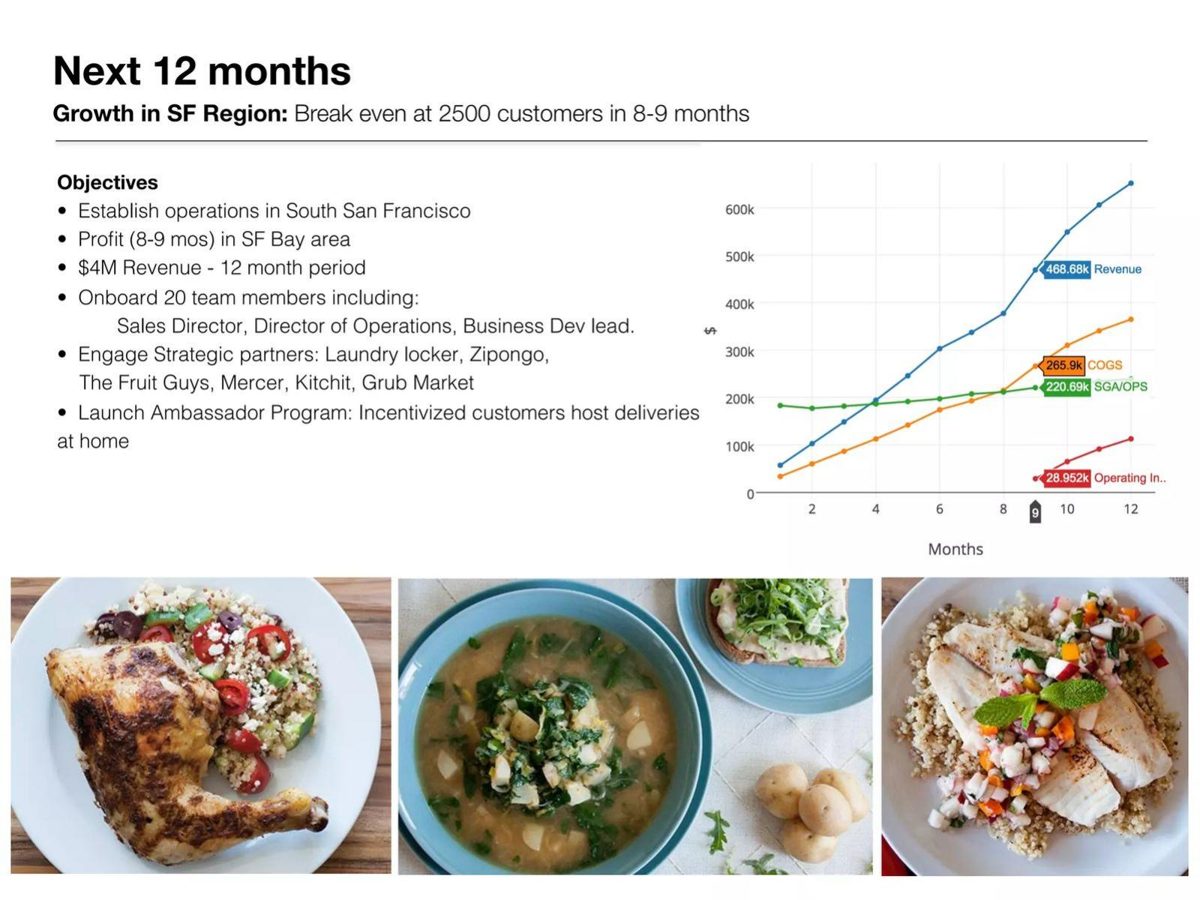
Tomato Sherpa deck, slide 9. Exact stored slide matched to this analysis.
Our analysis: Chart labels that do not reconcile at the break-even month.
Evidence and limitation: Our calculation: $468.68K − $265.9K − $220.69K is about −$17.9K, not $28.952K. About $187 revenue per customer per month at 2,500 customers.
What a founder can adapt: Make revenue minus costs equal the profit label, and state revenue per customer.
Supporting analysis
What the deck claims: "Break even at 2500 customers in 8-9 months"; month-9 labels "468.68k Revenue", "265.9k COGS", "220.69k SGA/OPS", "28.952k Operating In.".
Presentation choice: It gives a customer count and a full cost breakdown to check it against.
When it does not fit: Don't label a profit your own chart figures don't produce.
The first three columns report what each slide states. The last two record which input is missing and our verdict.
Example
Stated break-even
Basis given
Missing input
Verdict
MobyleTV
318,704 units/month
Revenue and fixed costs
None (unit not named)
Reproduces exactly
Be Visible
5,600 glasses
Margin per unit
Fixed costs
Implies $56,000
Texting Base
100 customers/month
Gross profit per customer
Fixed costs
Implies $15.6K-$23.9K/month
Brandvertisor
80 paying users/month
Revenue per user
Costs; unit definition
Ambiguous; LTV inconsistent
DirectDairy
About 650 packages/day
Cost per package
Price; fixed costs
Cannot check
Hatch
195,868 people
None
Price, margin, costs
Cannot check
Blossom Protein
52,000 units
Revenue and margin by year
Price per unit
Totals consistent; volume unchecked
Brain Backups
About 1,200 tests
Margin and $2.5M raise
None
Reproduces; it is a payback
Fastbox
€380K, month 15
Annual P&L
Monthly path; volume
Cash need, not volume
The 3 Travellers
40 paying users/month
Itemised costs
Revenue per user
Inconsistent with 1,000-user line
TopDelivery
Figure partly covered
Measured monthly volume
Legible figure
Measured, not forecast
Tomato Sherpa
2,500 customers
Revenue and costs at month 9
None
Labels do not reconcile
Key Takeaways
Show price, margin per unit and fixed costs beside the break-even volume. MobyleTV does, and its three numbers reconcile exactly (our calculation).
Say what the volume has to cover. Brain Backups' ~1,200 tests earn back a $2.5M Series A at scale cost; that is a payback target, not an operating break-even.
State the fixed costs. Be Visible's 5,600 glasses at $10 profit implies $56,000 of costs the slide never names (our calculation).
Make chart labels add up. Tomato Sherpa's month-9 labels give an operating loss of about $17.9K, not the $28.952K profit shown (our calculation).
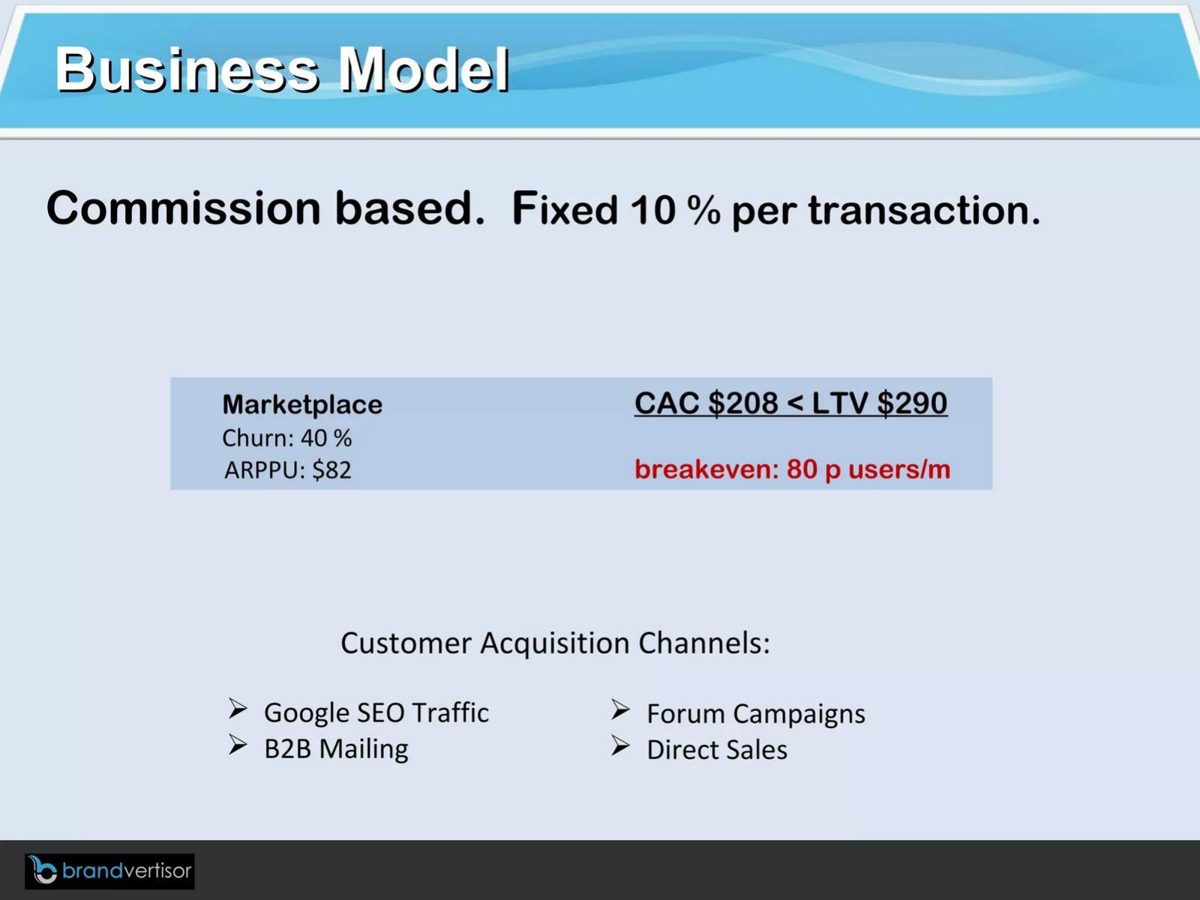
Define the unit. Brandvertisor's 80 paying users a month could mean active users or new users each month; the slide does not say.
Mark measured versus forecast. TopDelivery draws its break-even line across real monthly shipments and a dashed forecast, so investors can see which months cleared it.
Build and check your break-even line
Fill this in from your model. If a field is uncertain, give a range and say why.
Unit. What exactly is counted (a sale, an active paying customer, a new customer each month)?
Price. Revenue per unit, net of discounts and platform fees?
Variable cost. Cost to make and deliver one more unit, including payment fees, shipping and support?
Fixed costs. Monthly costs that do not change with volume, and what they include?
Break-even volume. Fixed costs ÷ (price − variable cost): does it match what you show?
Today. Current volume and recent monthly growth?
Basis. Does the volume cover running costs, company overheads or money raised?
Copyable framework: Break-even at [volume] [units] a [period]: [fixed costs] a [period] ÷ [margin] per unit ([price] − [variable cost]). Today: [current volume], growing [rate] a month. Covers [running costs / all overheads / the round].
Illustrative example 1 — written by us
Before: Break Even Point: 5,600 glasses.
After: Break-even at 5,600 glasses: $56,000 of first-year fixed costs ÷ $10 profit per pair ($40 − $20 landing − $10 donation). Sold to date: [number].
What improved: Uses Be Visible's own figures and names the fixed costs the slide implies, so the count can be checked and compared with sales.
What a break-even volume tells an investor, and what it does not
A break-even volume answers one question: how big does this business have to get before it stops losing money each month? That is a different question from when it gets there (a date on a forecast) and from how much cash is burned on the way (the low point of cumulative cash). Our financials guide covers the date and the cash low point. This guide covers the volume itself: the count of units, customers or users that the business model says will cover its costs.
The volume is useful because it turns a forecast into something testable. "Break-even in month 15" depends on a growth assumption nobody can check yet. "Break-even at 2,500 customers" can be compared with the number of customers today, with the rate the company is adding them, and with the size of the market. An investor who sees a break-even of 5,600 units can ask how many units sold last quarter and do the rest of the arithmetic.
It only works if the number is reproducible. The formula is simple: fixed costs divided by the margin each unit contributes (price minus the variable cost of making and delivering it). If a slide gives a break-even volume but hides one of the three inputs, the number cannot be checked, and a small change in any input moves it a lot. Halve the margin per unit and the break-even volume doubles.
A break-even volume also depends on which costs are counted. A factory's break-even covers its own running costs; a company's break-even covers head office, salaries and marketing too; a payback target covers money already raised. Several slides in this set use the word for one while meaning another. None of them is wrong to show; the problem is not saying which.
The one slide that shows every input
MobyleTV's page 42, "7.2. Break-even Analysis", comes from an investment proposal for a Malaysian mobile TV service. Its table gives "Monthly Units Break-even 318,704", "Monthly Revenue Break-even $191,222" and, under "Assumptions", "Estimated Monthly Fixed Cost $86,050". A line chart below plots monthly profit from about minus $86,000 at zero units, crossing zero a little above 300,000, with the note "Break-even point = where line intersects with 0".
Our calculation: $191,222 ÷ 318,704 units is about $0.60 per unit. $86,050 ÷ 318,704 is about $0.27 of margin per unit. That means about 45% of each dollar of revenue is left after variable costs ($86,050 ÷ $191,222 = 45.0%). Multiplying back, 318,704 units × $0.27 is $86,050. Every number on the slide agrees with every other, and the chart starts where the fixed costs say it should.
What the slide does not say is just as useful. It does not name the unit (a subscription, a view, a transaction), it does not show where the $0.60 price or the 55% variable cost come from, and it does not say how many units the service has today. A reader can check the arithmetic but not the assumptions. That is still far more than most slides allow, and it shows the minimum a break-even slide needs: the volume, the revenue at that volume, and the fixed cost it covers.
Slides that give the margin but not the costs
Be Visible's page 7, "Finances", is a model of clarity on unit economics: "Selling Price: $40", "Landing Cost: $20", "Profits: $20", "Donation: $10", "Be Visible Profit: $10" and "Break Even Point: 5,600 glasses". Our calculation: 5,600 glasses × $10 is $56,000, so the slide implies $56,000 of fixed costs. It never says what they are, over what period they fall, or whether they are one-off (a first production run, a website) or recurring. The per-glass figures also stop at landing cost; marketplace fees, shipping to customers and returns would reduce the $10 and push the volume up. If the $10 donation is treated as a cost the company could cut, the same $56,000 would be covered by 2,800 glasses; the slide's choice to count the donation as a fixed commitment is worth stating in words.
Texting Base's page 17, "Profitability", lists "Average Customer: $250.00/month", "Average Gross Profitability/Customer: $156.02-$238.64/month", "Current Monthly Break-Even: 100 Customers" and "Current Company Break Even: 5-8 months". Our calculation: 100 customers × $156.02 is $15,602 a month and 100 × $238.64 is $23,864, so the slide implies monthly fixed costs somewhere between those two figures. The gross profit per customer ranges from about 62% to 95% of the $250 price, a wide band quoted to the cent. The slide also uses break-even twice: once as a customer count and once as a time (5 to 8 months) without saying whether the time is how long until it reaches 100 customers or how long until earlier losses are recovered.
Brandvertisor's page 11, "Business Model", says "Commission based. Fixed 10 % per transaction" and shows "Churn: 40 %", "ARPPU: $82", "CAC $208 < LTV $290" and "breakeven: 80 p users/m". Our calculation: 80 paying users × $82 is $6,560 a month of revenue at break-even, which implies monthly costs of about that amount. It is unclear whether $82 is Brandvertisor's commission or the value of a user's transactions (at 10% commission, the company would keep $8.20). "80 p users/m" can be read as 80 paying users in a month or 80 new paying users every month; the two give very different businesses. The LTV also does not follow from the other figures: $82 ÷ 40% churn is $205, not $290, if both are monthly (our calculation).
Slides that give the costs but not the price, or only a count
DirectDairy's page 12, "DirectDairy Farm Economics", gives "Added farm cost per one 720 ml package (at full Direct Dairy R2 system capacity) €0,37", "Full farm-gate cost per 720 ml package €0,64" and "Break-even point (packages/day) ≈650". The cost per package is stated precisely, but without a selling price or the farm's fixed costs the 650 cannot be reproduced. The cost is also measured "at full system capacity", while break-even by definition happens below full capacity, where the cost per package is higher. A farmer reading this slide would want the price per package and the daily fixed cost of the system.
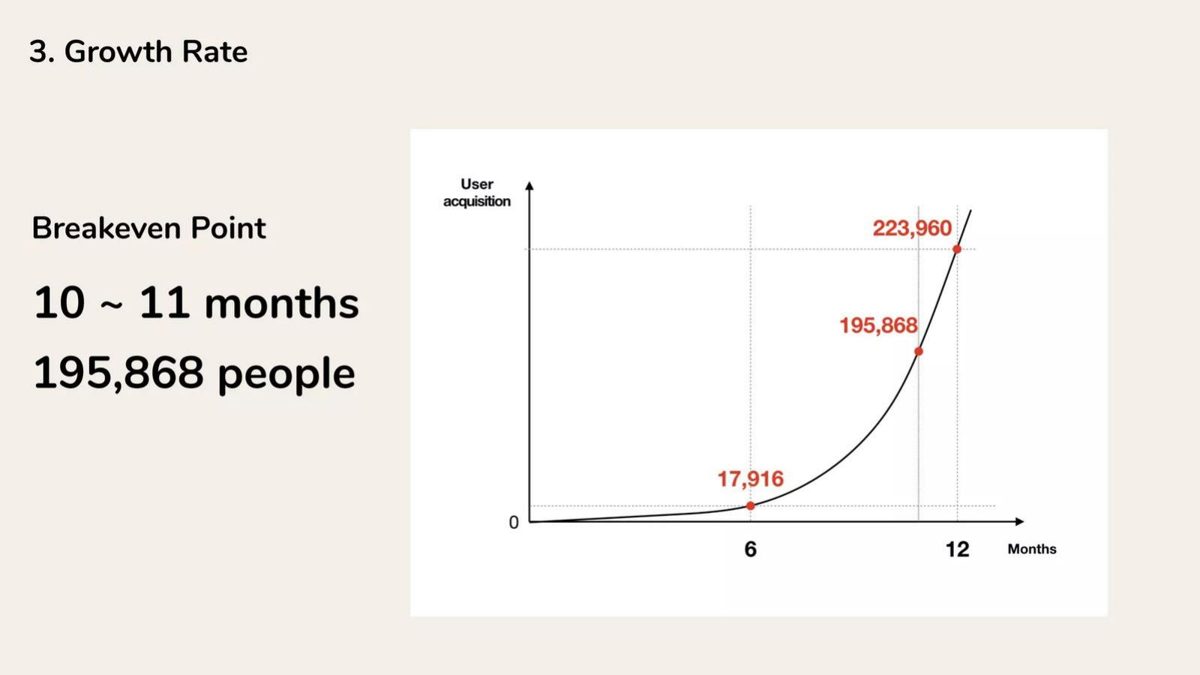
Hatch's page 45, "3. Growth Rate", states "Breakeven Point 10 ~ 11 months 195,868 people" beside a user-acquisition curve marked 17,916 at month 6, 195,868 near month 11 and 223,960 at month 12. The count is given to the last person, but the slide shows no revenue per user and no costs, so there is no way to test why the business breaks even at that number. Our calculation: the curve implies users growing about 12.5 times between month 6 and month 12. Six-figure precision on a forecast signals a model output, not an estimate; rounding to about 200,000 and showing the revenue per user would be more honest and more useful.
Blossom Protein's page 11, "3 Year Financial Breakdown", says "Breakeven @ 52,000 units in Q1 of Year 2" beside a table of revenue ($175,000, $420,000, $875,000) and profit margin (−36%, 13%, 11%) and a chart labelling profit at −$63,596.57, $55,785.41 and $96,052.93. The margins check against the labels: −$63,596.57 ÷ $175,000 is −36.3%, $55,785.41 ÷ $420,000 is 13.3%, and $96,052.93 ÷ $875,000 is 11.0% (our calculations). The 52,000 units cannot be checked, because the slide gives no price per unit and does not say whether 52,000 is a cumulative or a quarterly count. The margin also falls from Year 2 to Year 3 while revenue doubles, which runs against the usual expectation that fixed costs are spread over more units; the slide does not explain why.
When break-even means something else
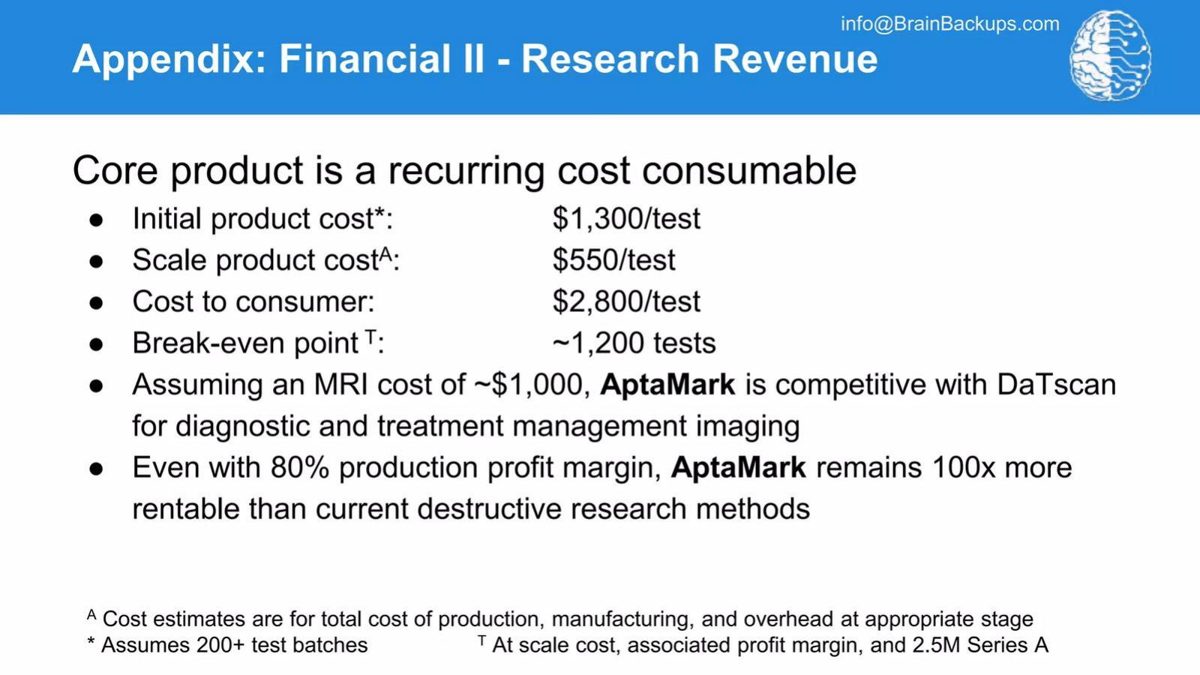
Brain Backups' page 13, "Appendix: Financial II - Research Revenue", lists "Initial product cost: $1,300/test", "Scale product cost: $550/test", "Cost to consumer: $2,800/test" and "Break-even point: ~1,200 tests". A footnote explains the break-even is "At scale cost, associated profit margin, and 2.5M Series A". Our calculation: $2,800 − $550 is $2,250 of margin per test at scale; $2.5M ÷ $2,250 is about 1,111 tests, which rounds up to the ~1,200 on the slide. So the number is the volume needed to earn back the Series A, not to cover monthly running costs. At the initial cost of $1,300 per test, the margin is $1,500 and the same $2.5M takes about 1,667 tests. The footnote is the most honest line on the slide; moving it into the headline would make the claim clearer.
Fastbox's page 11, "Our Financials", gives three years of revenue, expenses and EBITDA, a "32%" gross margin and "€ 380K To reach Breakeven Point - 15th Month". The table's arithmetic is exact: €125,000.17 − €337,680.43 = −€212,680.26 in Year 1, €1,116,343.55 − €1,024,380.34 = €91,963.21 in Year 2, and €2,973,157.77 − €2,528,357.19 = €444,800.58 in Year 3 (our checks). The €380K reads as the cash needed until break-even, not a volume. Our calculation: if Year 1 loses €212,680, then months 13 to 15 would need to lose about €167,000 more to reach €380K, while Year 2 as a whole makes €91,963. That is possible if losses are front-loaded in Year 2, but the slide does not show monthly figures, and forecasts quoted to the cent suggest more certainty than a three-year plan can have.
The 3 Travellers' page 16, "Financials", lists "Website + Ad Development 150 EUR", "Website Hosting 25 EUR per month", "Advts 150 EUR per month" and "Managing requests 100 EUR per month", then "Breakeven point for this - 40 paying users per month only servicing requests, no commision from Travellers", "Assuming 1% customers pay", "We need 4000 active monthly users on the site" and "If there are 1000 paying users on the site every month, sales will be €10,469.20". Our calculation: the recurring costs total €275 a month; 40 users covering €275 implies about €6.88 each. The 1,000-user line implies about €10.47 each, at which €275 would be covered by about 26 users. The two figures may use different revenue per user (requests only versus requests plus commission), but the slide does not give either price. The 1% conversion and 4,000 active users are consistent with each other.
Charts that show break-even against real or forecast volume
TopDelivery's page 13, "Traction – TopDelivery 1.0", draws a dotted "Breakeven volume" line in shipments per month across monthly bars from January 2012 to December 2014, with a line for sales in thousands of roubles. Solid bars run to June 2014; lighter bars and a dashed line after that are forecasts. The text says "We have successfully reached the breakeven volume and were cash flow positive few times in 2013 and in 1H2014". This is the only slide in the set that plots break-even against measured volume, so a reader can see which months cleared it (several from August 2013 onward) and which did not. In the copy we reviewed, a star graphic covers the first digit of the break-even figure, so the exact volume cannot be read.
Tomato Sherpa's page 9, "Next 12 months", says "Growth in SF Region: Break even at 2500 customers in 8-9 months" and plots monthly revenue, cost of goods, SG&A/operations and operating income, with labels at month 9: "468.68k Revenue", "265.9k COGS", "220.69k SGA/OPS" and "28.952k Operating In.". Our calculation: $468.68K − $265.9K − $220.69K is about −$17.9K, an operating loss, not the $28.952K profit labelled. The labels may be taken from slightly different points on the lines, or operating income may include something not charted, but as shown they do not reconcile. Dividing month-9 revenue by 2,500 customers gives about $187 per customer per month, a figure the slide could state directly (our calculation).
How to build a break-even line investors can check
Start from the unit. Name exactly what is counted: a pair of glasses, a paying subscriber in a given month, a package a day. If the count could be read two ways, as Brandvertisor's could, choose the words that allow only one.
Show the three inputs on the same slide as the volume: price or revenue per unit, variable cost or margin per unit, and fixed costs with their period. A single line such as "$86,050 fixed costs a month ÷ $0.27 margin a unit = 318,704 units a month" lets anyone reproduce the number.
Say what the volume covers. Running costs, company overheads, or money already raised are all legitimate targets, but they are different claims. Brain Backups' footnote is a good model: it states the basis. Put that basis in the headline, not the footnote.
Compare the volume with today. Add current volume and its recent growth, so the distance to break-even is visible. TopDelivery's chart does this with real monthly bars. If the company is pre-revenue, say so and give the assumption behind the first units.
Round to the precision of the inputs. Hatch's 195,868 people and Blossom Protein's cents on a three-year forecast are model outputs. "About 200,000 users" is easier to trust.
Check every label. If a chart shows revenue, costs and profit at the break-even month, make sure the first minus the others equals the last. Tomato Sherpa's labels do not; an investor who notices will wonder what else was not checked.
Common mistakes
No fixed costs. Give the total the volume has to cover, and its period.
Ambiguous unit. Say whether the count is active, new or cumulative.
Payback called break-even. Say when the volume earns back money raised rather than covering running costs.
Labels that don't add up. Revenue minus costs must equal the profit shown.
False precision. Round forecast counts and money to the precision of your assumptions.
No comparison with today. Show current volume so the gap is visible.
Diagnostic checklist
The unit is named and can be read only one way.
Price or revenue per unit is shown.
Variable cost or margin per unit is shown.
Fixed costs and their period are shown.
Fixed costs ÷ margin per unit equals the stated volume.
The slide says what the volume covers.
Current volume is shown beside the break-even.
Frequently asked questions
How do I calculate a break-even volume?
Divide fixed costs by the margin each unit contributes (price minus variable cost). MobyleTV's $86,050 a month ÷ about $0.27 a unit gives its 318,704 units a month.
Is break-even volume the same as break-even date?
No. The volume is how big the business must be; the date depends on how fast it grows there. Hatch gives both; only the volume is independent of the growth forecast.
Should break-even include money I've raised?
Only if you say so. Brain Backups' ~1,200 tests cover a $2.5M Series A; that is a payback target. Most investors expect break-even to mean covering running costs.
What if my variable costs change with volume?
Show the margin at the volume where you expect to break even, not at full capacity. DirectDairy's cost is quoted at full capacity, which break-even by definition comes before.
Do I need a chart?
Not necessarily. A chart helps when it shows real volume against the break-even line, as TopDelivery's does. A chart whose labels don't reconcile, like Tomato Sherpa's, hurts more than it helps.
How we chose these examples
Search (2026-09-30): the durable corpus index (docs/seo/artifacts/corpus-search, 70,729 unique pages, deduplicated by deck-file sha256 + page) was searched for "break-even" and "breakeven" near units, users, customers, orders or a per-period rate; 45 pages matched the general phrase and 21 the volume phrase.
Twelve candidate pages were rendered from the original public deck files and read from the images; all twelve are used: MobyleTV 42, Be Visible 7, Texting Base 17, Brandvertisor 11, DirectDairy 12, Hatch 45, Blossom Protein 11, Brain Backups 13, Fastbox 11, The 3 Travellers 16, TopDelivery 13 and Tomato Sherpa 9.
Left out: Desert Haven 25 (a charitable housing foundation's grant-funded project, not a startup pitch; excluded on its indexed text, image not reviewed); Powerz 23 and BizMallUG 34 (already used in the financials guide's break-even section); Microsoft-Nokia 20 (public-company acquisition); airSlate 2 and Funding 11 (break-even mentioned as a past state or goal with no volume); Brandvertisor 15 (a second copy of the same break-even line); break-even dates with no volume (Blue Room, Flexpay, Grindhub, Laicos, LABELit, Knime).
All calculations are ours and labelled; where a slide's inputs are rounded we allow for rounding before calling a figure inconsistent. Forecast volumes are the companies' own projections; we did not check their underlying models. How we built this: drafted and checked with AI assistance (editorial model review against the original slide images); no human editor has reviewed this guide.