Use of Funds on a Pitch Deck: Does the Allocation Add Up
How to show use of funds on a pitch deck so the numbers reconcile: dollar amounts that sum to the raise, percentages that total 100%.
How to Show Use of Funds on a Pitch Deck So the Allocation Can Be Checked
Twelve use-of-funds slides from real pitch decks, checked with arithmetic rather than judged on design. For each, we record whether the slide gives the raise amount, whether the buckets are in dollars or only percentages, whether they add to the raise and to 100%, and whether any bucket is tied to a milestone or a monthly spend.
TL;DR
A use-of-funds slide should let an investor turn every slice back into money and every sum back into the raise. That needs the amount raised, the buckets in dollars (percentages are fine alongside), totals that match, and for the largest buckets a statement of what they buy and by when. The general ask slide guide covers how much to raise and which milestones to name; this guide covers the narrower question of whether the allocation itself holds together.
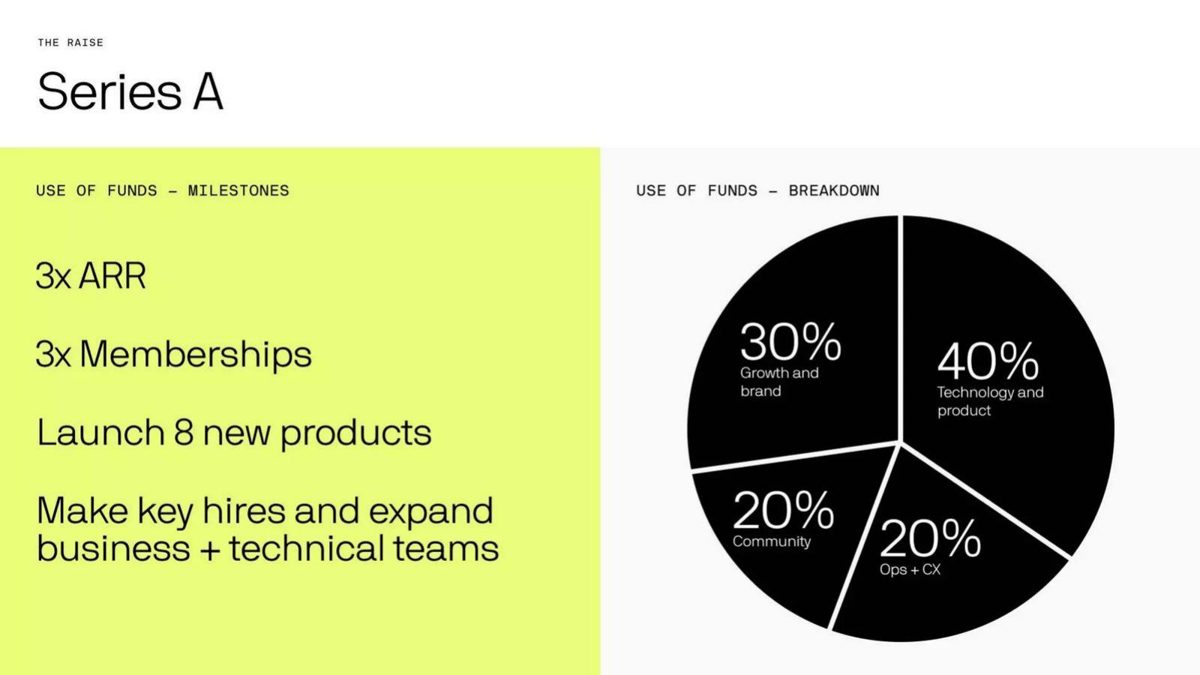
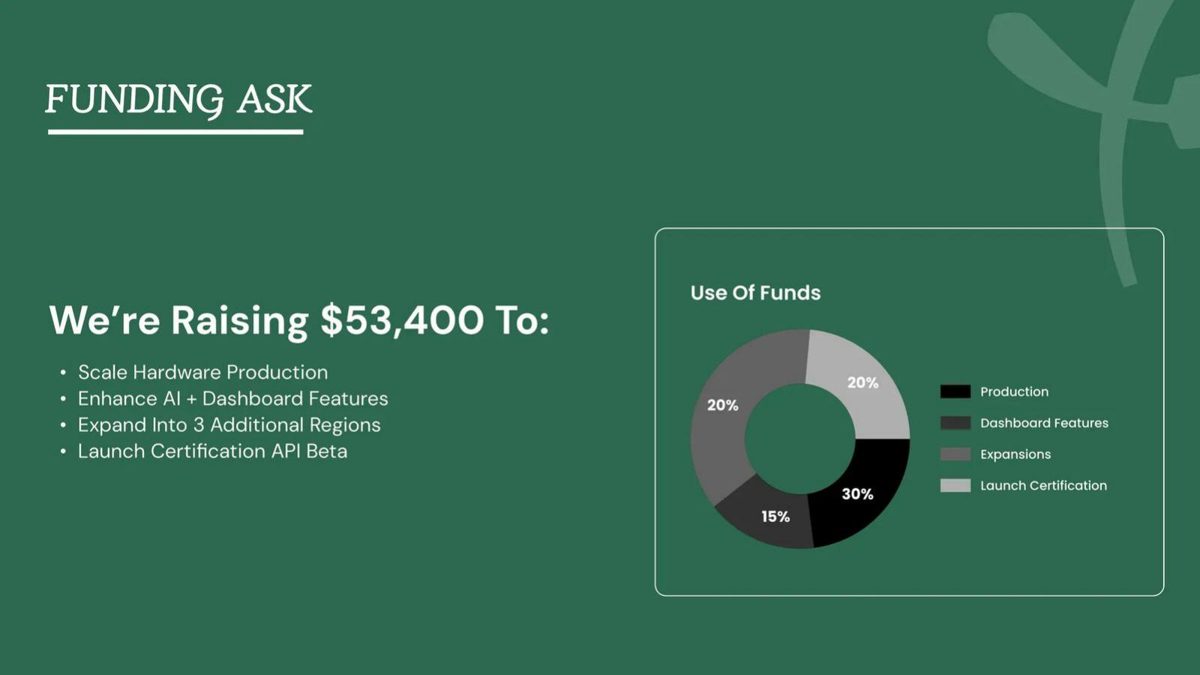
In this set, Dotty's eleven-line table and Axcess Instruments' five amounts reconcile to the raise and to their percentages exactly; Treever's monthly lines add to its $62,500 burn; Carbon Block's cash matches its round within rounding. The problems: MobilFlex asks for $1M and lists $1.25M of uses; Rootine's pie adds to 110%; Pollitrace labels only 85% of its chart; Treever writes $30,000k where it means $30,000; Canix applies one set of percentages to a raise of $1.5M to $2.0M; Rootine, Kiln and Nu-Set give percentages with no amount on the slide.
Use-of-funds slides from real pitch decks
Each example records the exact slide, the allocation it shows, and whether it reconciles to the raise and to 100%. Checks and implied figures are our calculations.
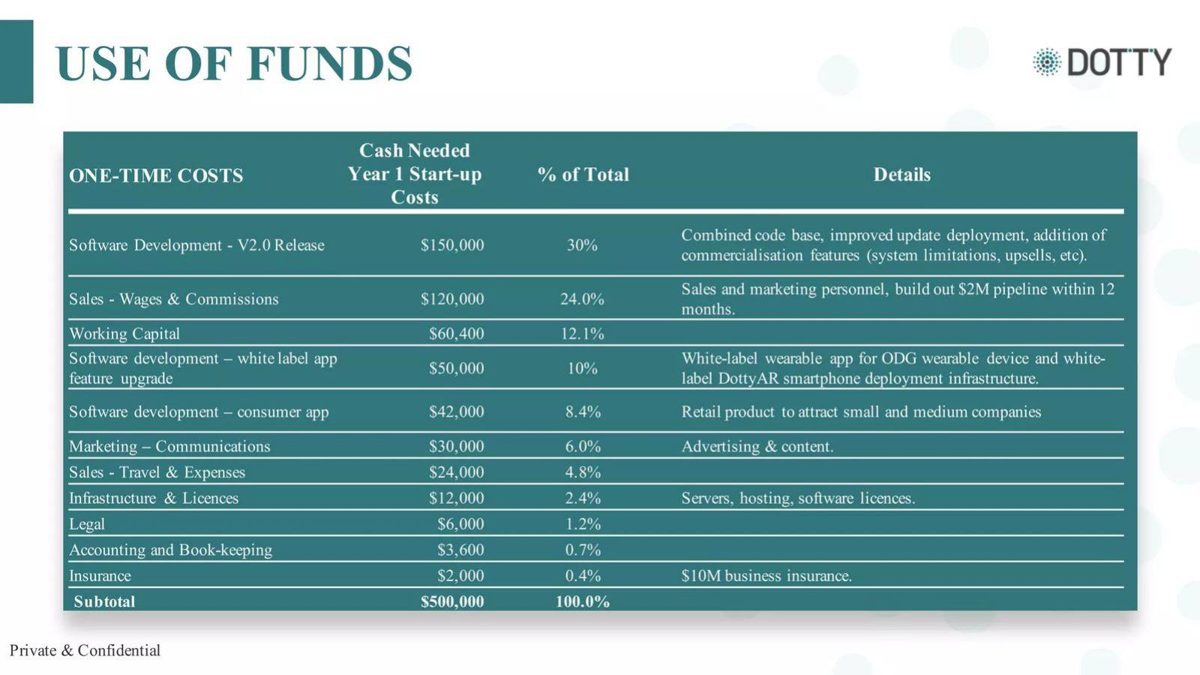
Dotty ask slide — slide 28
AR wearable software. Year-1 start-up budget.
Dotty deck, slide 28. Exact stored slide matched to this analysis.
Our analysis: Fully reconciled, with a detail per line.
Evidence and limitation: Our checks: amounts sum to $500,000 and each share equals amount ÷ $500,000.
What a founder can adapt: Use the table format and cite the basis for pipeline targets.
Supporting analysis
What the deck claims: Eleven one-time cost lines from software development $150,000 (30%) to insurance $2,000 (0.4%); subtotal $500,000 (100.0%); sales line to build a $2M pipeline within 12 months.
Presentation choice: Amount, share and purpose appear on every row.
When it does not fit: Don't pair a small sales budget with a large pipeline claim unexplained.
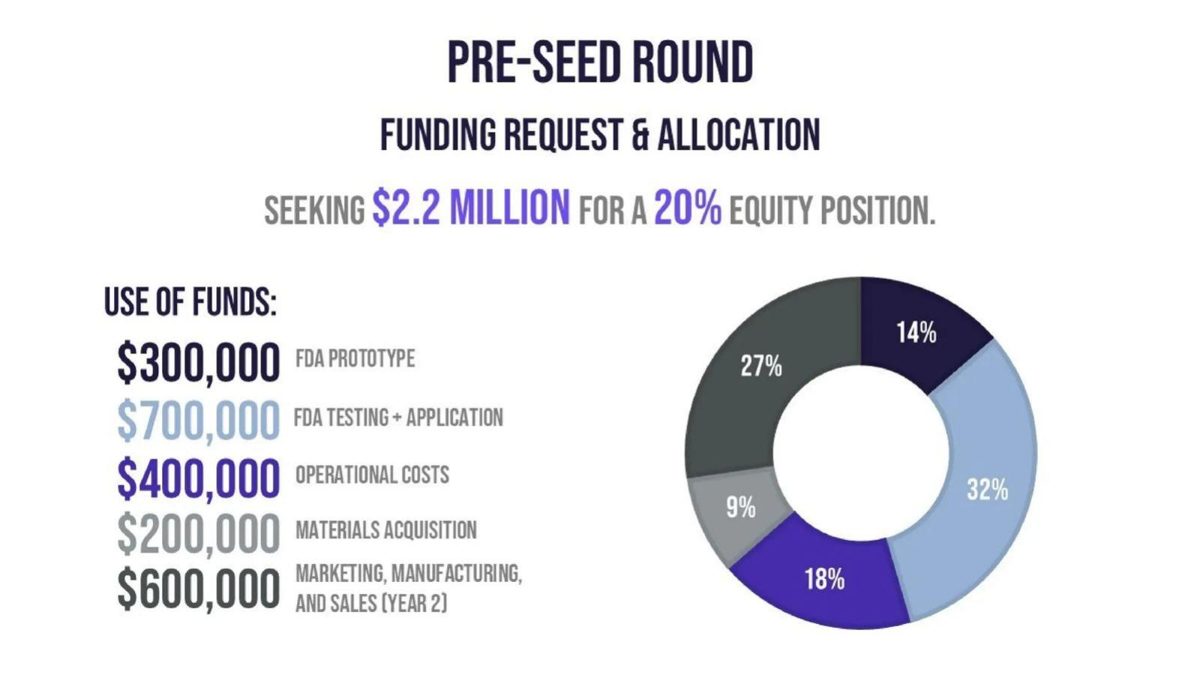
Axcess Instruments deck, slide 12. Exact stored slide matched to this analysis.
Our analysis: Reconciles and fits the regulatory stage.
Evidence and limitation: Our checks: amounts sum to $2.2M, shares match; implied post-money $11M.
What a founder can adapt: Mark which buckets fall in which year.
Supporting analysis
What the deck claims: $2.2M for 20%; FDA prototype $300,000, FDA testing $700,000, operations $400,000, materials $200,000, marketing and sales (year 2) $600,000; donut 14/32/18/9/27%.
Presentation choice: Dollars and shares agree and sales is dated to year 2.
When it does not fit: Don't show only a donut without the amounts behind it.
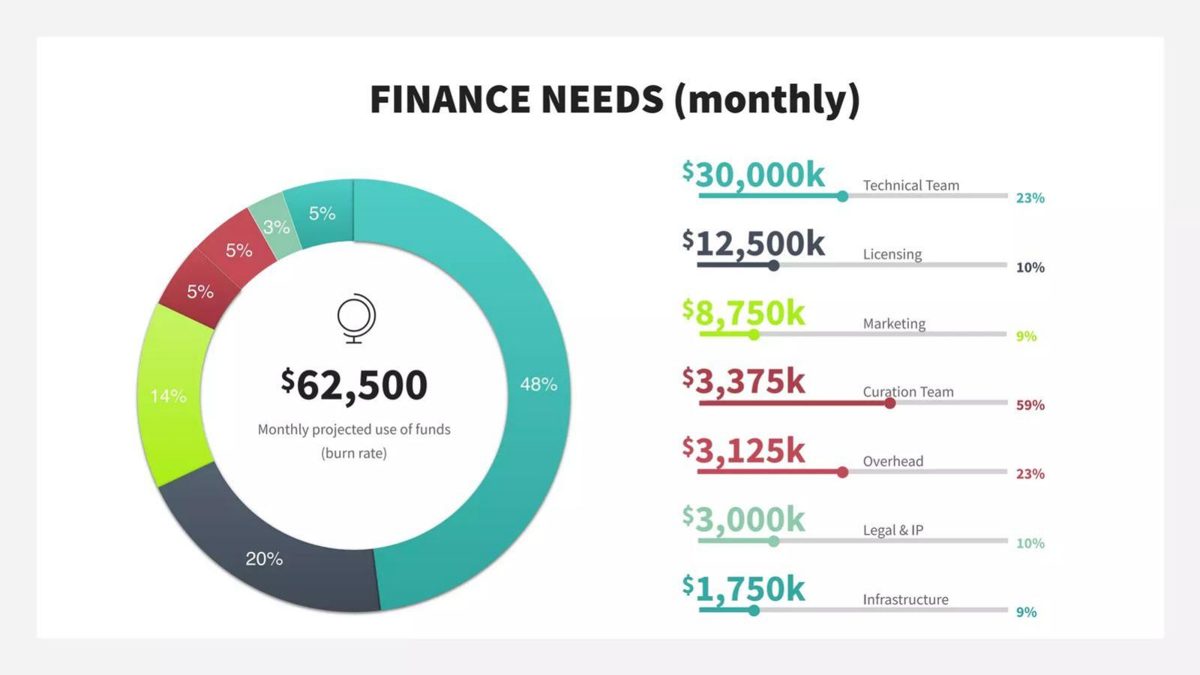
Treever deck, slide 17. Exact stored slide matched to this analysis.
Our analysis: Right total, wrong units, two sets of shares.
Evidence and limitation: Our checks: read as dollars the lines sum to $62,500; the "k" suffix makes them thousands of times larger; side percentages match nothing.
What a founder can adapt: State the burn and the runway the raise buys.
Supporting analysis
What the deck claims: $62,500 monthly burn: technical team $30,000k, licensing $12,500k, marketing $8,750k, curation $3,375k, overhead $3,125k, legal and IP $3,000k, infrastructure $1,750k; pie 48/20/14/5/5/3/5%.
Presentation choice: Monthly burn converts directly into runway.
When it does not fit: Don't add "k" to a figure already written in full.
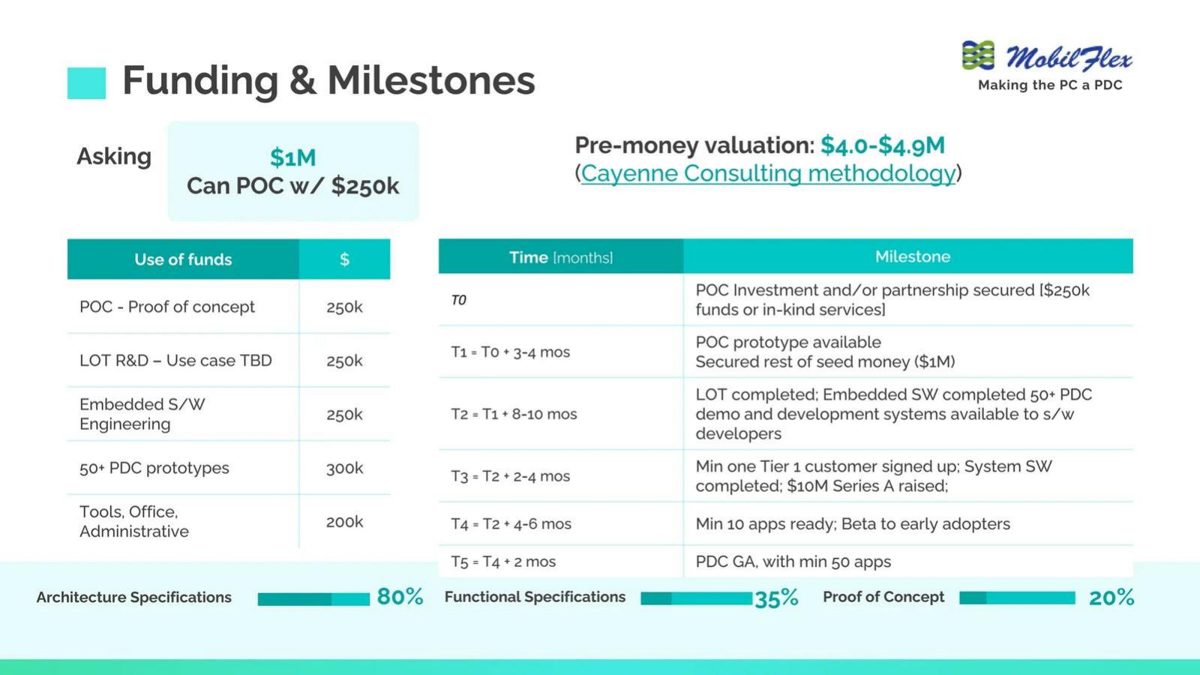
MobilFlex deck, slide 12. Exact stored slide matched to this analysis.
Our analysis: Good milestone sequencing, uses exceed the raise.
Evidence and limitation: Our calculation: uses total $1.25M against a $1M ask.
What a founder can adapt: Make the table sum to the ask or state the gap.
Supporting analysis
What the deck claims: Asking $1M, POC possible with $250k; pre-money $4.0M-$4.9M; uses $250k, $250k, $250k, $300k, $200k; milestones T0 to T5 ending in general availability.
Presentation choice: Staged funding and milestones are shown together.
When it does not fit: Don't list more uses than the round funds.
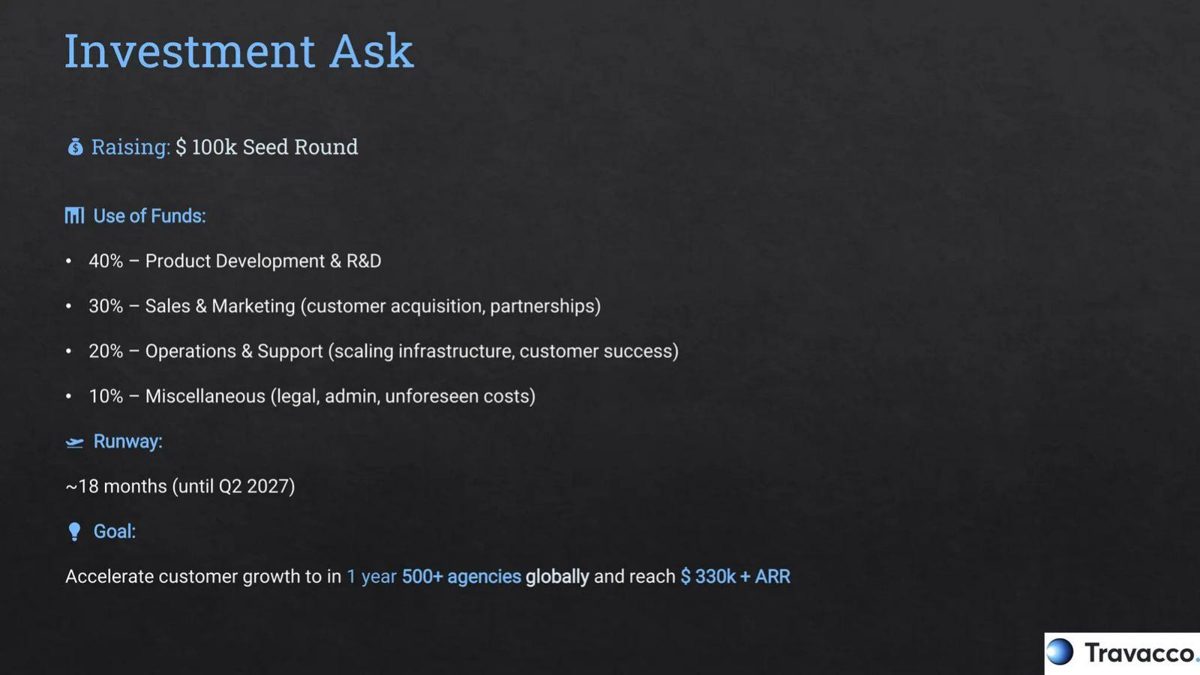
Travacco deck, slide 14. Exact stored slide matched to this analysis.
Our analysis: Small but every figure derivable.
Evidence and limitation: Our calculations: about $5,600 a month; $660 per agency per year; about $60 of acquisition spend per agency.
What a founder can adapt: Print the implied cost per customer yourself.
Supporting analysis
What the deck claims: 40% product, 30% sales and marketing, 20% operations, 10% miscellaneous; runway about 18 months; goal 500+ agencies and $330k+ ARR in a year.
Presentation choice: Amount, runway and goal together allow unit checks.
When it does not fit: Don't leave the acquisition cost implicit if it looks low.
Security hardware sold through Home Depot, Lowe's and Amazon.
Nu-Set deck, slide 12. Exact stored slide matched to this analysis.
Our analysis: Concrete hires, unknown budget.
Evidence and limitation: Totals 100%; headcount given, amount withheld.
What a founder can adapt: Give the amount so salaries can be checked.
Supporting analysis
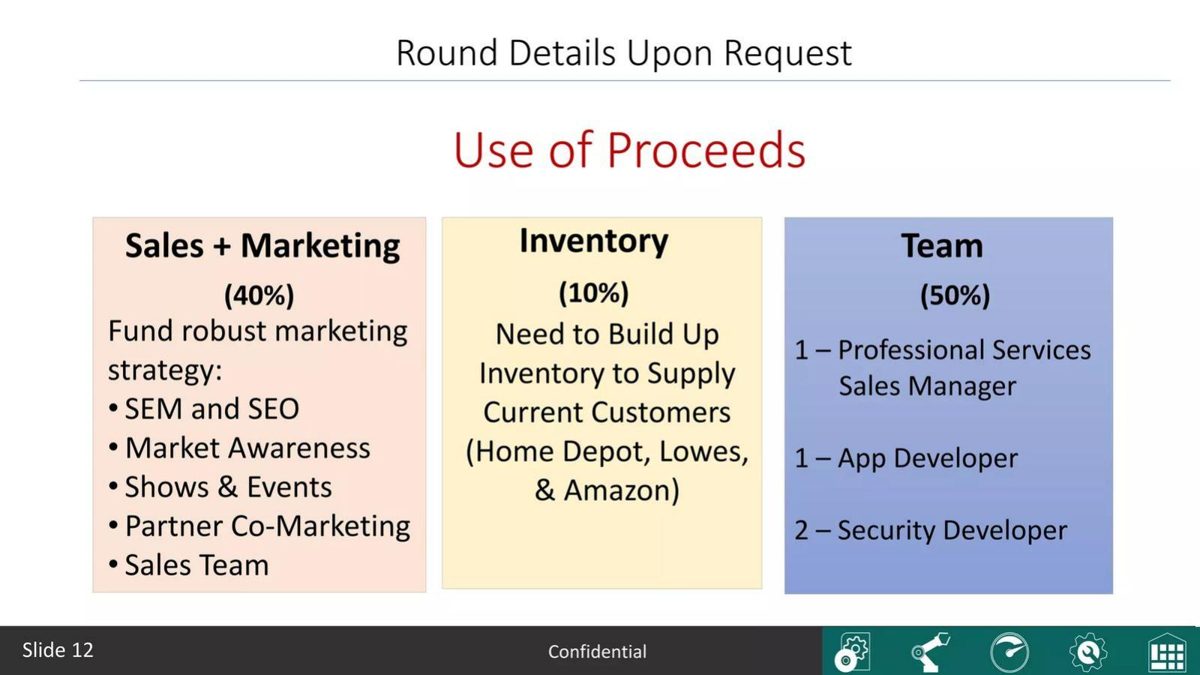
What the deck claims: "Round Details Upon Request"; sales and marketing 40%, inventory 10%, team 50% (sales manager, app developer, two security developers).
Presentation choice: Naming hires makes the team bucket tangible.
When it does not fit: Don't withhold the raise on the slide that allocates it.
Columns report what each slide states or leaves out; checks are our calculations.
Example
Raise stated
Dollars per bucket
Sums to raise
Shares total
Tied to time or milestone
Dotty
$500,000
Yes
Yes
100%
12-month pipeline
Axcess Instruments
$2.2M
Yes
Yes
100%
Year 2 for sales
Treever
Monthly $62,500
Yes, wrong units
Yes
100% (pie)
Monthly burn
MobilFlex
$1M
Yes
No, $1.25M
Not shown
Milestone timeline
Rootine
Not on page
No
Cannot check
110%
Outcome milestones
Pollitrace
$53,400
No
Cannot check
85% labelled
No
Canix
$1.5M-$2.0M
No
Range
100%
18-24 months
Travacco
$100k
No
Derivable
100%
18 months, 12-month goal
Carbon Block
$650k equity, $1.11M total
Sources only
Sources yes
100%
Goals only
Koala
$3.5M
No
Derivable
100%
No
Kiln
Not stated
No
Cannot check
100%
Milestones, undated
Nu-Set
Withheld
No
Cannot check
100%
Hires named
Key Takeaways
Make the uses sum to the ask. MobilFlex's uses total $1.25M against a $1M ask (our calculation).
Make percentages total 100%. Rootine's slices add to 110%.
Label every slice. Pollitrace's labels cover 85% of its pie.
Give dollars, not only shares. Dotty's table shows both and both reconcile.
Check units. Treever's "$30,000k" reads as $30 million.
Tie big buckets to milestones and months. Canix's range implies about $83k a month either way (our calculation).
Build your use-of-funds line
Fill in each field, then run the four checks.
Raise. Exact amount (or range, and what changes across it)?
Buckets. Four to six buckets, each in dollars?
Sum. Do the dollars add to the raise?
Shares. Do the percentages total 100% and match the dollars?
Time. Monthly burn and runway the raise buys?
Outcome. What milestone does the largest bucket buy, by when?
Copyable framework: Raising [amount] for [months] of runway at [burn]/month: [bucket A] [$] ([x]%) to [milestone by date]; [bucket B] [$] ([y]%)… total [amount] (100%).
After: Asking $1M: POC $250k, LOT R&D $250k, embedded software $250k, prototypes $250k (reduced from $300k); tools and admin funded from the next close.
What improved: Illustrative rewrite showing MobilFlex's uses brought within the ask; the allocation is our example, not the company's.
What an investor checks on a use-of-funds slide
The use-of-funds slide is where the ask becomes a plan. Investors use it to judge whether the founders know what the next stage costs, whether the money goes to the thing that most needs proving, and whether the round is sized to reach a milestone that will support the next raise. None of that can be judged if the numbers on the slide do not agree with each other, and in practice the first thing many readers do is add them up.
There are four mechanical checks. Do the dollar amounts sum to the amount being raised? Do the percentages sum to 100%, within a point for rounding? Does each percentage match its dollar amount? And is every slice labelled, so that no part of the round is unaccounted for? A slide that passes all four has done the minimum. A slide that fails any of them tells the reader the plan was assembled for display rather than built from a budget.
Two judgement checks follow. First, does the allocation fit the stage? A pre-seed medical device company spending most of its round on regulatory testing, as Axcess Instruments plans, makes sense; a company with no product spending most of its round on marketing needs an explanation. Second, does the allocation connect to time and outcomes? A bucket becomes meaningful when it states a monthly cost, a headcount or a milestone. "Sales & Marketing 30%" is a share; "$30,000 to sign 500 agencies in 12 months" is a plan.
Allocations that reconcile
Dotty's page 28, "Use of Funds", is a table of one-time year-1 start-up costs with amount, share and details for each line: software development V2.0 $150,000 (30%), sales wages and commissions $120,000 (24.0%), working capital $60,400 (12.1%), white-label app upgrade $50,000 (10%), consumer app $42,000 (8.4%), marketing $30,000 (6.0%), sales travel $24,000 (4.8%), infrastructure and licences $12,000 (2.4%), legal $6,000 (1.2%), accounting $3,600 (0.7%), insurance $2,000 (0.4%), subtotal $500,000 (100.0%). Our checks: the amounts add to exactly $500,000 and every percentage is its amount divided by $500,000. The details column adds the link to outcomes: the sales line is to "build out $2M pipeline within 12 months". The one question it raises is scale: $120,000 of sales wages is expected to produce a $2M pipeline, a ratio of about 17 to 1 (our calculation) that the deck should support elsewhere.
Axcess Instruments' page 12, "Pre-Seed Round Funding Request & Allocation", seeks "$2.2 million for a 20% equity position" and lists $300,000 FDA prototype, $700,000 FDA testing and application, $400,000 operational costs, $200,000 materials acquisition and $600,000 marketing, manufacturing and sales (year 2), with a donut of 14%, 32%, 18%, 9% and 27%. Our checks: the amounts add to $2.2M; each percentage is its amount over $2.2M rounded to the nearest point; $2.2M for 20% implies an $11M post-money valuation. The allocation fits the stage: 46% goes to prototype and regulatory work before any sales spending, and the sales bucket is marked as year 2.
Treever's page 17, "Finance Needs (monthly)", shows a $62,500 monthly burn split into technical team, licensing, marketing, curation team, overhead, legal and IP, and infrastructure, labelled $30,000k, $12,500k, $8,750k, $3,375k, $3,125k, $3,000k and $1,750k, with pie slices of 48%, 20%, 14%, 5%, 5%, 3% and 5%. Our checks: read as dollars, the lines add to exactly $62,500 and the first three shares are exact (48.0%, 20.0%, 14.0%). But the "k" after each figure multiplies it by a thousand, so taken literally the technical team alone costs $30 million a month. The small slices are also off: legal and IP is 4.8% and infrastructure 2.8% (our calculations), and the percentages printed beside each bar (23%, 10%, 9%, 59%, 23%, 10%, 9%) match nothing on the slide. Expressing the plan as a monthly burn is useful, because it converts directly into runway once the raise is known.
Allocations that don't add up
MobilFlex's page 12, "Funding & Milestones", is otherwise one of the better-structured slides: "Asking $1M, Can POC w/ $250k", a pre-money of $4.0M to $4.9M, a use-of-funds table and a milestone timeline from T0 to T5 (POC investment secured, prototype, embedded software with 50+ PDC demo systems, a Tier 1 customer and a $10M Series A, 10 apps in beta, general availability with 50 apps). The problem is the table: proof of concept $250k, LOT R&D $250k, embedded software engineering $250k, 50+ PDC prototypes $300k, tools, office and administrative $200k. Our calculation: $1.25M, a quarter more than the $1M ask. The milestones are well sequenced, but an investor cannot tell which $250k of the plan the round leaves unfunded.
Rootine's page 28, "Series A", pairs milestones (3x ARR, 3x memberships, launch 8 new products, key hires) with a pie of technology and product 40%, growth and brand 30%, community 20% and ops and CX 20%. The slices add to 110% (our calculation). The milestone column is a strength, since it states outcomes, but no amount appears on this page, so the reader cannot convert any slice, even a corrected one, into money.
Pollitrace's page 10, "Funding Ask", raises $53,400 to scale hardware production, enhance AI and dashboard features, expand into three additional regions and launch a certification API beta, with a donut legend of production, dashboard features, expansions and launch certification. The printed labels are 30%, 15%, 20% and 20%, which total 85% (our calculation); the chart has four slices and the legend four entries, so one slice is either mislabelled or 15 points are missing. At this size, 20% is $10,680 (our calculation), which is the whole budget for entering three new regions; stating that figure would invite the obvious question of whether it is enough.
Percentages with no amount, or a moving amount
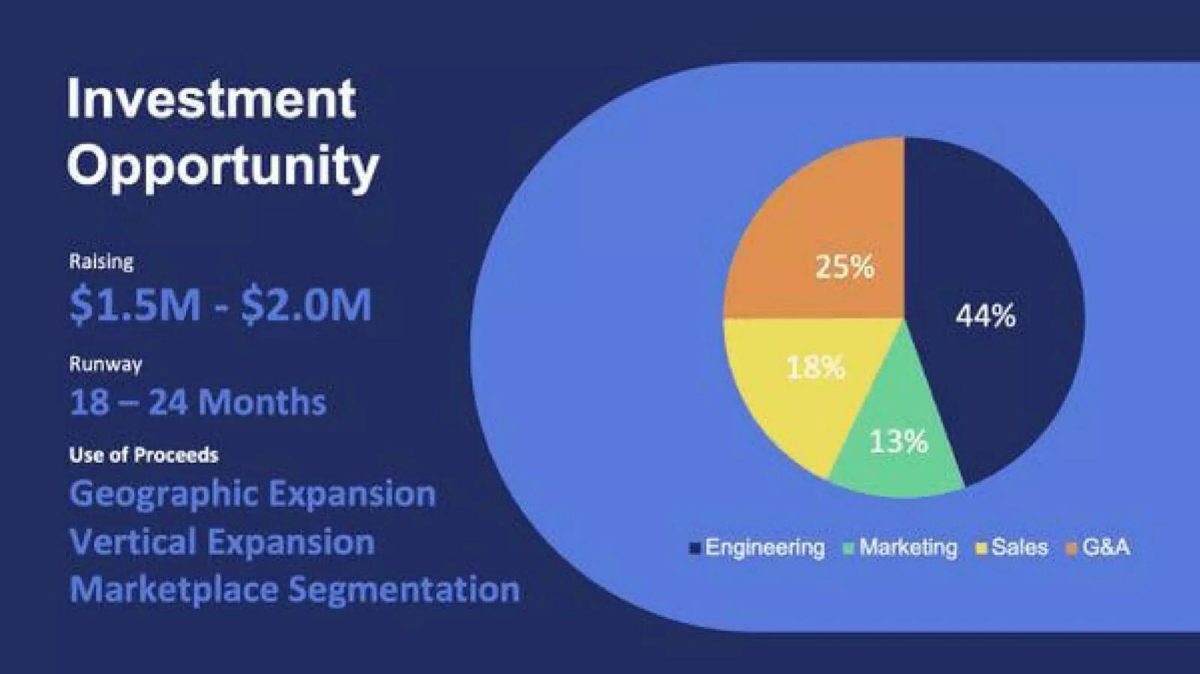
Canix's page 12, "Investment Opportunity", raises "$1.5M - $2.0M" with "18 - 24 Months" of runway and a pie of engineering 44%, G&A 25%, sales 18% and marketing 13%, which totals 100%. Because the raise is a range, each slice is too: engineering is $660,000 at the low end and $880,000 at the high end. Our calculation shows the range is at least internally consistent: $1.5M over 18 months and $2.0M over 24 months both imply about $83,000 a month. Saying so on the slide would turn the range from vagueness into a plan: a fixed monthly burn with runway that scales with the amount raised.
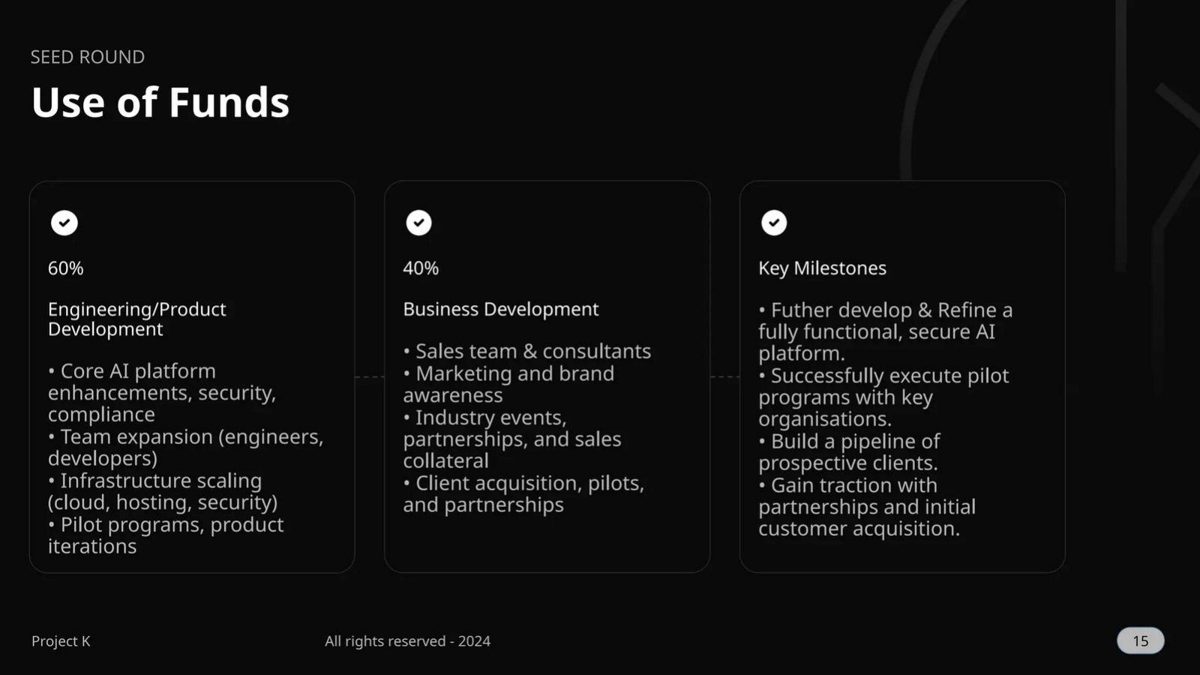
Kiln's page 13 ("Project K"), "Seed Round, Use of Funds", splits the round 60% engineering and product development and 40% business development, with bullet lists under each and a third column of key milestones (refine the AI platform, execute pilot programmes, build a pipeline, gain initial customers). Nu-Set's page 12, "Use of Proceeds", splits 40% sales and marketing, 10% inventory to supply Home Depot, Lowe's and Amazon, and 50% team (a professional services sales manager, an app developer and two security developers), under the heading "Round Details Upon Request". Both total 100%, and Nu-Set's headcount is a useful concrete detail, but neither slide states the amount, so half of an unknown sum cannot be checked against the four salaries it is meant to pay.
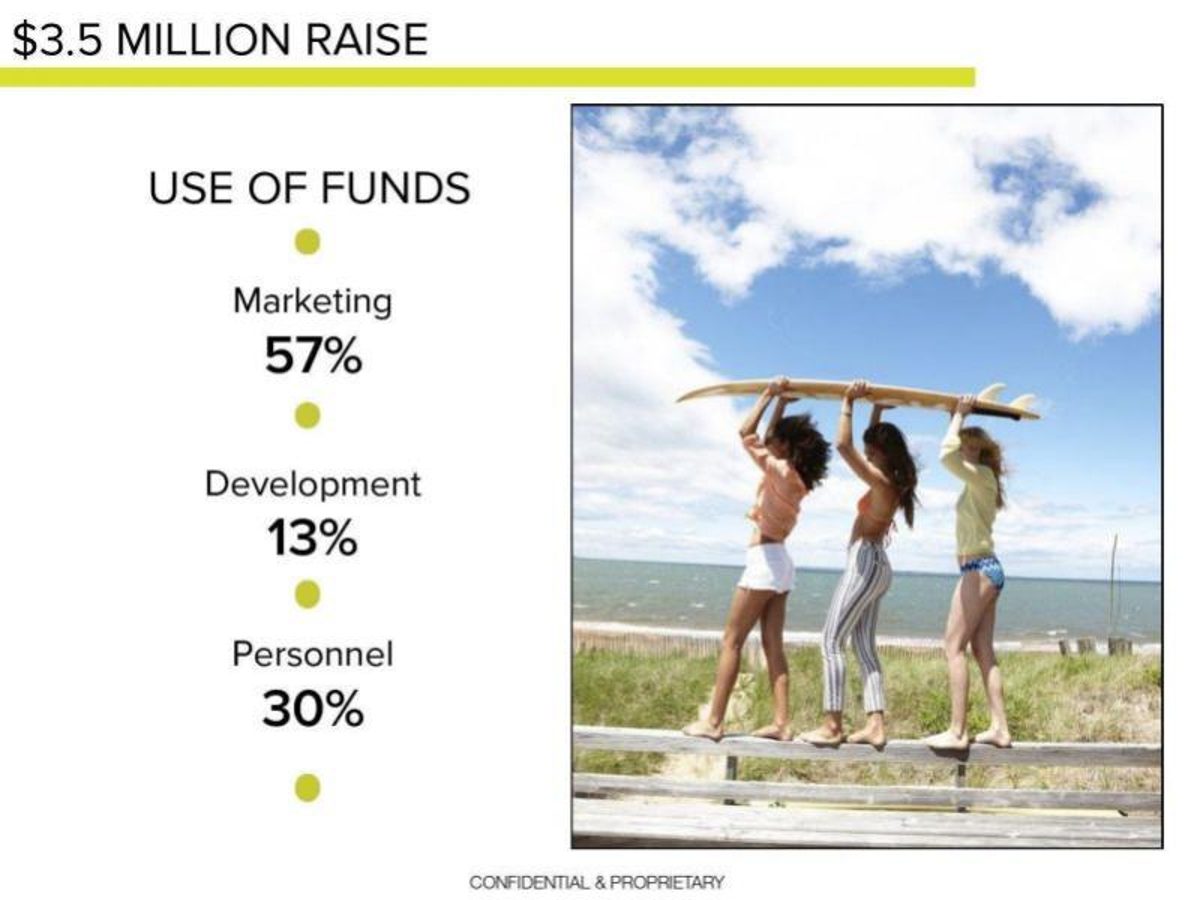
Koala's page 17, "$3.5 Million Raise", gives marketing 57%, development 13% and personnel 30%, which total 100% and convert to about $2.0M, $455,000 and $1.05M (our calculations). The allocation is checkable; what is missing is the reason. Putting more than half of a $3.5M round into marketing is a strong claim about what the company needs to prove next, and the slide gives no customer acquisition cost, target or period to judge it by.
Travacco's page 14, "Investment Ask", raises a $100k seed round split 40% product development and R&D, 30% sales and marketing, 20% operations and support, 10% miscellaneous, with about 18 months of runway (until Q2 2027) and a goal of 500+ agencies and $330k+ ARR within a year. Our calculations: 18 months on $100k is about $5,600 a month; $330k over 500 agencies is about $660 per agency per year; the $30k marketing bucket works out to about $60 of acquisition spend per agency. The figures are small but every one can be derived, which is what makes the plan discussable.
Sources as well as uses
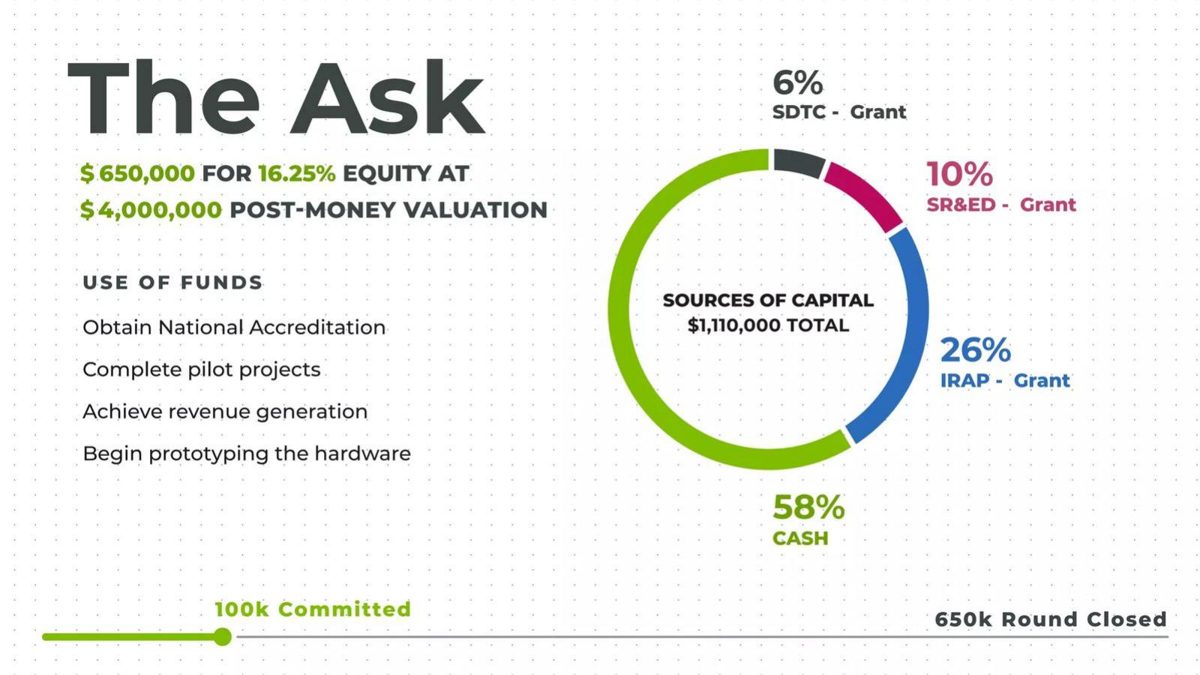
Carbon Block's page 13, "The Ask", is the one slide here that shows where the money comes from as well as where it goes: "$650,000 for 16.25% equity at $4,000,000 post-money valuation", and a donut of sources of capital totalling $1,110,000: 58% cash, 26% IRAP grant, 10% SR&ED grant and 6% SDTC grant. Our checks: $650,000 over $4,000,000 is exactly 16.25%; $650,000 is 58.6% of $1,110,000, which matches the cash slice; the grants together are about $460,000. For a company combining equity with non-dilutive funding, this is the right thing to show, because it tells the investor how far their money is levered. The uses side, by contrast, is four goals (national accreditation, pilot projects, revenue generation, hardware prototyping) with no amounts, so the reader cannot tell which goals the grants fund and which the equity funds.
How to build a use-of-funds slide that reconciles
Start from a budget, not a pie. List the costs for the period the round should cover, grouped into four to six buckets, each with a dollar amount. Add them; the total is your raise, or your raise less a stated buffer. Only then compute percentages. Dotty's table is the pattern: amount, share and one line of detail per bucket.
Add the time dimension. Either state the monthly burn and the runway it gives, as Treever and Canix partly do, or put the largest buckets on a timeline of milestones, as MobilFlex does. If the raise is a range, say what changes between the low and high end: more months, a larger team, or an extra market. A single set of percentages applied to a range hides that choice.
Finish with the four mechanical checks: dollars sum to the raise, shares sum to 100%, each share matches its dollars, every slice labelled. Then check the units: a "k" that turns $30,000 into $30,000,000 is the kind of error an investor notices first and remembers longest.
Common mistakes
Uses exceed the ask. Add the buckets before presenting.
Shares over 100%. Recompute from dollars.
Unlabelled slices. Every slice needs a name and value.
No amount. Shares need a total to mean anything.
Unit errors. Don't write $30,000k for $30,000.
Range without a plan. Say what the top of the range adds.
Diagnostic checklist
The raise amount appears on the slide.
Each bucket has a dollar amount.
Dollars add to the raise.
Percentages total 100% and match the dollars.
Monthly burn or runway is stated.
The largest bucket is tied to a dated milestone.
Frequently asked questions
Should use of funds be in dollars or percentages?
Both, if you can. Dollars let an investor check the plan against the raise; percentages show the balance. Dotty and Axcess Instruments show both and both reconcile.
What if I'm raising a range?
State the monthly burn and what the top of the range adds. Canix's $1.5M-$2.0M over 18-24 months implies about $83,000 a month either way; saying so explains the range.
How detailed should the breakdown be?
Four to six buckets is typical. Dotty's eleven lines work because they are in a table with amounts; a pie with eleven slices would not.
Should I show grants and other funding?
Yes. Carbon Block shows its $650,000 equity is 58% of $1,110,000 in total capital, which tells investors how far their money goes.
How do I check my own slide?
Add the dollars, add the percentages, divide each amount by the total, and check the units. MobilFlex, Rootine, Pollitrace and Treever each fail one of these.
How we chose these examples
Search (2026-09-30): the durable corpus index (docs/seo/artifacts/corpus-search, 70,729 unique pages, deduplicated by deck-file sha256 + page) was searched for "use of funds" and "use of proceeds" (272 pages) and narrowed to pages with a percentage or dollar allocation. Listed-company, mining, energy, fund, SPAC and token-sale decks were excluded.
Sixteen candidate pages were selected; fourteen were rendered from the original public deck files and read from the images; twelve are used: Dotty 28, Axcess Instruments 12, Treever 17, MobilFlex 12, Rootine 28, Pollitrace 10, Canix 12, Travacco 14, Carbon Block 13, Koala 17, Kiln 13 and Nu-Set 12.
Left out: Beatstoc 12 and Plantt 23 (deck files unavailable); Mio Marketplace 13 (use-of-funds list without amounts or shares); The Good Face Project 10 (a 40/29/16/14 split that repeats the Koala lesson); Choice n Cheers 14 (already analysed in the investor returns guide). Slides already used in the general ask slide and runway guides were not reused.
Figures are as printed on each slide; we did not have the companies' budgets. How we built this: drafted and checked with AI assistance (editorial model review against the original slide images); no human editor has reviewed this guide.