The Darden Sale of Red Lobster deck is a highly technical, 15-slide corporate divestiture presentation. Unlike a startup pitch seeking growth capital, this deck is designed to justify a $2.113 billion exit to a skeptical shareholder base. It utilizes a 'sum-of-the-parts' logic, arguing that Red Lobster’s volatility and lagging same-restaurant sales—which underperformed the Knapp Track benchmark by as much as 11.0% in January 2014 (Slide 9)—were dragging down the valuation of Darden’s healthier assets like Olive Garden and LongHorn Steakhouse. The presentation is a masterclass in defensive fin…
Key takeaways
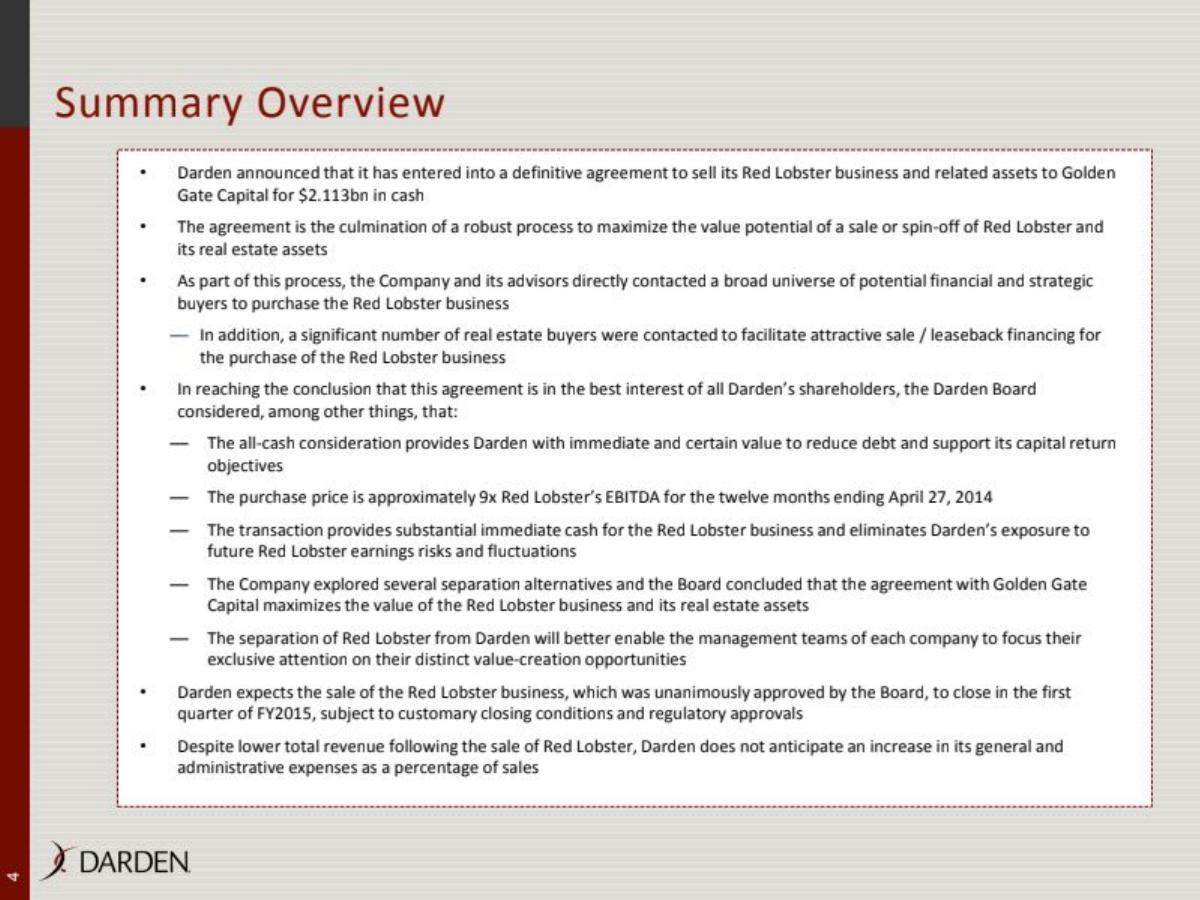
- The sale price of $2.113 billion represented a purchase multiple of approximately 9x Red Lobster's LTM EBITDA (Slide 4).
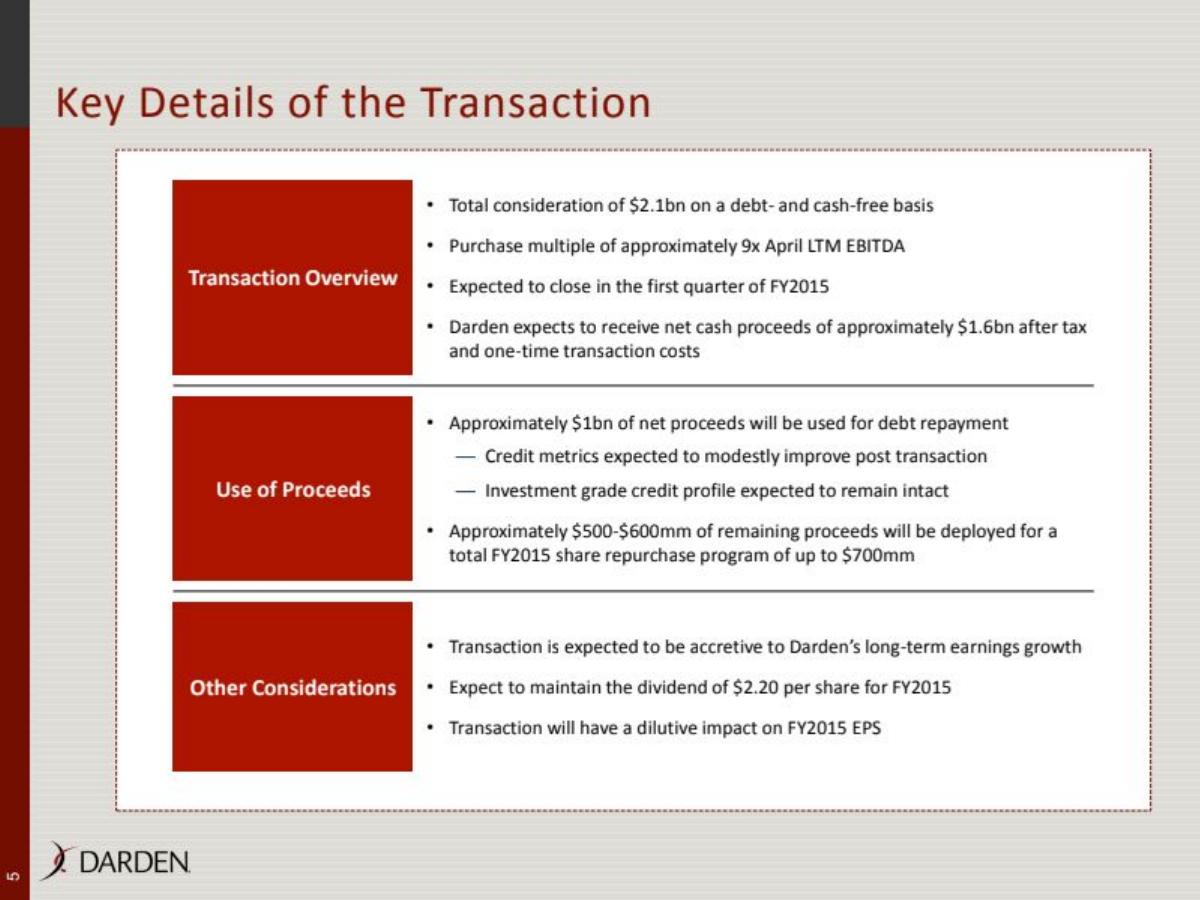
- Darden planned to use $1 billion of the net proceeds for debt repayment to maintain its investment-grade credit profile (Slide 5).
- Red Lobster consistently underperformed the industry, with same-restaurant sales lagging the Knapp Track index for nearly every month from June 2012 to April 2014 (Slide 9).
- The divestiture allowed Darden to focus on its 'Core Concepts,' specifically Olive Garden which maintained 836 units and an AUV of $4.4 million (Slide 11).
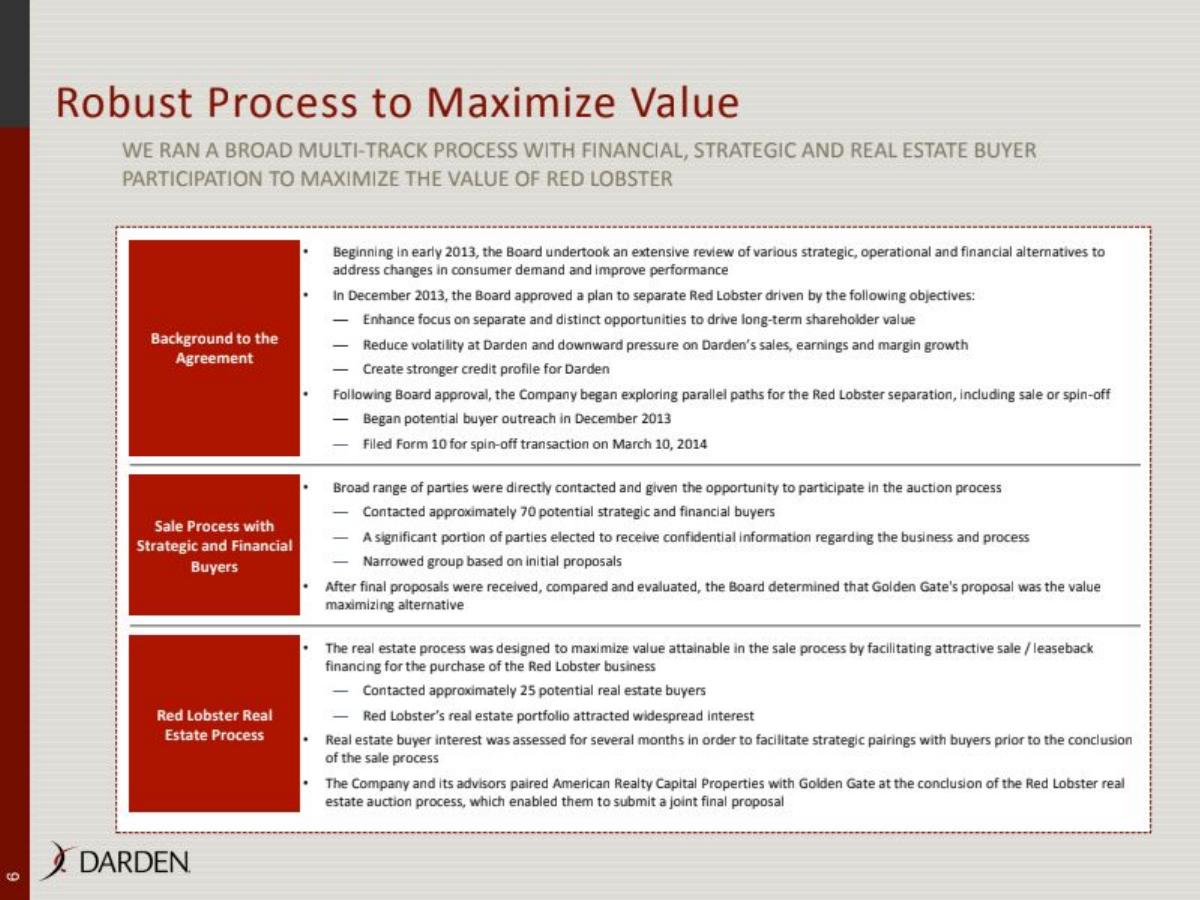
- The transaction was structured to include a sale-leaseback of Red Lobster’s real estate assets, involving American Realty Capital Properties (Slide 6).
- Management projected a $700 million share repurchase program for FY2015 following the close of the deal (Slide 8).
- The deck explicitly addresses activist investor Starboard Value's call for a special meeting, arguing that a delay would risk a lower acquisition price (Slide 14).
- Red Lobster's EBITDA margin had declined from 13% in FY2010 to 9% in the LTM period ending April 2014 (Slide 10).
The Strategic Divorce: Analyzing the Red Lobster Divestiture
The 2014 sale of Red Lobster by Darden Restaurants remains a landmark case study in corporate restructuring. This was not a startup looking for its first million; it was a Fortune 500 company offloading a legacy brand to save the parent entity. The 15-slide deck is a clinical, data-heavy justification for a $2.1 billion transaction. It serves as a bridge between management's strategic vision and the shareholders' demand for value. The narrative is clear: Red Lobster is a volatile asset that no longer fits the Darden portfolio, and its removal will unlock the potential of Olive Garden and LongHorn Steakhouse.
Slides 1-3: The Legal and Administrative Foundation
The presentation opens with a standard title slide (Slide 1) featuring the Darden logo and its portfolio of brands, including Olive Garden, LongHorn Steakhouse, Bahama Breeze, Seasons 52, The Capital Grille, Eddie V’s, and Yard House. The presence of these logos immediately establishes the 'Sum of the Parts' context that will dominate the financial arguments later in the deck.
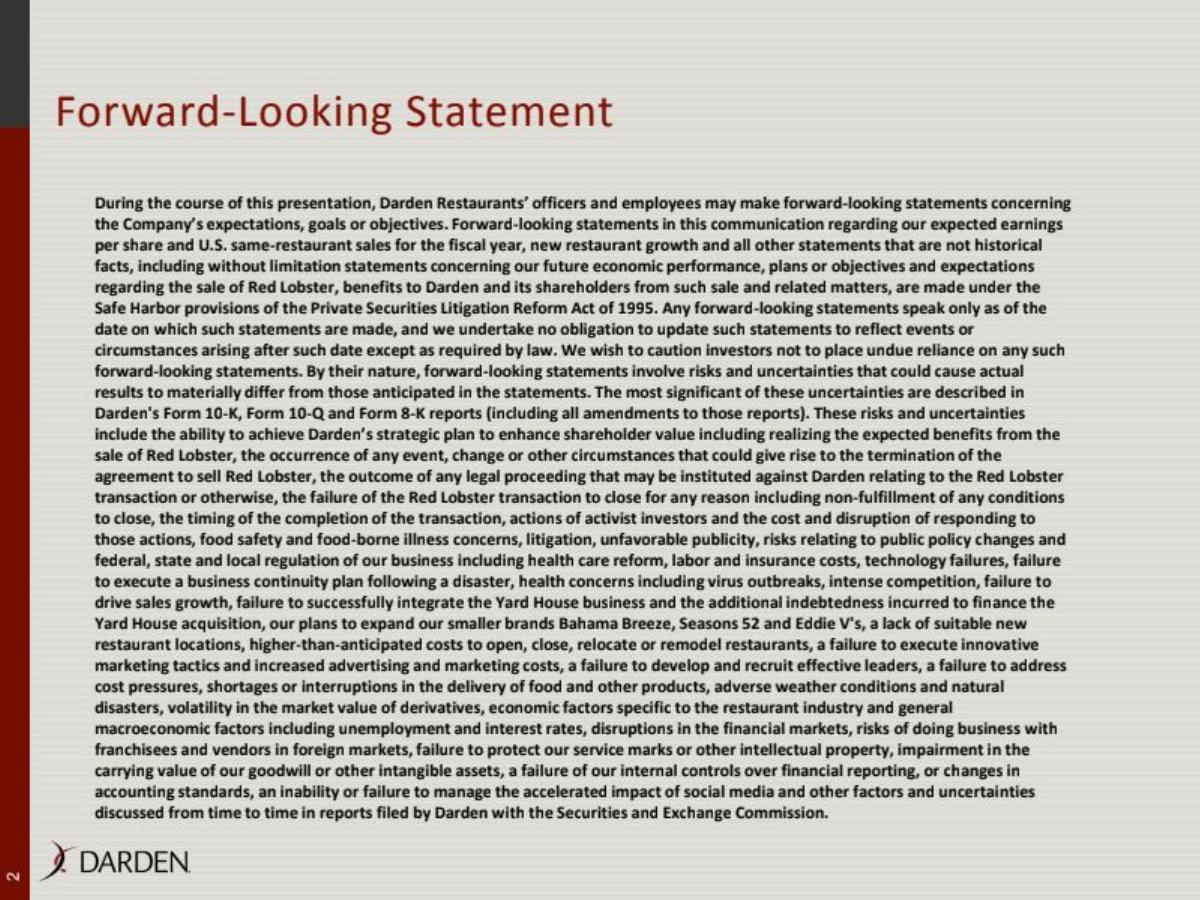
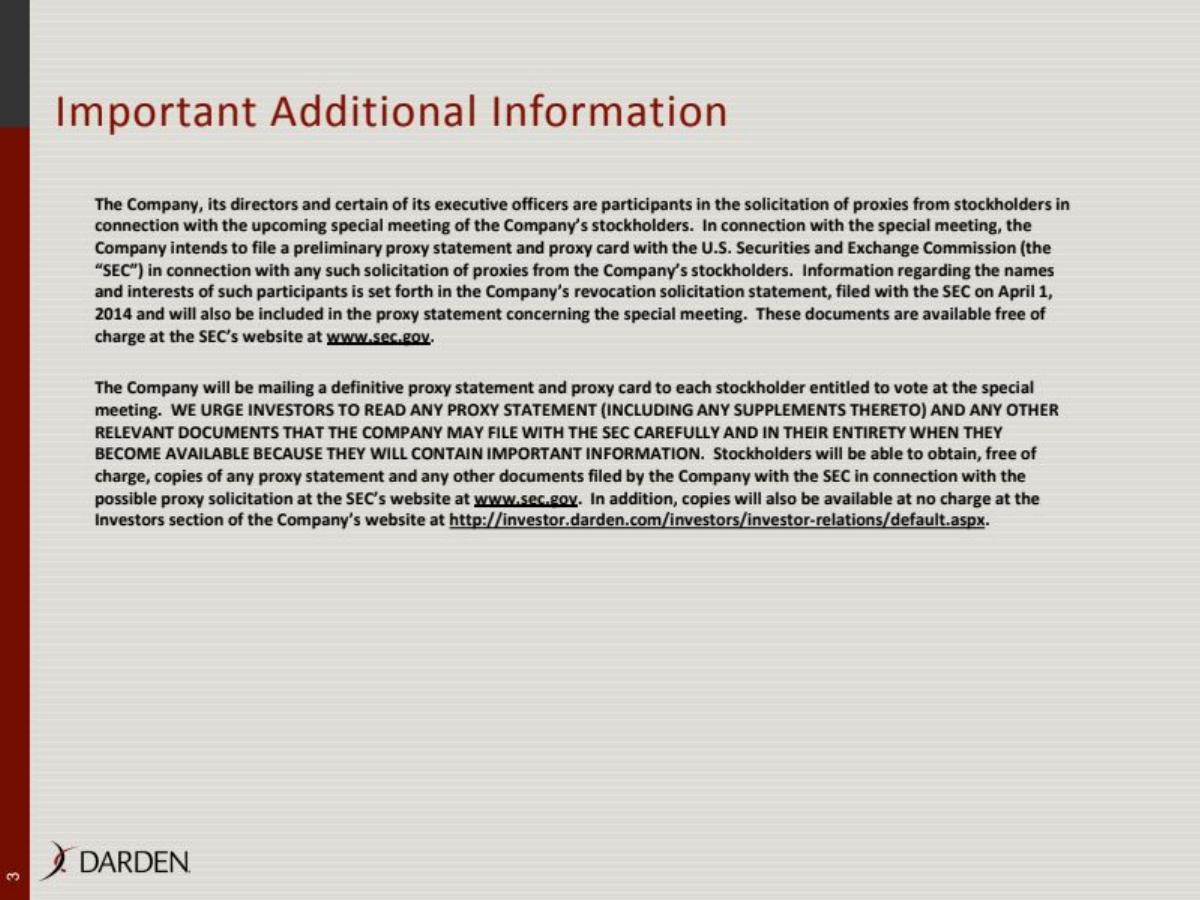
Slides 2 and 3 are dedicated to Forward-Looking Statements and Important Additional Information . While often ignored in startup decks, these are critical here. They explicitly mention the 'Safe Harbor' provisions of the Private Securities Litigation Reform Act of 1995 and reference the proxy statements filed with the SEC. These slides signal that the following data is subject to regulatory scrutiny and that a special meeting of stockholders is the ultimate venue for the decision.
Slide 4: Summary Overview of the $2.113 Billion Deal
Slide 4 delivers the 'Executive Summary' of the transaction. It confirms that Darden entered into a definitive agreement to sell Red Lobster to Golden Gate Capital for $2.113 billion in cash . Key strategic points include:
The agreement was the culmination of a 'robust process' to maximize value. · The purchase price is approximately 9x Red Lobster’s EBITDA for the twelve months ending April 27, 2014. · The deal provides immediate cash to reduce debt and support capital return objectives. · The separation allows management teams to focus exclusively on their distinct value-creation opportunities.
This slide sets the tone for the rest of the deck: this is an all-cash, high-multiple exit that solves the parent company's debt and focus problems.
Slide 5: Key Details and Use of Proceeds
Slide 5 breaks down the math of the $2.1 billion. It notes that Darden expects to receive net cash proceeds of approximately $1.6 billion after taxes and transaction costs. The 'Use of Proceeds' section is the most important part of this slide for investors:
$1 billion for debt repayment to maintain investment-grade credit metrics. · $500-$600 million for a share repurchase program of up to $700 million in FY2015. · Maintenance of the $2.20 per share dividend for FY2015.
By detailing exactly where the money goes, Darden is attempting to pacify shareholders who might be concerned about the loss of Red Lobster’s cash flow.
Slide 6: The 'Robust Process' and Real Estate Strategy
To counter accusations that the sale was rushed or undervalued, Slide 6 outlines the auction process. Darden claims to have contacted 70 potential strategic and financial buyers . More interestingly, they contacted 25 potential real estate buyers to facilitate a sale-leaseback. The slide reveals that American Realty Capital Properties paired with Golden Gate Capital to submit the winning joint proposal. This highlights that the deal wasn't just about the restaurant operations, but about unlocking the value of the underlying real estate.
Slides 7-8: Rationale and Objective Alignment
Slides 7 and 8 use a checklist format to show how the sale meets previously communicated objectives. Slide 7 features a series of checkmarks next to goals like 'Maintain the dividend' and 'Avoid complexity that could derail Olive Garden improvement.' Slide 8 provides more granular detail, noting that the sale reduces exposure to the volatility of seafood costs and addresses the fact that Red Lobster has 'lagged the growth of other brands in the portfolio.'
Slide 9: The 'Smoking Gun' of Underperformance
Slide 9 is the most visually striking and damaging slide in the deck. It shows a bar chart of Red Lobster Same-Restaurant Sales compared to the Knapp Track (an industry benchmark). For almost every month from June 2012 to April 2014, Red Lobster’s bars are deep in the red. In January 2014, Red Lobster underperformed the industry by a staggering 11.0% . This slide provides the empirical proof that Red Lobster was a 'leaky bucket' in the Darden portfolio.
Slide 10: Historical Financial Performance Comparison
Slide 10 compares 'Darden excl. Red Lobster' with 'Red Lobster' alone. The contrast is stark:
Revenue: The core portfolio grew from $4.6B to $6.2B (LTM), while Red Lobster stayed flat at $2.5B. · EBITDA Margin: The core portfolio maintained a 12-14% margin, while Red Lobster’s margin plummeted from 13% in FY2010 to 9% in the LTM period .
The bottom of the slide contains a clear takeaway: 'Darden expects lower volatility in sales and earnings following separation.'
Slide 11: The Future of 'New Darden'
Slide 11 shifts the focus to what remains. It highlights the strength of the remaining brands:
Olive Garden: 836 units, $4.4M AUV, and 16% Return on Sales. It is noted as the '#1 Italian full service dining concept in the U.S.' · LongHorn Steakhouse: 453 units, $3.1M AUV, and 14% Return on Sales. · Specialty Restaurant Group: Includes Yard House ($6.8M AUV) and The Capital Grille.
This slide is designed to show that the 'New Darden' is a high-growth, high-margin business that was being obscured by Red Lobster’s poor performance.
Slides 12-13: Capital Returns and Future Priorities
Slide 12 boasts a track record of returning nearly $4 billion to shareholders over the past decade through dividends and share repurchases. Slide 13 lists eight 'Key Priorities,' with the Brand Renaissance Plan at Olive Garden taking the number one spot. Other priorities include growing the Specialty Restaurant Group sales by more than $1.0 billion over the next 5 years and maintaining disciplined capital allocation.
Slide 14: Addressing the Activist Elephant in the Room
Slide 14, titled 'Special Shareholder Meeting Considerations,' is a direct response to activist investor Starboard Value. Starboard had called for a special meeting to block the sale. Darden’s management argues that bidders (Golden Gate) strongly advised that a shareholder approval condition would be 'unacceptable' and that delaying the process would risk a 'less attractive acquisition price or a failed process.' This is a high-stakes defensive slide intended to convince shareholders that the 'bird in the hand' ($2.1B) is better than the uncertainty of a meeting.
Slide 15: The Closing Vision
The deck ends on Slide 15 with the corporate tagline: 'NOURISH & DELIGHT Everyone We Serve.' It is a soft landing for a presentation that was otherwise an exercise in hard-nosed financial divestiture.
What Darden Does Well in This Deck
The deck is exceptionally effective at isolating the problem . By presenting 'Darden excl. Red Lobster' as a separate entity on Slide 10, they make the financial case for the sale undeniable. The use of the Knapp Track benchmark on Slide 9 provides an objective, external standard that proves Red Lobster’s issues were internal, not just a result of a bad economy. Furthermore, the explicit 'Use of Proceeds' on Slide 5 speaks directly to the primary concerns of institutional investors: debt levels and capital returns.
What Is Missing from the Deck
The deck is notably silent on the long-term viability of Red Lobster under new ownership. While this is expected in a divestiture (the seller doesn't care what happens after the check clears), a more balanced deck might have addressed why Golden Gate Capital believed they could turn it around, which would have helped justify the 9x multiple. Additionally, there is very little detail on the tax implications of the sale-leaseback structure, which was a major point of contention for activists at the time. The deck also lacks a detailed competitive analysis for the 'New Darden'—it assumes that by simply removing Red Lobster, the remaining brands will automatically thrive.
What a Founder Should Copy
Founders can learn two major lessons from this deck. First, benchmark your performance . Slide 9’s comparison to the Knapp Track is a powerful way to show that you are either outperforming the market or, in Darden’s case, that a specific segment is underperforming. Second, be specific about the use of funds . Whether you are raising $1 million or $2.1 billion, investors want to see a line-item breakdown of where that capital is going. Darden’s Slide 5 is a perfect template for showing how an influx of cash will be allocated to maximize shareholder value.
Frequently asked questions
- Why did Darden sell Red Lobster instead of spinning it off?
- According to Slide 14, Darden’s Board concluded that a sale was superior to a spin-off because many shareholders expressed concern that a spun-off Red Lobster would have a market capitalization too small to meet investment guidelines. Additionally, the sale provided immediate cash to reduce debt and fund a $700 million share repurchase program, whereas a spin-off would not have provided the same immediate liquidity to the parent company.
- What were the specific financial terms of the deal?
- As stated on Slide 5, the total consideration was $2.1 billion on a debt- and cash-free basis. Darden expected to receive net cash proceeds of approximately $1.6 billion after taxes and transaction costs. The purchase price represented a 9x multiple of the brand's Last Twelve Months (LTM) EBITDA as of April 2014.
- How did Red Lobster's performance compare to the rest of Darden's portfolio?
- Slide 10 shows a stark contrast: Darden (excluding Red Lobster) saw revenue grow from $4.6 billion in FY2010 to $6.2 billion in the LTM period. In contrast, Red Lobster's revenue remained flat at $2.5 billion. Furthermore, Red Lobster’s EBITDA dropped from $313 million to $229 million in that same period, while the rest of the portfolio's EBITDA grew from $625 million to $720 million.
- What was the 'Brand Renaissance' plan mentioned in the deck?
- Slide 13 identifies the 'Brand Renaissance' as a key priority for Olive Garden. The plan focused on simplifying operations, enhancing food quality, and improving the guest experience. By divesting Red Lobster, Darden management argued they could exert 'greater focus' on this renaissance and other core concepts without the distraction of Red Lobster’s specific operational challenges.
- Who was the buyer and what was the role of real estate in the deal?
- The buyer was private equity firm Golden Gate Capital (Slide 4). A critical component of the deal was the real estate; Slide 6 explains that Darden contacted approximately 25 potential real estate buyers. Ultimately, American Realty Capital Properties paired with Golden Gate Capital to execute a sale-leaseback, which helped maximize the total value of the transaction.