Modulr's 2022 Series A deck is a masterclass in category creation and strategic positioning. The company raised $108M by framing the problem as a systemic failure of traditional banking infrastructure rather than a lack of features. They introduced the term 'FinOps hub' to differentiate their offering from standard payment gateways, explicitly stating they do not compete with giants like PayPal or Adyen. The deck leans heavily on regulatory excellence as a moat, citing direct connections to the Bank of England. While it lacks a traditional team slide or detailed unit economics, the sheer scal…
Key takeaways
- The deck positions the problem as a systemic 'underinvestment in innovation' by traditional banks on slide 2.
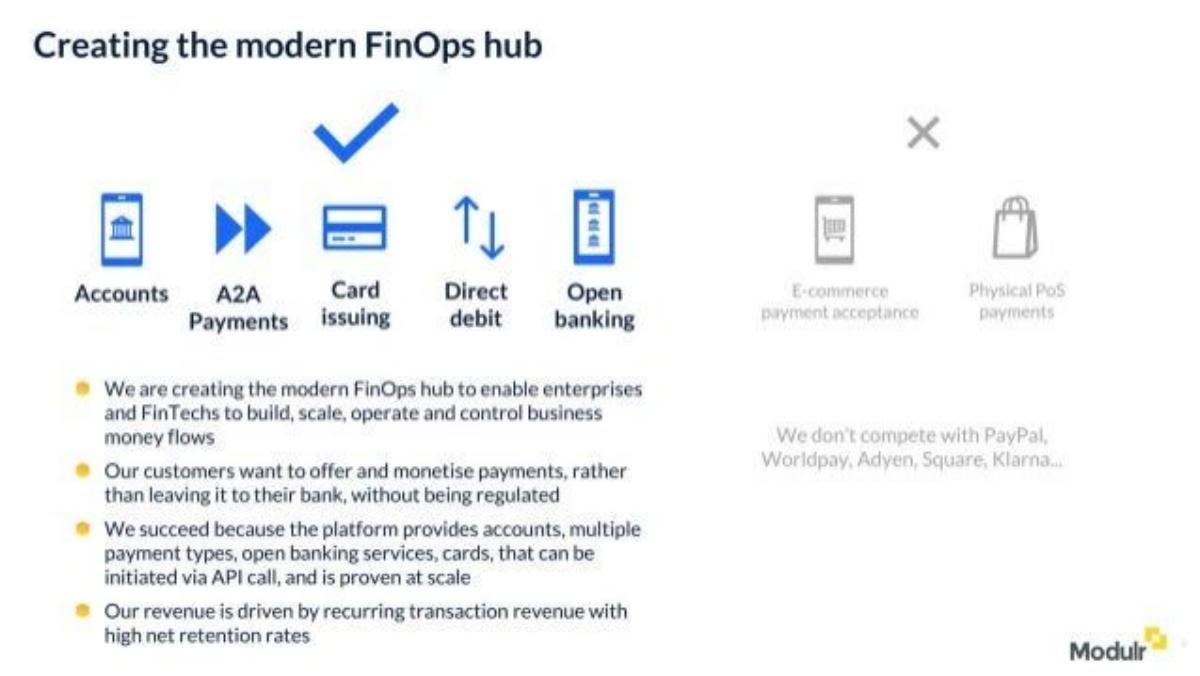
- Modulr defines a new category called the 'modern FinOps hub' to avoid direct comparison with consumer payment giants on slide 6.
- Regulatory excellence is presented as a core competitive moat, including a direct connection to the Bank of England on slide 8.
- The company demonstrates massive scale with a 105% year-on-year growth in annualised transaction revenue on slide 9.
- Market sizing uses a top-down approach, identifying a $2.1 trillion Global TAM and a $50 billion European SAM for 2025 on slide 10.
- The deck explicitly lists companies they do not compete with, such as PayPal, Square, and Klarna, to clarify their B2B infrastructure focus on slide 6.
- Operational outcomes are quantified, such as reducing payment go-live times from 1 year to 8 weeks on slide 7.
- The deck completely omits a team slide, a detailed breakdown of the 'Ask', and specific unit economics like CAC or LTV.
The Strategy of Category Creation
Modulr’s Series A deck is a concise 11-slide presentation that focuses heavily on institutional credibility and infrastructure scale. Raising $108M in 2022, a year of significant market transition, required more than just a growth chart; it required a narrative of inevitability. Modulr achieves this by framing the entire traditional banking sector as obsolete for the needs of modern digital businesses. The deck does not just pitch a product; it pitches a new layer of the financial stack.
Slide 1: The Power of Social Proof
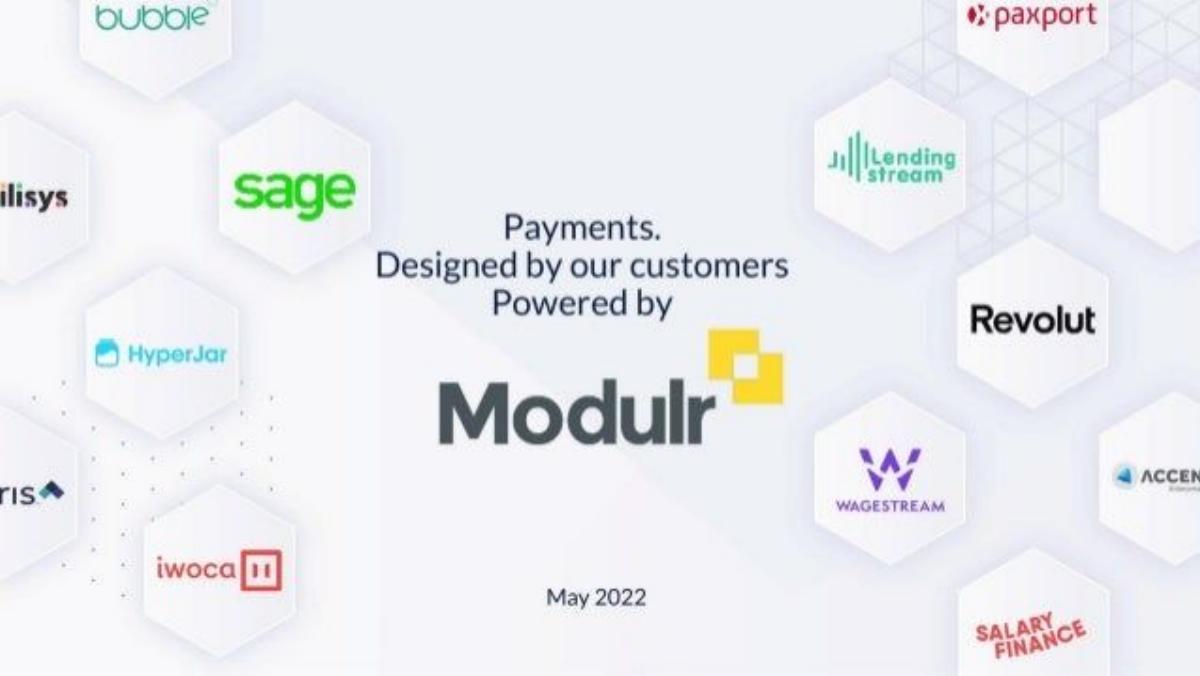
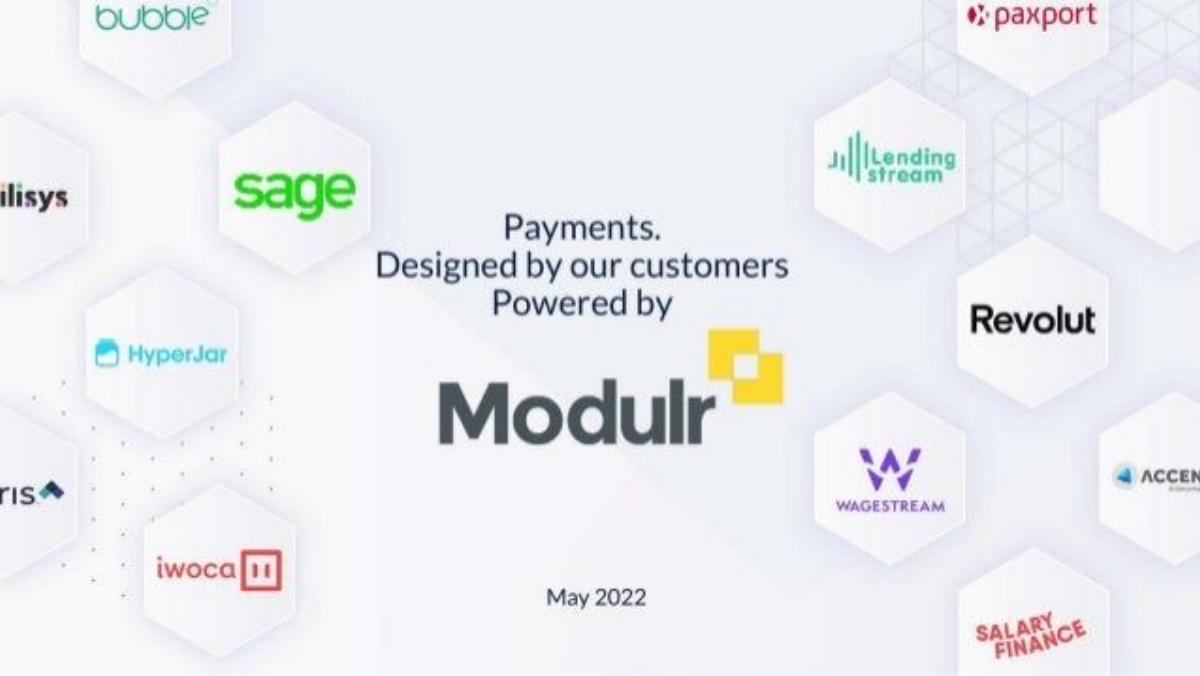
The title slide forgoes a standard mission statement in favor of a logo cloud. By stating "Payments. Designed by our customers. Powered by Modulr," the company immediately establishes itself as an invisible but essential infrastructure provider. The logos featured include high-profile FinTechs and established brands like Revolut, Sage, Iwoca, and Salary Finance . This establishes immediate trust; if Revolut relies on them, the technology is clearly enterprise-ready.
Slide 2: Systemic Problem Framing
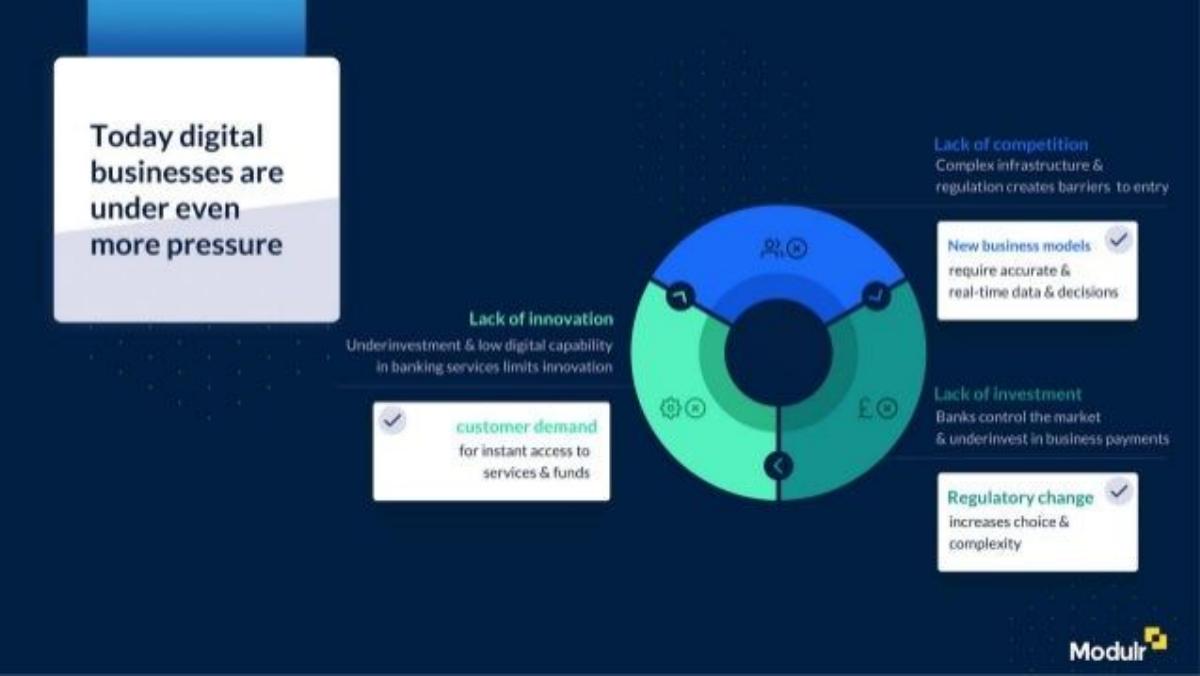
Slide 2 identifies the pressures on digital businesses. Rather than focusing on small bugs or high fees, Modulr points to "Underinvestment & low digital capability in banking services" and "Complex infrastructure & regulation" as the primary barriers. They characterize the current state as a "Lack of innovation" and a "Lack of investment" by banks that control the market. This positions Modulr as the solution to a systemic industry failure, making their growth seem like a natural market correction.
Slide 3 & 4: Identifying Hidden Inefficiencies
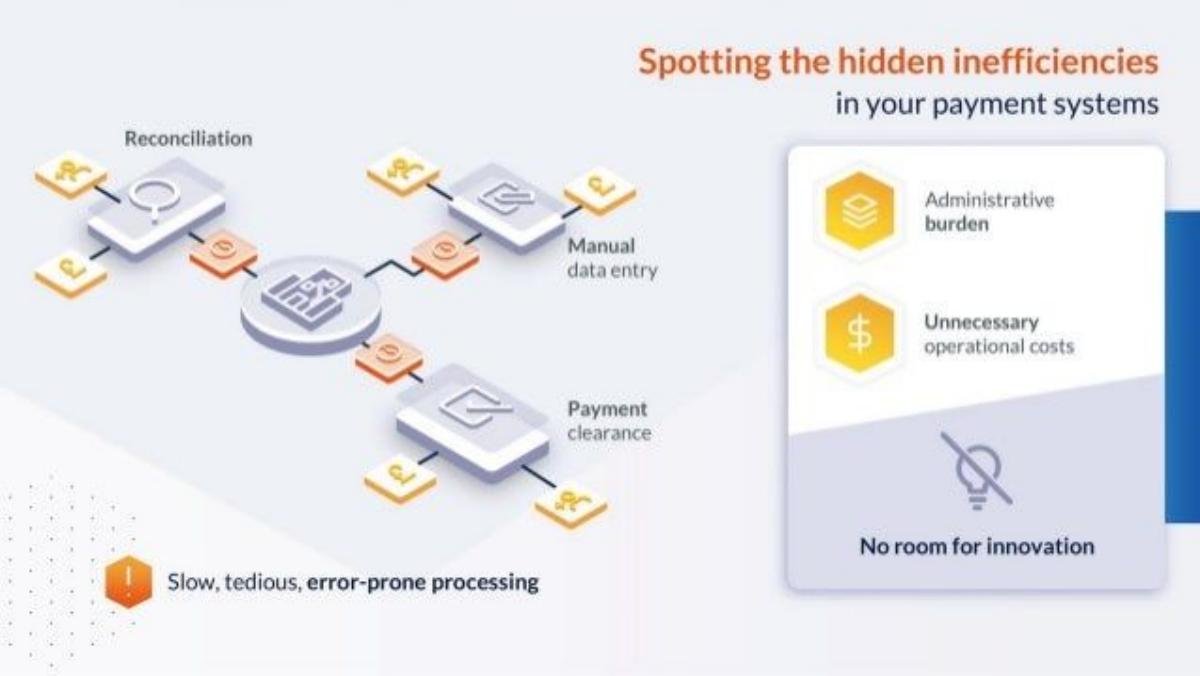
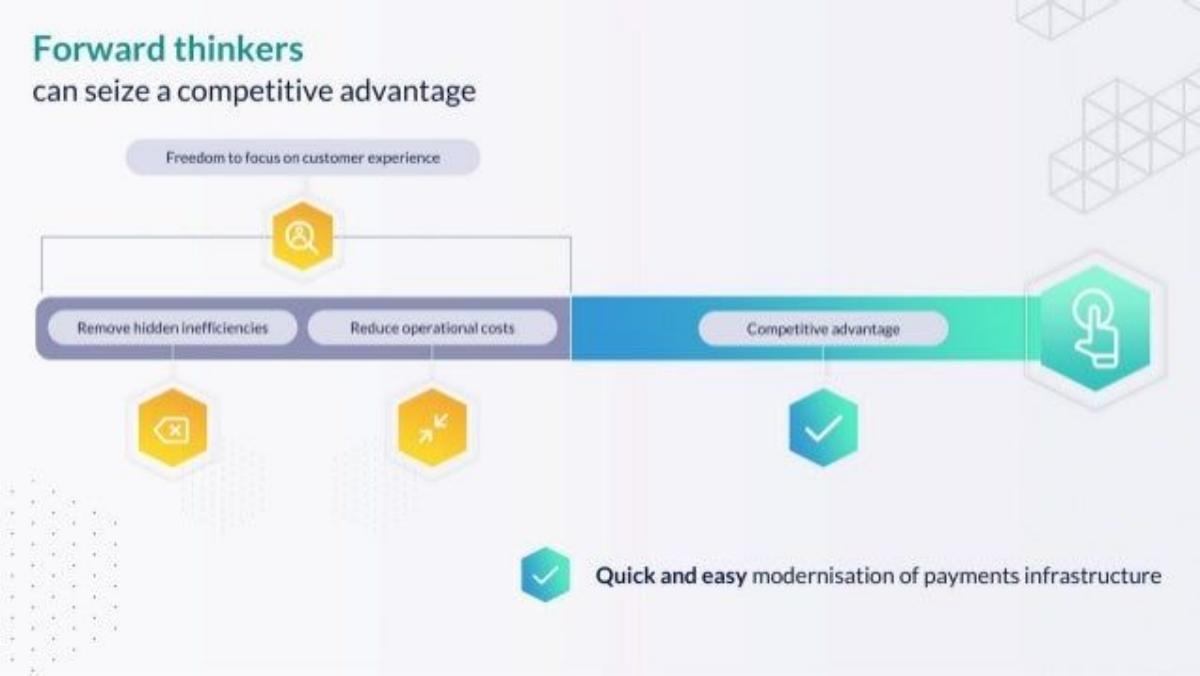
Slide 3 uses a flowchart to visualize "hidden inefficiencies" such as manual data entry and slow reconciliation. They label these processes as "Slow, tedious, error-prone processing." Slide 4 then presents the counter-narrative: "Forward thinkers can seize a competitive advantage." This transition moves the conversation from a technical problem to a strategic business opportunity. The goal here is to convince the investor that Modulr isn't just a cost-saver, but a revenue-enabler.
Slide 5: Legacy vs. Modern Infrastructure
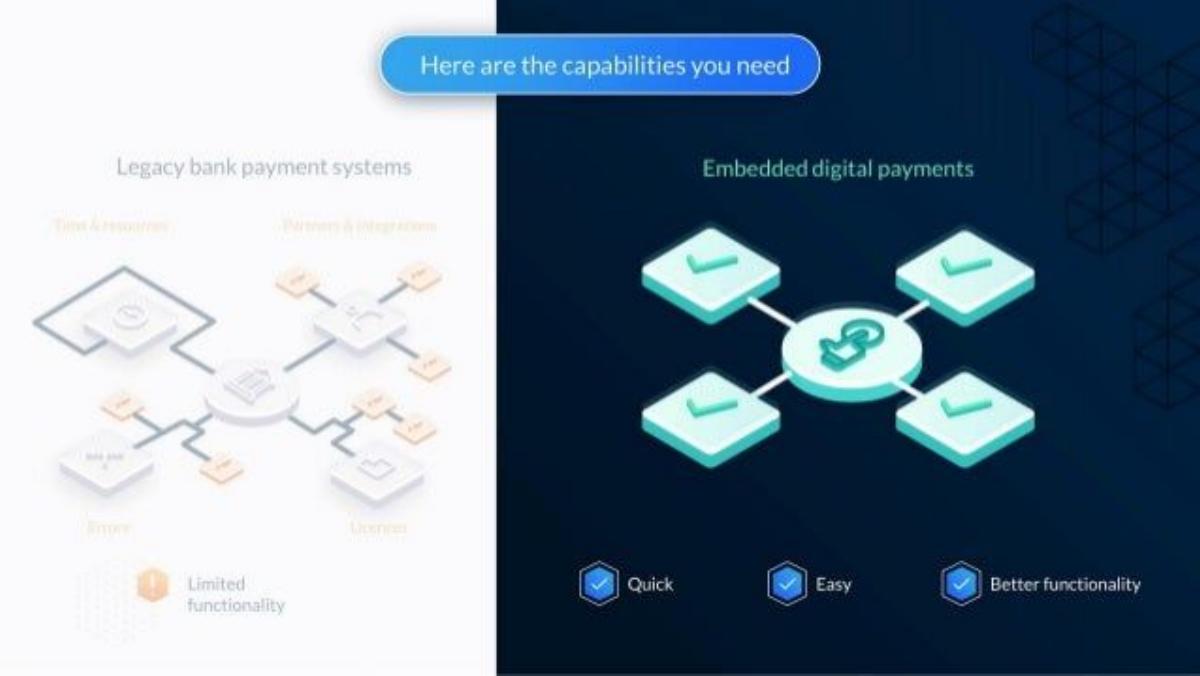
This slide uses a side-by-side comparison. On the left, "Legacy bank payment systems" are shown as a tangled web of errors, limited functionality, and licensing hurdles. On the right, "Embedded digital payments" are depicted as a clean, modular, and interconnected system. The keywords here are "Quick," "Easy," and "Better functionality." It is a classic 'before and after' visualization designed to make the legacy way look indefensible.
Slide 6: Defining the FinOps Hub
This is the most critical slide in the deck for positioning. Modulr introduces the term "modern FinOps hub." They list their core capabilities: Accounts, A2A Payments, Card issuing, Direct debit, and Open banking. Crucially, the right side of the slide features a large 'X' over "E-commerce payment acceptance" and "Physical PoS payments." They explicitly state: "We don't compete with PayPal, Worldpay, Adyen, Square, Klarna..." By doing this, they exit a crowded, price-sensitive red ocean and define their own blue ocean in B2B financial operations infrastructure. They also mention that revenue is driven by "recurring transaction revenue with high net retention rates."
Slide 7: Quantifying Outcomes
Slide 7 moves from abstract concepts to concrete business results. They list "Example Outcomes" such as "Lower call centre volumes," "Salaries no longer paid into wrong accounts," and "Stickier customers." The most impactful metric on this slide is the speed to market: "Faster Payments go-live 8 weeks vs. 1 year." This 6x improvement in deployment time is a compelling reason for any enterprise to switch providers.
Slide 8: The Regulatory Moat
In FinTech, regulation is often seen as a hurdle. Modulr frames it as a competitive advantage. Slide 8 claims that "regulatory excellence" allows them to win enterprise customers. They highlight their direct connection to the Bank of England and their involvement in various regulatory bodies like the NCA (National Crime Agency) and the Fraud Working Group . This slide is designed to de-risk the investment by showing that Modulr is a deeply integrated, compliant, and permanent fixture of the UK financial landscape.
Slide 9: The Growth Inflection Point
The traction slide shows a bar chart of "Annualised Transaction Volume (m)" from Q3 2016 to Q4 2021. The growth curve is classic 'hockey stick' shape, with a notable acceleration starting in 2019. The headline metric is "+105% year-on-year growth in annualised transaction revenue." This slide proves that the 'FinOps hub' concept has found massive market fit and is scaling rapidly.
Slide 10: Market Sizing (TAM/SAM)
The final content slide uses a concentric circle diagram to show market opportunity. They cite a "$2,122bn Global TAM" based on BCG Global Payments 2021 data. They then narrow this down to a "$307bn European TAM" and finally a "~$50bn European SAM (2025)." By providing a specific SAM for their target verticals in the UK and Europe, they demonstrate a realistic and data-driven understanding of their immediate growth ceiling.
What Modulr Does Well
The deck excels at strategic exclusion . By explicitly naming the companies they do not compete with (Adyen, Stripe, PayPal), they prevent investors from benchmarking them against lower-margin payment processors. This allows them to justify a higher valuation based on their role as a 'hub' rather than a 'utility.' Furthermore, the emphasis on regulatory status as a 'moat' is a sophisticated way to handle the compliance-heavy nature of FinTech, turning a potential liability into a core asset.
What is Missing from the Deck
The most glaring omission is a Team Slide . While the company was well-established by 2022, a Series A deck typically highlights the pedigree of the founders and key hires. There is also no Unit Economics slide; while they mention high net retention, they do not provide specific figures for Customer Acquisition Cost (CAC) or Lifetime Value (LTV). Finally, the "Ask" is missing from the slides. While we know from catalogue facts that they raised $108M, the deck itself does not specify how much they were seeking or how they intended to deploy the capital (e.g., geographic expansion vs. product R&D).
Founder's Takeaway: Copy the Positioning
Founders in crowded markets should study Slide 6. If you are entering a space with giants, do not try to be 'a better version' of the leader. Instead, define a new category that makes the leader irrelevant to your specific target audience. Modulr didn't try to be a better PayPal; they became a 'FinOps hub.' This shift in language changes the entire investor conversation from 'how will you beat the incumbent?' to 'how fast can you own this new category?'
Frequently asked questions
- Why did Modulr omit a team slide in their Series A deck?
- At the Series A stage, especially for a company raising $108M, the team is often already well-known to lead investors or has been vetted through previous rounds. Modulr likely chose to focus the limited real estate of an 11-slide deck on their massive transaction growth and regulatory moats, which are more critical for infrastructure-level FinTech plays where reliability and scale are the primary concerns.
- What is a 'FinOps hub' and why did Modulr use this term?
- Modulr coined 'FinOps hub' to differentiate itself from 'PayFacs' or simple gateways. By slide 6, they explain this includes accounts, A2A payments, card issuing, and open banking. This positioning helps them move up the value chain, targeting enterprises that need to build complex money flows rather than just 'accepting payments' at a checkout counter.
- How does Modulr use regulatory compliance as a selling point?
- On slide 8, Modulr argues that 'regulatory excellence' is the only way to win enterprise customers. They highlight memberships in the NCA, UK Finance, and the Emerging Payments Association. By showing a direct connection to the Bank of England, they position themselves as a secure, bank-grade alternative to legacy systems that is still agile enough for modern FinTechs.
- Is the market size on slide 10 realistic?
- Modulr uses a $2.1 trillion Global TAM, which is a standard figure for total payment revenues. However, they provide credibility by narrowing this down to a $50 billion European SAM (Serviceable Available Market) by 2025. This narrowing shows investors they have a focused, achievable path to capturing a specific, high-value segment of the broader market.
- What metrics are most prominent in this deck?
- The most prominent metric is the 105% year-on-year growth in annualised transaction revenue shown on slide 9. They also highlight 'high net retention rates' on slide 6 and a specific efficiency metric on slide 7: reducing the time to go live with payments from 1 year (legacy) to just 8 weeks (Modulr).