Teranga Gold Corporation presented this deck in April 2017 to showcase its transition from a single-asset operator in Senegal to a multi-jurisdictional West African gold producer. The presentation is characterized by extreme data density, particularly regarding mineral reserves and operating costs. It highlights the acquisition of Gryphon Minerals as a key growth driver and provides a clear 2017 outlook of 205K-225K ounces of gold production. While the deck lacks a traditional 'team' slide in this selection, it compensates with rigorous technical reporting, including a full 'Life of Mine' cos…
Key takeaways
- The company achieved record production and unit costs in 2016, as stated on slide 5.
- Teranga manages a 13.5-year mine life at Sabodala with a base case production profile exceeding 200Koz annually through 2024 (slide 9).
- The 2017 exploration budget is set between $12 million and $15 million, distributed across Burkina Faso, Senegal, and Côte d’Ivoire (slide 13).
- The Golden Hill project in Burkina Faso is a joint venture where Teranga holds 51% with the ability to earn 80% (slide 17).
- Financial stability is emphasized by a $95 million cash balance as of December 31, 2016 (slide 21).
- Mineral reserves are meticulously detailed, showing 2.63 million ounces of gold including stockpiles as of late 2015 (slide 29).
- Operating costs are projected out to 2029, with a Life of Mine (LOM) All-In Sustaining Cash Cost of $887 per ounce (slide 33).
Introduction and 2016 Retrospective
Slide 1: Title Slide
The presentation opens with a high-resolution image of heavy mining machinery tracks against a rocky terrain, establishing the industrial nature of the business. The branding is clear: Teranga Gold Corporation, with a lion head logo. The presentation is dated April 3-6, 2017, coinciding with the European Gold Forum.
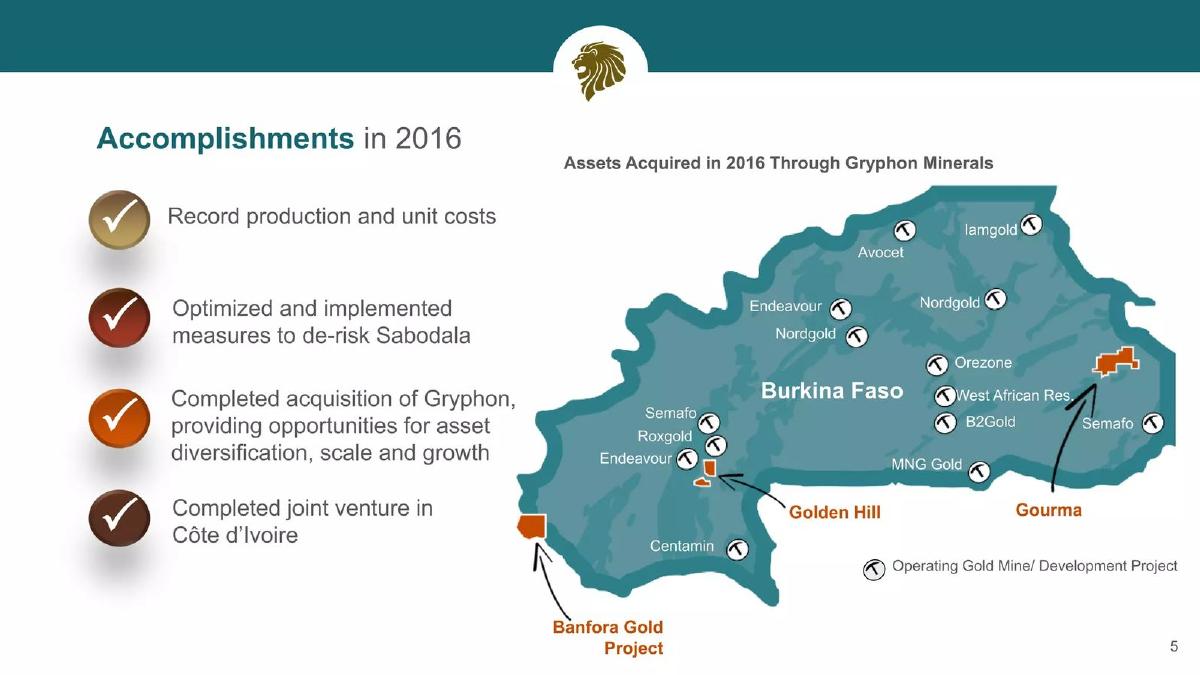
Slide 5: Accomplishments in 2016
This slide uses a checklist format to highlight four key milestones from the previous year. First, it claims record production and unit costs. Second, it mentions the optimization and de-risking of the Sabodala asset. Third, it highlights the acquisition of Gryphon Minerals, which provided asset diversification and scale. Finally, it notes the completion of a joint venture in Côte d’Ivoire. To the right, a map of Burkina Faso shows the location of newly acquired assets (Banfora, Golden Hill, Gourma) relative to competitors like Endeavour, Nordgold, and IAMGOLD. This map is crucial for showing 'nearology'—the proximity to other successful mines.
Core Asset Analysis: Sabodala
Slide 9: Sabodala Production Profile
This slide focuses on the flagship Senegal asset. It lists 2.6 million ounces in 2P (Proven and Probable) reserves and a 13.5-year mine life. A bar chart illustrates annual production from 2012 to 2029. The chart shows a steady 'base case' of over 200,000 ounces (Koz) per year through 2024. The slide also identifies specific growth opportunities: increasing material movement at the Niakafiri deposit and new discoveries on the regional land package. The 2017 outlook is explicitly stated as 205K-225Koz.
Exploration Strategy and Regional Footprint
Slide 13: 2017 Exploration Budget
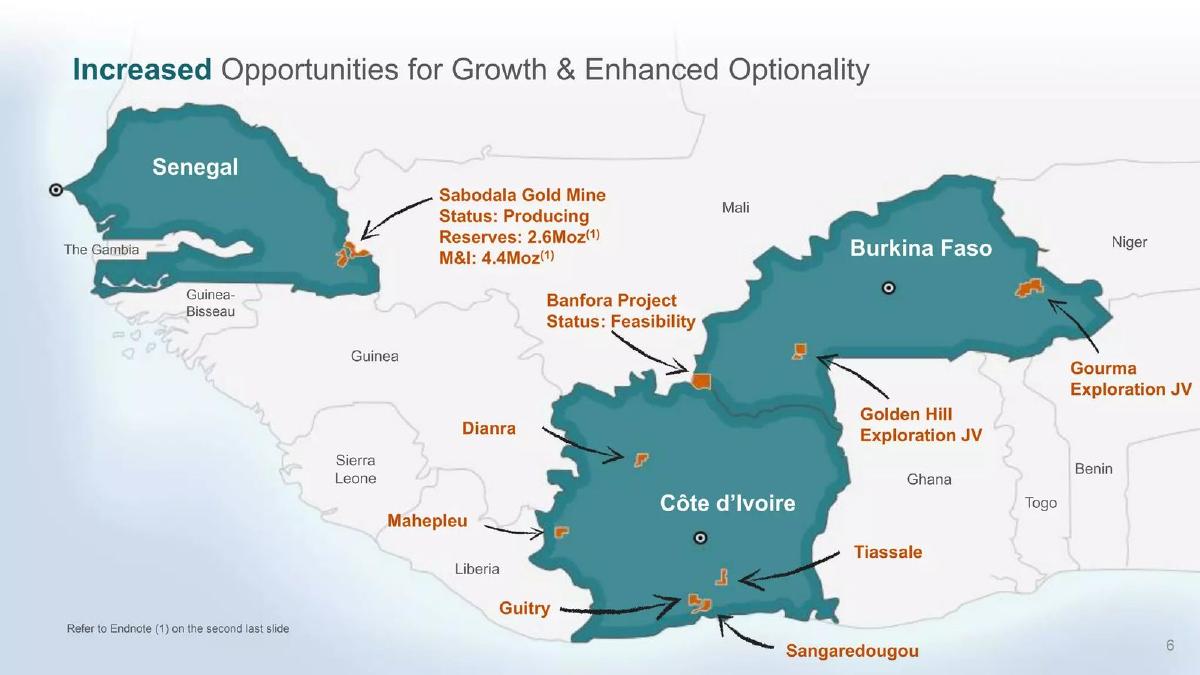
Teranga outlines a $12 million to $15 million exploration budget for 2017. A donut chart breaks this down by country: Burkina Faso receives the largest share, followed by Senegal and Côte d’Ivoire. The slide includes maps for each country, pinpointing specific projects like Sabodala (Senegal), Golden Hill and Banfora (Burkina Faso), and Guitry and Dianra (Côte d’Ivoire). The budget is further sub-divided: for example, Burkina Faso's $12M-$15M includes $3M-$4M for Banfora and $3M for Golden Hill.
Slide 17: Advancing Exploration at Golden Hill
This slide provides a deep dive into the Golden Hill project in Burkina Faso. It emphasizes the project's location on the Houndé belt, near high-value properties owned by Semafo, Roxgold, and Endeavour. The slide notes that 10 prospects have been prioritized for advanced work in 2017. Crucially, it details the Joint Venture structure: Teranga owns 51% but is 'earning 80%' through a partnership with Boss Resources (ASX:BOE). A detailed geological map shows the 'Boni Shear Zone' and the specific permit areas.
Financial Position and Downside Protection
Slide 21: Protecting the Downside
This is the company's 'stability' slide. It uses three pillars to argue for investment safety: a long-life cash-generating asset in Senegal, a 'strong' balance sheet, and a specific cash position of $95 million as of December 31, 2016. The use of simple icons (mine cars, a document, and a piggy bank) helps break up the data-heavy nature of the rest of the deck.
Technical Appendices and Cost Modeling
Slide 25: Appendices Divider
A simple transition slide indicating the start of the technical data section.
Slide 29: Mineral Reserves Summary
This is a highly technical table showing the Open Pit and Underground Mineral Reserves as of December 31, 2015. It breaks down 15 different deposits (such as Sabodala, Gora, and Masato) into Proven and Probable categories. The table provides Tonnes (Mt), Grade (g/t), and Gold (Moz) for each. The total Proven and Probable reserves are listed at 44.07 million tonnes at a grade of 1.59 g/t, totaling 2.25 million ounces. When stockpiles are included, the total rises to 2.63 million ounces at a grade of 1.38 g/t.
Slide 33: Life of Mine (LOM) Operating Costs
This is perhaps the most important slide for financial analysts. It provides a year-by-year projection of costs from 2016 through 2029. It covers mining, processing, G&A, refining, and royalties. The 'All-In Sustaining Cash Costs' (AISC) are the headline figure, showing a LOM average of $887 per ounce. The table also includes key assumptions: a gold price of $1,200/oz and specific fuel prices. This level of forward-looking financial detail is rare in early-stage decks but standard for producing miners.
What Teranga Gold Corporation Does Well
The deck excels at technical transparency. In the mining industry, investors are wary of 'promotional' decks that lack hard data. Teranga avoids this by providing full reserve tables (Slide 29) and comprehensive Life of Mine cost models (Slide 33). By showing their costs out to 2029, they demonstrate a long-term operational vision and a deep understanding of their asset's economics.
The use of 'nearology' on slides 5 and 17 is also a strong tactical move. By mapping their permits directly next to established, high-grade mines owned by multi-billion dollar companies, they borrow credibility and suggest that their land is geologically predisposed to success.
What is Missing from the Deck
The most notable omission in this selection of slides is a dedicated 'Management and Board' slide. In mining, the 'jockey' is often as important as the 'horse,' and investors want to see a team with a track record of building and exiting mines in West Africa. While this may exist in the full 36-slide deck, its absence in the core presentation leaves a gap in the narrative.
Additionally, there is no explicit 'Ask' or 'Use of Proceeds' slide. While this is an 'Investor Presentation' likely intended for public market investors rather than a private venture round, a slide detailing upcoming catalysts or how the $95M cash balance will be deployed over the next 18 months would strengthen the call to action.
Founder Takeaways: What to Copy
Granular Cost Modeling: If you are in a capital-intensive industry (hardware, energy, mining), providing a multi-year cost projection like Slide 33 builds immense trust with sophisticated investors. · Visualizing the Ecosystem: The maps on slides 5 and 17 do more than show location; they show competitive positioning. Founders should use maps or ecosystem diagrams to show they are operating in a 'high-rent district' of innovation or resources. · Clear Benchmarking: Slide 5's 'Accomplishments' checklist is an excellent way to start a presentation. It tells the investor immediately that the team does what they say they are going to do. · Conservative Assumptions: Slide 33 lists the gold price assumption ($1,200) and exchange rates. Always state your assumptions clearly so investors can stress-test your model.
Frequently asked questions
- What is the primary geographic focus of Teranga Gold?
- Teranga Gold is focused exclusively on West Africa. According to slides 5 and 13, their operations and exploration projects are located in Senegal (Sabodala mine), Burkina Faso (Banfora, Golden Hill, and Gourma projects), and Côte d’Ivoire (various joint ventures). This regional concentration allows them to leverage local expertise and infrastructure.
- How does the company plan to grow its production?
- Growth is driven by a two-pronged strategy: optimizing existing assets and aggressive exploration. Slide 9 highlights opportunities to increase production at Sabodala through resource conversion at the Niakafiri deposit. Simultaneously, slide 13 shows a $12M-$15M exploration budget aimed at developing new discoveries in highly prospective belts like the Houndé belt in Burkina Faso.
- What are the key financial metrics for the Sabodala mine?
- The Sabodala mine is the company's flagship cash-generating asset. Slide 9 notes a 13.5-year mine life with positive cash flow in almost every year. Slide 33 provides the granular financials, showing a total Life of Mine operating cost of $1.622 billion and an All-In Sustaining Cash Cost (AISC) of $887 per ounce.
- What is the status of the Golden Hill project?
- Golden Hill is a high-priority exploration project in Burkina Faso. Slide 17 describes it as being situated near other high-grade properties on the Houndé belt. Teranga operates this as a joint venture with Boss Resources, currently holding a 51% interest with a path to earning 80% through continued investment and development.
- How transparent is the company regarding its mineral reserves?
- The company provides a high level of transparency. Slide 29 contains a comprehensive 'Open Pit & Underground Mineral Reserves Summary' that breaks down proven and probable reserves across 15 different deposits and stockpiles. It lists tonnage, grade (g/t), and contained gold (Moz), totaling 2.63 million ounces.