EventXtra presents a compelling narrative for its one-stop event management platform by leading with aggressive growth metrics and visual proof of problem-solving. The deck highlights a 36% Month-over-Month growth rate (Slide 2) and uses a powerful case study from Web Summit to demonstrate how they reduced attendee waiting times from 15 minutes to just 15 seconds (Slides 5-8). While the deck is exceptionally strong on social proof—listing logos like Apple, Facebook, and Alibaba (Slide 13)—it notably lacks a team slide, detailed unit economics, and a specific financial 'ask.' Despite these omi…
Key takeaways
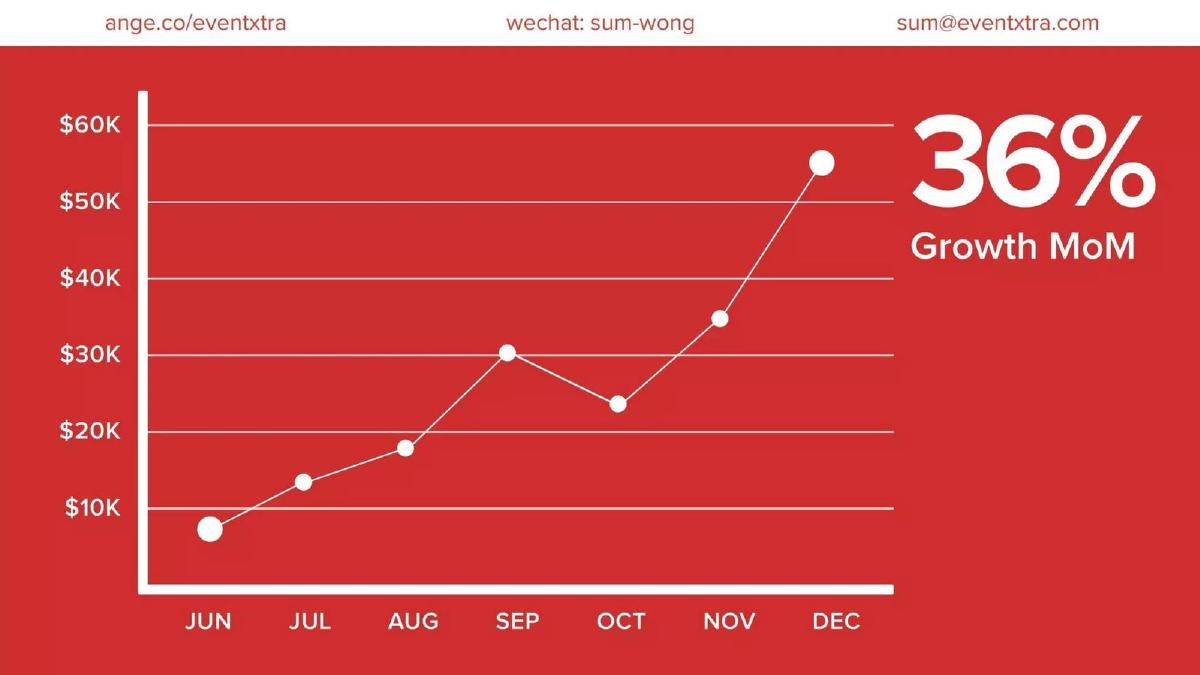
- The company leads with a high-growth signal, claiming 36% Month-over-Month growth between June and December (Slide 2).
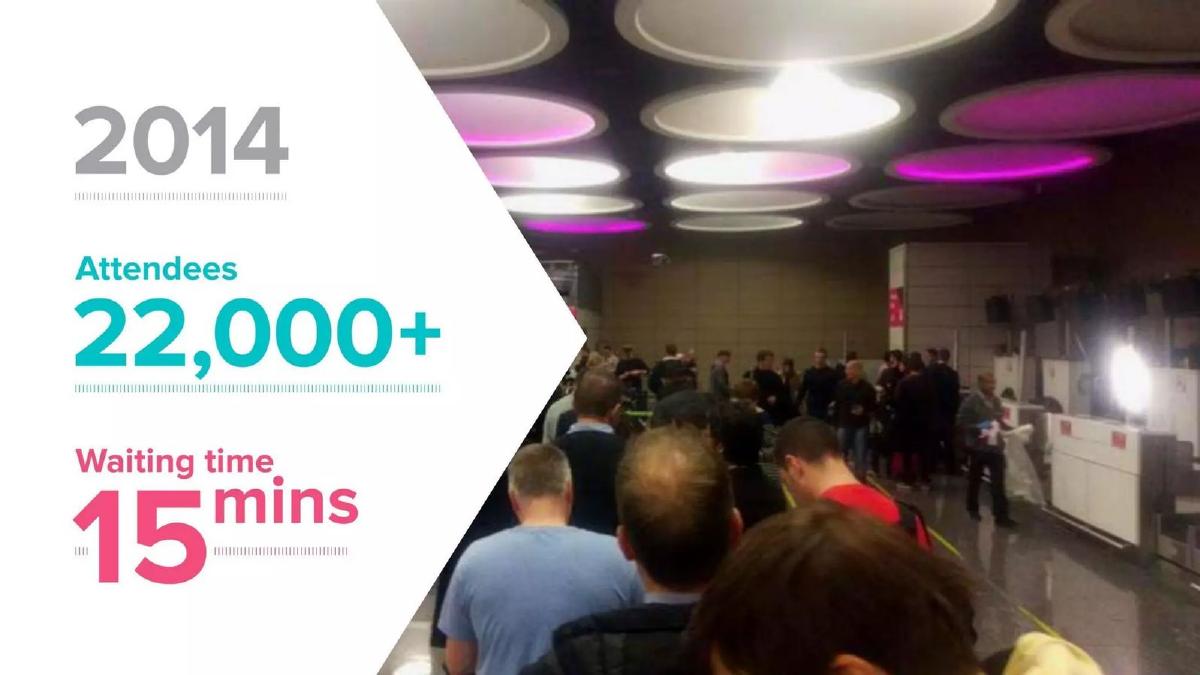
- A visual case study of Web Summit effectively demonstrates the product's value proposition by showing a reduction in wait times from 15 minutes to 15 seconds (Slides 5-8).
- The platform is positioned as a 'One-Stop' solution covering Pre-Event, In-Event, and Post-Event workflows (Slide 9).
- Market sizing is clearly defined with 5 million annual corporate events and a $5.4B global event software market (Slides 10-11).
- The deck identifies a massive 'analog-to-digital' tailwind, stating that 75% of the market still uses manual processes (Slide 12).
- Social proof is a core pillar of the pitch, featuring logos from major tech firms like Apple, Facebook, Yahoo, and Alibaba (Slide 13).
- Scale is quantified through cumulative totals: 100+ companies, 1,000+ events, and 500,000+ attendees (Slides 14-16).
- The deck completely omits a team slide, leaving the background of the founders to the investor's imagination.
Executive Summary: The Power of Visual Proof
The EventXtra pitch deck is a lean, high-impact presentation that prioritizes traction and visual evidence over dense text. Published in 2022 but referencing data from 2014 and 2015, the deck follows a classic narrative arc: show the growth, show the pain, show the solution, and then prove it works with massive logos. It is a 'traction-first' deck, designed to hook an investor within the first three slides by proving the product has already found market fit.
Slide 1: Title and Value Proposition
The deck opens with a clean title slide featuring the EventXtra logo and a clear sub-headline: "We Make Corporate Events Simple and Impactful." The background image shows a busy event registration desk, immediately grounding the company in its specific niche. It is a standard, professional opening that avoids jargon.
Slide 2: The Traction Hook
Instead of starting with a problem, EventXtra leads with a growth chart. The slide shows a revenue graph from June to December, with a final data point exceeding $50K and a prominent callout of "36% Growth MoM." This is a strategic choice; by starting with growth, the founders pre-emptively answer the question of whether people want this product. The slide also includes contact info (AngelList, WeChat, and email) at the top, which persists through much of the deck.
Slides 3-8: The Web Summit Case Study
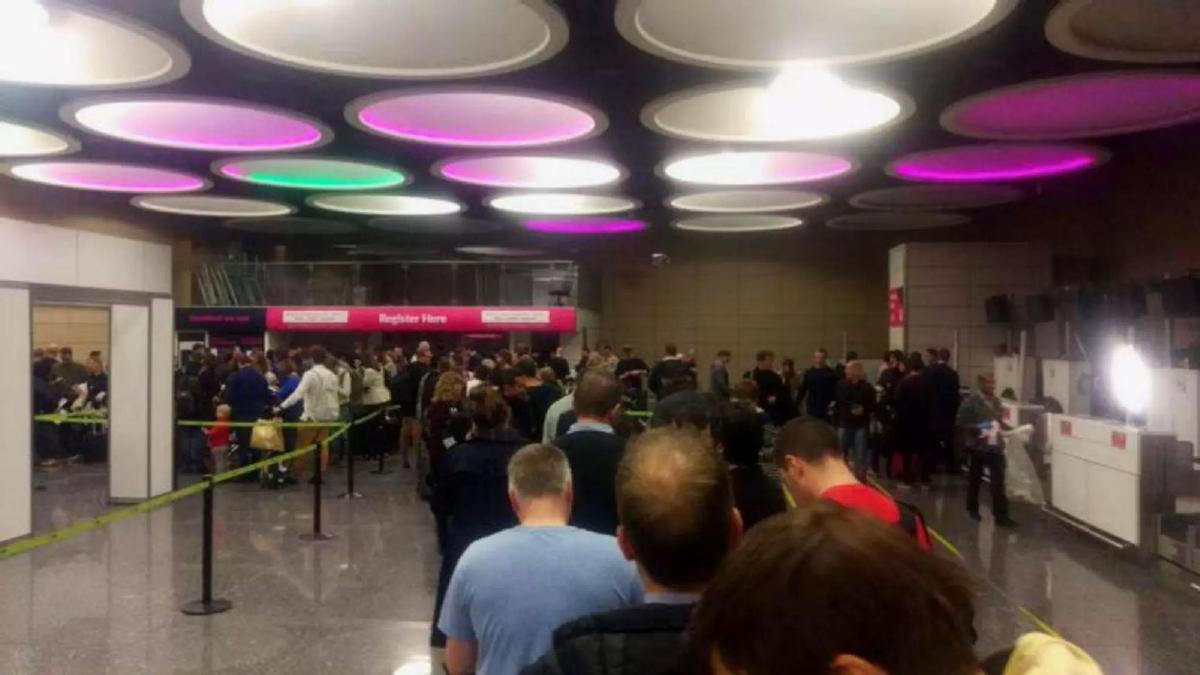
This sequence is the heart of the deck. Slide 3 identifies Web Summit as the "Biggest Tech Event in Europe." Slide 4 shows a photo of a crowded, congested registration hall. Slide 5 adds data to the photo: "2014: Attendees 22,000+, Waiting time 15 mins."
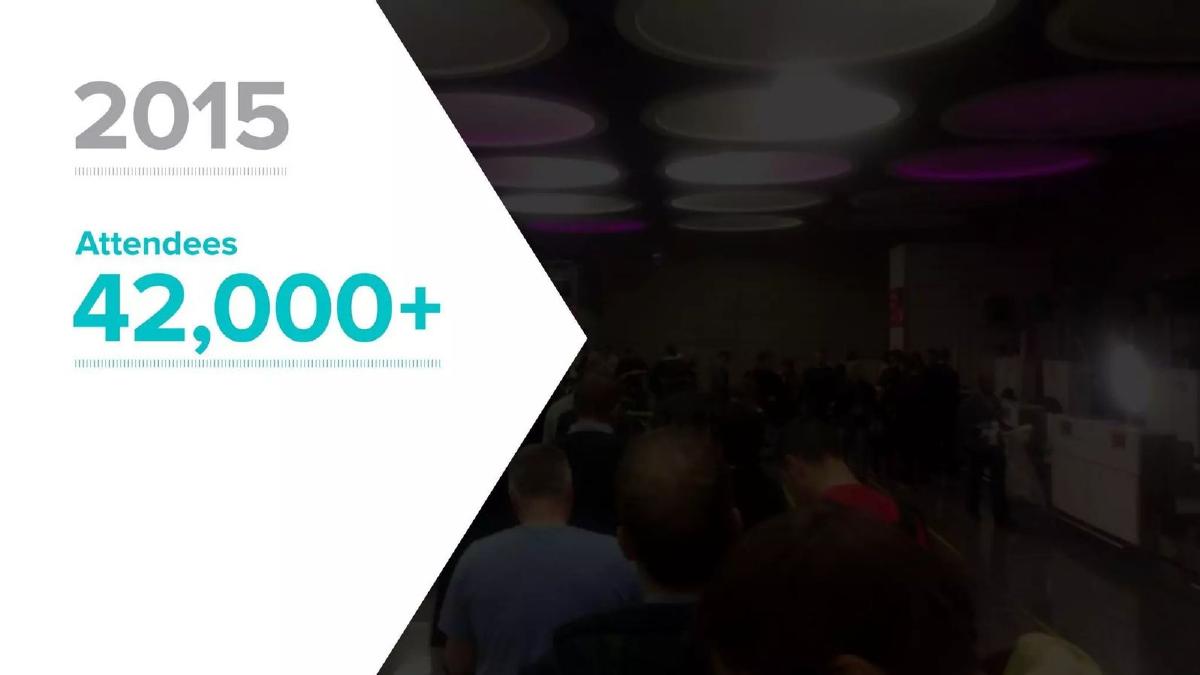
Slide 6 shows the growth of the event to 42,000+ attendees in 2015. Slide 7 shows a much more organized, empty-looking queue area. Slide 8 delivers the punchline: "After using EventXtra, Waiting time 15 secs." This is a powerful use of 'before and after' marketing. It quantifies the efficiency gain (a 60x improvement) and uses a high-profile event to validate the software's capability to handle scale.
Slide 9: The Product Ecosystem
Slide 9 defines the "One-Stop Event Management Platform." It shows the hardware (a badge printer) and the software interface across desktop, tablet, and mobile. The slide uses a flow chart to show the product covers the Pre-Event, In-Event, and Post-Event stages. This tells the investor that the company isn't just a 'check-in app' but a comprehensive workflow tool.
Slides 10-12: Market Size and The 'Manual' Opportunity
Slide 10 states there are 5M Corporate Events Worldwide, Annual. Slide 11 values the Global Event Software Market at $5.4B. Slide 12 is the most insightful of the three, using a pie chart to show that while the market is large, 75% are still using manual processes. This identifies the true competitor: the status quo. It suggests a massive 'greenfield' opportunity for digitization.
Slide 13: The Logo Wall
This slide is a dense collection of high-tier social proof. It features logos for Apple, Facebook, Yahoo, Alibaba Group, Web Summit, RISE, Atlassian, Twilio, The International New York Times, Bloomberg, McKinsey & Company, Deloitte, The Economist, MTR, Global Entrepreneurship Week, and UK Trade & Investment. For a B2B SaaS company, this slide is the ultimate de-risking mechanism. If these organizations trust the platform, the product is enterprise-ready.
Slides 14-16: Cumulative Scale
These slides build a sense of momentum. Slide 14 claims 100+ Companies , Slide 15 adds 1000+ Events , and Slide 16 concludes with 500,000+ Attendees. By breaking these metrics into three separate slides, the deck forces the investor to dwell on the scale of the company's reach.
Slide 17: Closing and Contact
The deck ends by repeating the value proposition and providing contact details for Sum Wong . It is a simple, circular conclusion that returns to the core message.
What EventXtra Does Well
Visual Storytelling: The use of the Web Summit photos to demonstrate the 15-minute vs. 15-second wait time is brilliant. It makes a technical software benefit feel visceral and obvious.
Traction First: By putting the 36% MoM growth on Slide 2, the deck immediately establishes credibility. It signals that this is a 'hot' deal before the investor even knows what the product does.
Social Proof: The logo wall on Slide 13 is exceptionally strong. Including names like Apple and McKinsey suggests that the product can meet the security and reliability standards of the world's most demanding organizations.
What is Missing from the Deck
The Team Slide: This is the most glaring omission. Investors fund people, not just products. There is no information about the founders' backgrounds, technical expertise, or why they are the right people to win this market.
The Ask: The deck does not state how much money the company is raising, the valuation, or what the funds will be used for (e.g., hiring, marketing, R&D). This makes it feel more like a company profile than a fundraising pitch.
Business Model and Unit Economics: There is no mention of how EventXtra makes money. Are they a SaaS model? Do they charge per attendee? What is their churn rate? Without these details, an investor cannot assess the quality of the revenue shown on Slide 2.
Competition: The deck ignores other software players (like Cvent or Eventbrite). While they claim 75% of the market is manual, they still need to explain why they win against other digital incumbents.
Founder's Playbook: What to Copy
The 'Before and After' Slide: If your product solves a physical or logistical bottleneck, use photos. Showing a crowded room vs. an empty room is more effective than any bar chart.
Persisting Contact Info: Putting the email and AngelList link at the top of every slide ensures that if a slide is screenshotted or shared, the way to reach the founder is never lost.
Quantified Value Prop: Don't just say you are 'faster.' Say you reduced a specific metric from X to Y for a recognizable client. EventXtra's '15 mins to 15 secs' is the most memorable part of the deck.
Frequently asked questions
- What is the primary problem EventXtra is solving?
- EventXtra targets the inefficiency of manual event management. Through a visual comparison on slides 5 through 8, they demonstrate that traditional check-in processes at large-scale events like Web Summit result in 15-minute wait times. Their software reduces this to 15 seconds, addressing the 'friction' in the attendee experience and the operational burden on organizers.
- How does EventXtra define its market opportunity?
- The deck defines the market in three layers: the volume of activity (5 million corporate events annually), the current spend ($5.4B global event software market), and the untapped potential. Crucially, slide 12 notes that 75% of the market is still using manual processes, suggesting the company's primary competition is 'pen and paper' rather than other software vendors.
- What is the product's scope according to the deck?
- Slide 9 describes EventXtra as a 'One-Stop Event Management Platform.' It visualizes a suite that includes hardware (a badge printer) and software (mobile and desktop apps) that covers the entire event lifecycle: Pre-Event (registration), In-Event (check-in and engagement), and Post-Event (analytics and reporting).
- Does the deck provide enough financial information for an investor?
- No. While slide 2 shows a revenue graph peaking above $50k with 36% MoM growth, the deck lacks critical financial depth. There are no details on customer acquisition costs (CAC), lifetime value (LTV), churn rates, or even a basic business model explaining how they charge (per event vs. per attendee vs. SaaS subscription).
- Why is the omission of a team slide significant?
- In early-stage venture capital, the team is often considered the most important factor. By omitting a team slide, EventXtra misses the chance to highlight technical expertise or industry experience. Investors are left to find this information via the contact details (Sum Wong) or external links provided on the slides.