Edtech Go-to-Market Slide Examples: 8 Real Pitch Decks
How education startups explain how they win learners, schools and companies: cost per user by channel, clients by source, sales team output.
Edtech Go-to-Market Slide: Show Where Learners Come From and What Each One Costs
Education startups sell to very different buyers: individual learners who sign up online, teachers and tutors, schools that buy for a year, and companies that train staff. Each buyer is won a different way and at a very different cost. Investors read an edtech go-to-market slide for which buyer the startup is chasing, which channels bring them in, and what each new learner or account costs compared with what it pays. This guide uses eight go-to-market slides from education startups, from a full cost table by channel to a slide that still shows its placeholder figures.
TL;DR
Show where learners or accounts come from and what each one costs, split by buyer. DataCamp's February 2017 table gives 49,200 new users at $1.69 each and 3,098 new subscribers at $26.82 each, with word of mouth bringing 30% of users at no cost and paid ads costing $109.63 per subscriber. eProf sets three buyer types side by side, from tutors at $49 a month and up to $100 to win, to enterprises paying $1,000+ a month at about $1,000 to win. Careerist splits 1,624 clients by source. Empowerly shows "XX%" placeholders, and Questo's title ends in a question mark.
Eight edtech go-to-market slides
Strongest first, warning examples last. Each example quotes the slide and notes what an investor can and cannot learn from it.
DataCamp go to market slide — slide 22
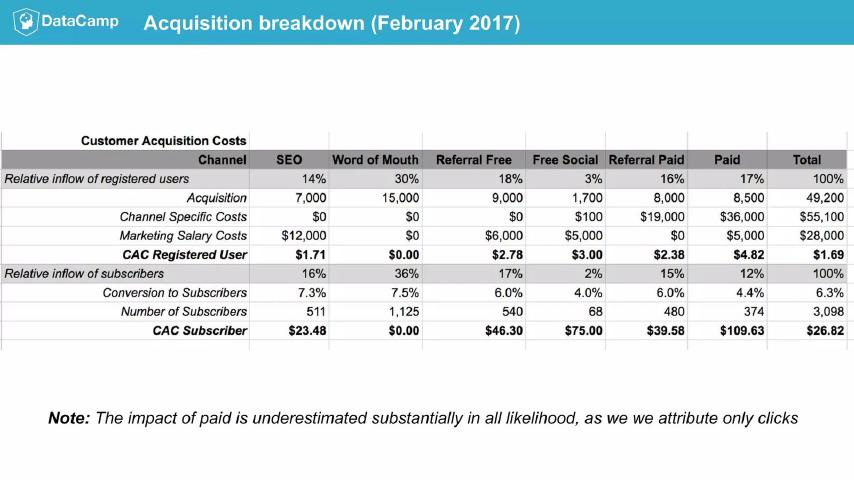
Online data science courses. Slide titled "Acquisition breakdown (February 2017)".
DataCamp deck, slide 22. Exact stored slide matched to this analysis.
Our analysis: Cost per user and per subscriber for every channel, including salaries.
Evidence and limitation: Company figures for one month; arithmetic checked.
What a founder can adapt: Add what a subscriber pays so cost can be compared with value.
Supporting analysis
What the deck claims: Six channels: SEO, Word of Mouth, Referral Free, Free Social, Referral Paid, Paid. "Acquisition" totals 49,200; "Channel Specific Costs" $55,100; "Marketing Salary Costs" $28,000; "CAC Registered User" $1.69 overall, $4.82 for paid, $0.00 for word of mouth. "Conversion to Subscribers" 6.3% overall; "Number of Subscribers" 3,098; "CAC Subscriber" $26.82 overall, $109.63 for paid. "Note: The impact of paid is underestimated substantially in all likelihood, as we attribute only clicks."
Presentation choice: It shows that cheap paid users become expensive paid subscribers.
When it does not fit: Reporting only cost per registered user when most users never pay.
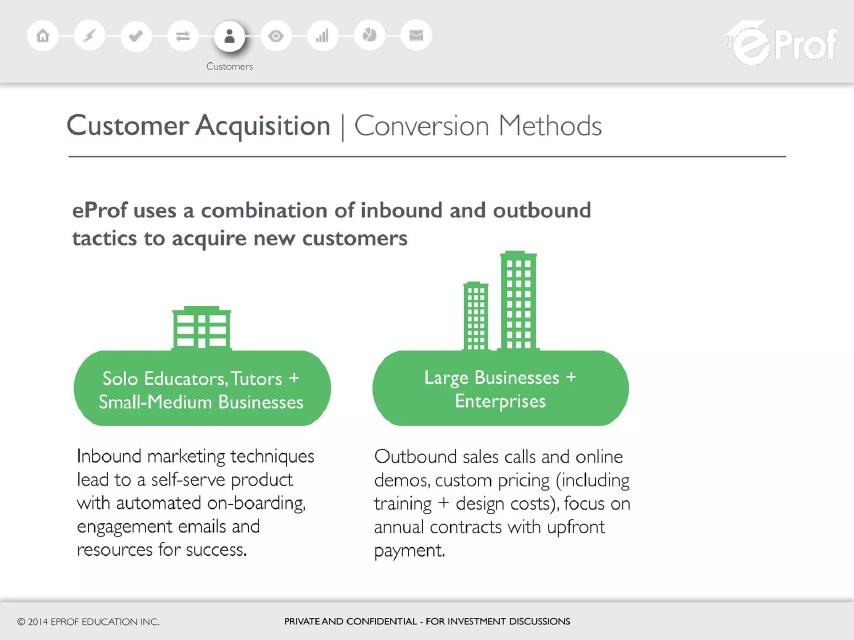
Platform for educators and businesses to sell online courses. Slides titled "Customer Acquisition | Conversion Methods" and "Sales Pipeline | Key Figures".
eProf deck, slide 13. Exact stored slide matched to this analysis.eProf deck, slide 14. Exact stored slide matched to this analysis.
Our analysis: Each buyer type with its size, price, sales effort and cost to win.
Evidence and limitation: Company figures and estimates.
What a founder can adapt: Split the 250 active accounts by segment.
Supporting analysis
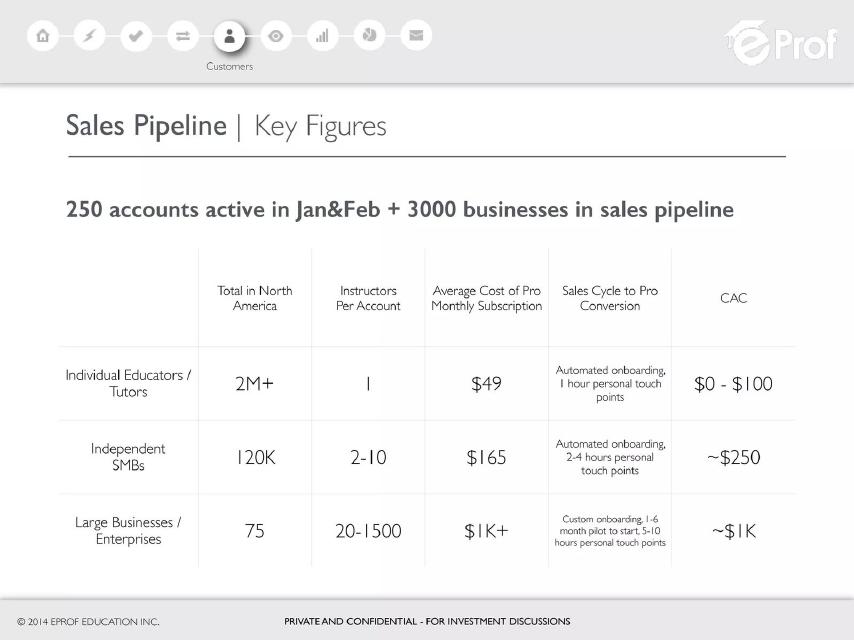
What the deck claims: "eProf uses a combination of inbound and outbound tactics to acquire new customers." "250 accounts active in Jan&Feb + 3000 businesses in sales pipeline." Individual educators/tutors: "2M+", $49 a month, "$0 - $100" CAC. Independent SMBs: "120K", 2–10 instructors, $165, "~$250". Large businesses/enterprises: "75", 20–1,500 instructors, "$1K+", "Custom onboarding, 1-6 month pilot to start, 5-10 hours personal touch points", "~$1K".
Presentation choice: Investors can see the economics of each segment on one slide.
When it does not fit: A pipeline figure with no conversion rate.
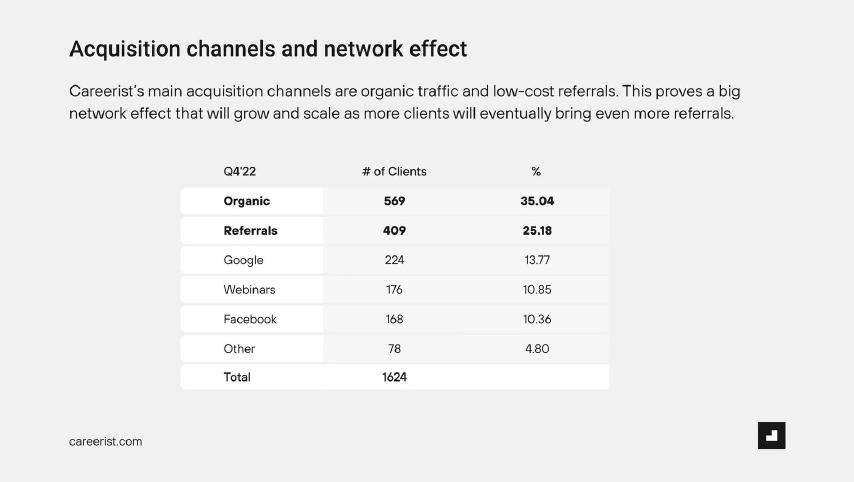
Career-change training. Slide titled "Acquisition channels and network effect".
Careerist deck, slide 9. Exact stored slide matched to this analysis.
Our analysis: A clear split of clients by source, with no costs.
Evidence and limitation: Company figures for one quarter; arithmetic checked.
What a founder can adapt: Add cost per client by channel and the referral share over several quarters.
Supporting analysis
What the deck claims: "Careerist's main acquisition channels are organic traffic and low-cost referrals. This proves a big network effect that will grow and scale as more clients will eventually bring even more referrals." Q4'22 clients: Organic 569 (35.04%), Referrals 409 (25.18%), Google 224 (13.77%), Webinars 176 (10.85%), Facebook 168 (10.36%), Other 78 (4.80%), Total 1,624.
Presentation choice: Most clients arriving without paid ads is a good sign.
When it does not fit: Claiming one quarter "proves" a network effect.
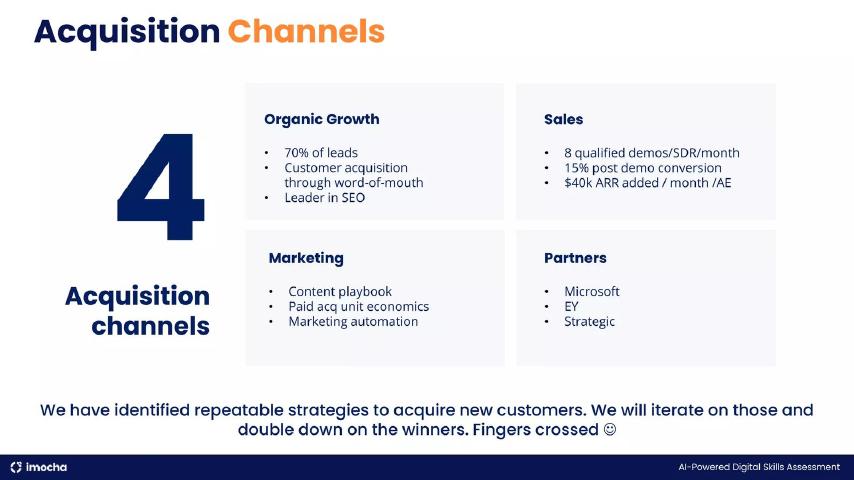
AI-powered skills assessment for employers. Slide titled "Acquisition Channels".
iMocha deck, slide 10. Exact stored slide matched to this analysis.
Our analysis: Sales team output that lets investors estimate the return on a hire.
Evidence and limitation: Company figures.
What a founder can adapt: Put figures in the marketing box and drop the closing joke.
Supporting analysis
What the deck claims: "Organic Growth: 70% of leads; Customer acquisition through word-of-mouth; Leader in SEO." "Sales: 8 qualified demos/SDR/month; 15% post demo conversion; $40k ARR added / month /AE." "Marketing: Content playbook; Paid acq unit economics; Marketing automation." "Partners: Microsoft; EY; Strategic." "We have identified repeatable strategies to acquire new customers. We will iterate on those and double down on the winners. Fingers crossed."
Presentation choice: Demos, conversion and revenue per salesperson are what institutional sales investors check.
When it does not fit: Promising "unit economics" without showing them.
Learning While Travelling go to market slide — slide 9
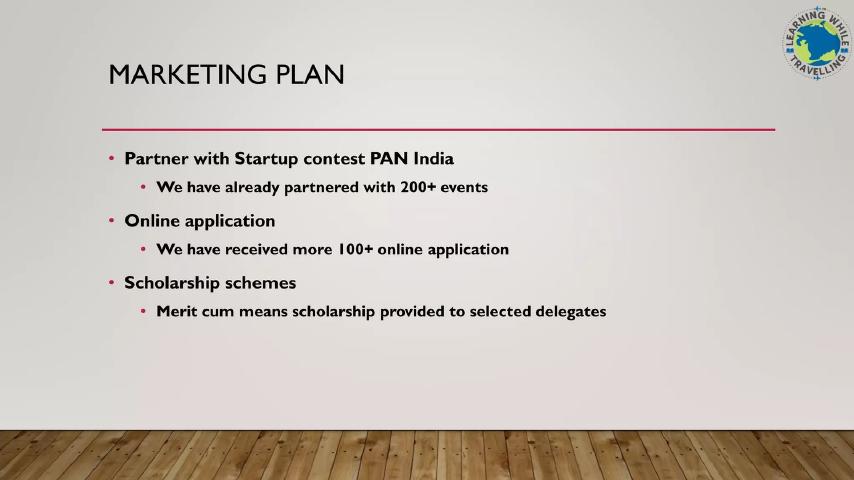
Learning programmes combined with travel, in India. Slide titled "Marketing Plan".
Learning While Travelling deck, slide 9. Exact stored slide matched to this analysis.
Our analysis: Partnerships and applications counted, with no conversion to paying participants.
Evidence and limitation: Company statements.
What a founder can adapt: Say how many applicants paid and what scholarships cost.
Supporting analysis
What the deck claims: "Partner with Startup contest PAN India: We have already partnered with 200+ events." "Online application: We have received more 100+ online application." "Scholarship schemes: Merit cum means scholarship provided to selected delegates."
Presentation choice: Counting partners and applicants is better than listing channels.
When it does not fit: Applications presented as if they were customers.
Whether each slide names its buyer, gives a cost, and shows results so far.
Example
Buyer
Cost given
Results so far
DataCamp
Individual learners
Per user and subscriber, by channel
49,200 users, 3,098 subscribers
eProf
Tutors, SMBs, enterprises
Per segment
250 active accounts
Careerist
Career changers
No
1,624 clients by source
iMocha
Employers
Revenue per salesperson
Demos and conversion
AlgoWork
Students
No
40 alpha sign-ups
Learning While Travelling
Students
No
100+ applications
Empowerly
Families
Placeholders
Placeholders
Questo
One school
No
No
Key Takeaways
Split the plan by buyer: learner, educator, school or company.
Give cost per user or account for each channel.
Compare cost with what each buyer pays.
Show sales team output if you sell to institutions.
Never send a slide with placeholders.
Build your edtech go-to-market slide
Answer these before you design the slide.
Buyers. Who pays: learners, educators, schools or companies? What does each pay?
Channels. For each buyer, which channels bring them and what does one cost?
Free vs paid. How many free users become paying users, and what is the cost per paying user?
Sales. If you sell to institutions, how many demos, what conversion and how long?
Copyable framework: [Buyer] pays [price]. [Channel] brings [share] at [cost] per user; [percent] become paying at [cost] per paying user. Institutions: [demos] demos a month, [percent] convert, [weeks] to close.
Illustrative example 1 — written by us
Before: We will grow through partnerships with schools, social media and word of mouth.
After: Parents pay $19 a month. Word of mouth brings 40% of sign-ups at $0; Instagram brings 35% at $6 each. 8% of sign-ups subscribe, at $31 per subscriber overall. Schools: 4 pilots, 2 converted, 10 weeks to close.
What improved: Our illustrative rewrite; all figures are invented for the example. It names the buyer, costs each channel, separates free from paying users and shows school sales.
What this guide adds
The general go-to-market guide covers any startup. Education differs because one product often has several buyers. A course platform might be paid for by a learner, a tutor, a school or an employer, and each pays a different price and needs a different kind of selling. Free users are also common in education, so the slide has to separate people who registered from people who pay. This guide shows how education startups present those two points.
How we read each slide
We read each stored slide image and quote the text on it. DataCamp, Careerist, iMocha and both eProf slides were read at full size; AlgoWork, Learning While Travelling, Empowerly and Questo were legible at low resolution. We checked the arithmetic on the DataCamp and Careerist tables. We have not checked any company's costs, partners or results, and we make no claim that any slide affected a fundraising outcome.
Separate free users from paying users
DataCamp's table is the clearest example in this guide. For each of six channels it gives the share of registered users, the number acquired, the channel cost, the marketing salary cost and the cost per registered user. It then repeats the exercise for subscribers: conversion rate, number of subscribers and cost per subscriber.
The two halves tell different stories. Paid ads bring 17% of registered users at $4.82 each, which looks affordable. But only 4.4% of those users subscribe, so each paid subscriber costs $109.63. Word of mouth brings 30% of users and 36% of subscribers at no cost. Across all channels, $83,100 of spend produced 49,200 users at $1.69 each and 3,098 subscribers at $26.82 each. The figures add up.
DataCamp also adds a note: "The impact of paid is underestimated substantially in all likelihood, as we attribute only clicks." Saying where your own measurement is weak makes the rest of the table more believable.
Split the plan by buyer
eProf, a platform for educators to sell online courses, uses two slides. The first explains the two approaches: "Inbound marketing techniques lead to a self-serve product with automated on-boarding" for solo educators, tutors and small businesses, and "Outbound sales calls and online demos, custom pricing (including training + design costs), focus on annual contracts with upfront payment" for large businesses and enterprises.
The second slide puts figures on it. Individual educators and tutors: 2M+ in North America, $49 a month, automated onboarding with 1 hour of personal contact, and $0 to $100 to win each one. Independent small businesses: 120K, 2 to 10 instructors, $165 a month, about $250 to win. Large businesses: 75, 20 to 1,500 instructors, $1K+ a month, a 1 to 6 month pilot, 5 to 10 hours of personal contact and about $1K to win. The headline adds "250 accounts active in Jan&Feb + 3000 businesses in sales pipeline".
That table answers most of an investor's questions at once: who buys, how many of them exist, what each pays, how long it takes and what it costs to win them. What it does not say is how the 250 active accounts split across the three groups.
Show where clients come from
Careerist, which trains people for new careers, splits 1,624 clients in the fourth quarter of 2022 by source: organic 569 (35%), referrals 409 (25%), Google 224 (14%), webinars 176 (11%), Facebook 168 (10%) and other 78 (5%). The figures add up, and having most clients come from organic traffic and referrals is a good sign.
But the slide goes further than its numbers: it says the split "proves a big network effect that will grow and scale". One quarter of data cannot prove growth. Showing the referral share rising across several quarters would. The slide also gives no cost for any channel, so investors cannot compare Google and Facebook with the free channels.
If you sell to institutions, show the sales team's output
iMocha sells skills assessments to companies. Its slide lists four channels. Organic growth brings "70% of leads". Sales gives three useful figures: "8 qualified demos/SDR/month", "15% post demo conversion" and "$40k ARR added / month /AE". Partners are Microsoft and EY. Those sales figures let investors estimate what a new salesperson adds and how quickly they pay for themselves.
The marketing box lists "Content playbook", "Paid acq unit economics" and "Marketing automation" without any figures, even though it promises unit economics. The closing line, "We will iterate on those and double down on the winners. Fingers crossed", undercuts the word "repeatable" in the same sentence.
Early-stage funnels and partnerships
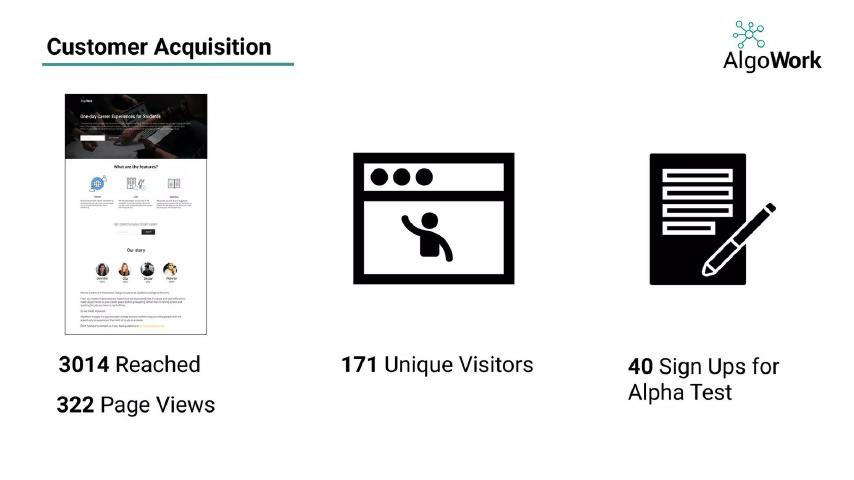
Startups without paying customers can still show a funnel. AlgoWork's slide gives its alpha test numbers: 3,014 reached, 322 page views, 171 unique visitors and 40 sign-ups. That is small, but it is real and it shows the steps. Learning While Travelling lists "Partner with Startup contest PAN India" ("We have already partnered with 200+ events"), "Online application" ("We have received more 100+ online application") and scholarships. Both would be stronger with dates and with how many sign-ups or applicants became paying customers.
Placeholders and question marks
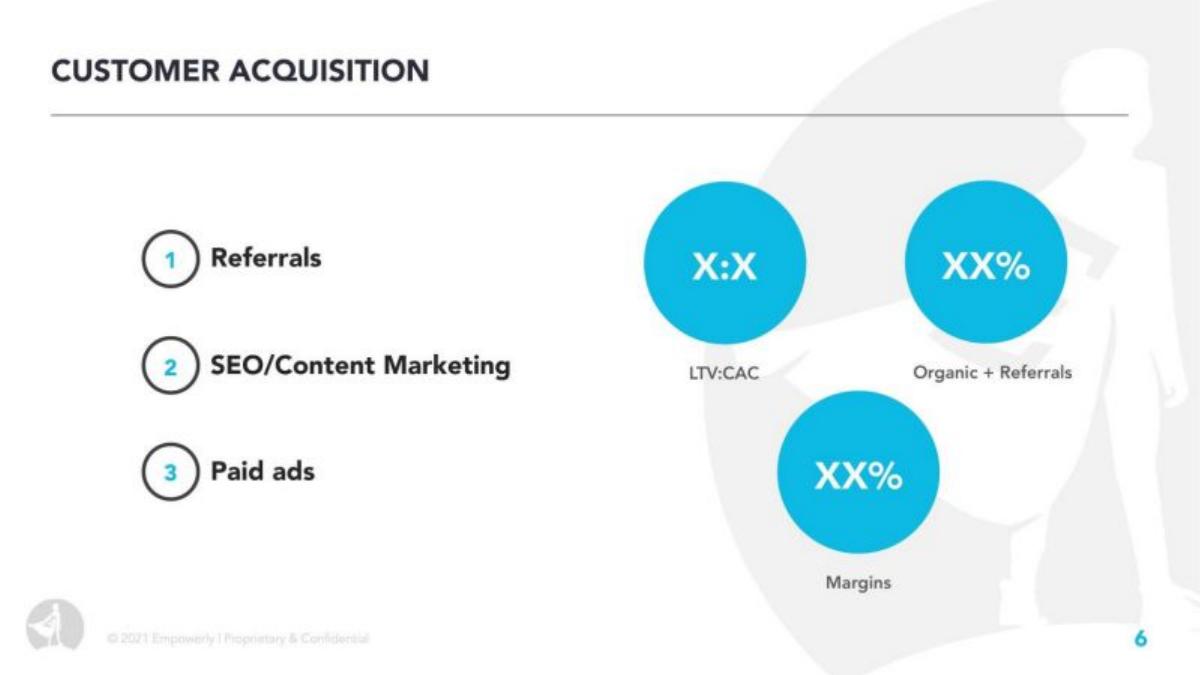
Empowerly, a college admissions counselling company, lists three channels (referrals, SEO and content marketing, and paid ads) beside three circles that read "X:X" for LTV:CAC, "XX%" for organic plus referrals, and "XX%" for margins. The figures were never filled in. An investor who sees this will assume the deck was not checked, or that the numbers are not good.
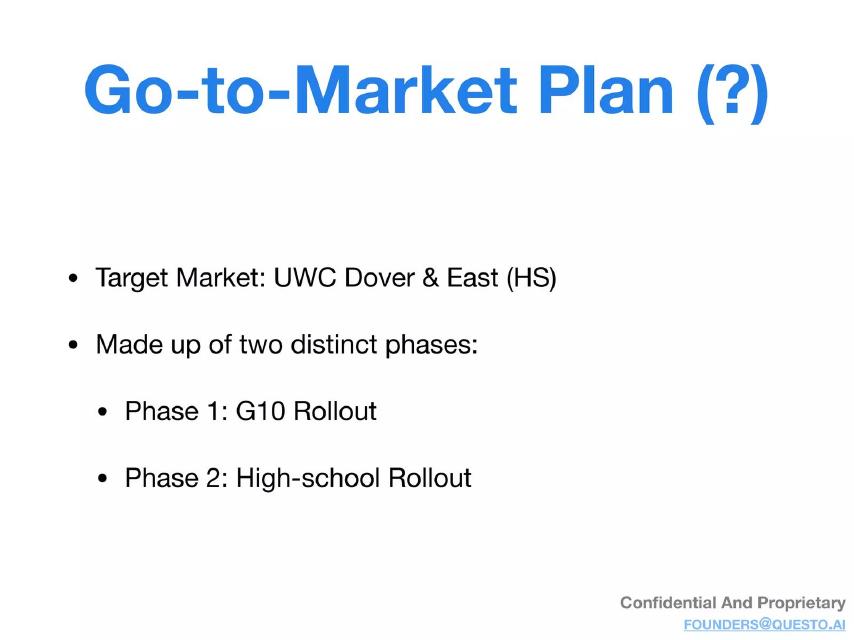
Questo's slide is titled "Go-to-Market Plan (?)" and lists a target market, "UWC Dover & East (HS)", with "Phase 1: G10 Rollout" and "Phase 2: High-school Rollout". Starting with one school is a sensible plan, but the question mark in the title tells investors the founders are unsure of it. Remove the question mark, and add how many students are in each phase and what the school pays.
What to put on an edtech go-to-market slide
Start by naming each buyer you sell to and what each pays. For each buyer, give the channels that reach them, the cost of winning one and how long it takes, as eProf does. If you have free users, report registered users and paying users separately, with the cost of each, as DataCamp does. If you sell to schools or companies, give your sales team's demos, conversion and revenue added per person, as iMocha does. Finally, check that every figure is filled in, and remove anything that signals doubt.
Common mistakes
One plan for every buyer. Split by learner, educator, school or company.
Free users as customers. Report paying users separately.
Cost per sign-up only. Give cost per paying user.
Claims beyond the data. One quarter does not prove a trend.
Placeholders. Fill in every figure.
Doubt in the title. Remove question marks and jokes.
Diagnostic checklist
Each buyer and price named.
Channels per buyer with cost.
Free and paying users separated.
Sales team output shown, if relevant.
Results dated.
No placeholders.
Frequently asked questions
What should an edtech go-to-market slide show?
Who pays, which channels bring them and what each costs. DataCamp gives cost per registered user and per subscriber for six channels: $1.69 and $26.82 overall.
How do I show free users and paying users?
Separately, with a cost for each. DataCamp's paid ads cost $4.82 per registered user but $109.63 per subscriber, because only 4.4% subscribe.
Should I sell to individuals or institutions?
Many edtech startups do both, with different channels. eProf sells self-serve to tutors at $0 to $100 to win and through sales to enterprises at about $1,000 to win.
What sales figures matter for selling to schools or companies?
Demos per salesperson, conversion and revenue added. iMocha gives 8 qualified demos a month, 15% conversion and $40k of yearly revenue added per salesperson each month.
How we chose these examples
Corpus: published pitch deck teardowns on StartupFundraising.com. Founder-uploaded private decks are excluded.
Selection (2026-10-01): we searched extracted slide text for go-to-market, marketing, sales, channels, customer acquisition and distribution slides in decks from education companies. The search returned 29 slides, of which 25 were not used in other guides. We viewed 12 and kept 8 companies, using two slides from eProf; four were dropped for lack of figures or legibility.
Review: stored slide images were read on 2026-10-01 against company, deck and slide number; DataCamp, Careerist, iMocha and eProf were read at full size, the rest at low resolution (editorial model review). No person has yet completed an editorial review of this page. We did not verify any company's costs, partners or results.