MoneyBridge is a fiat-to-altcoin on-ramp that raised on a 15-slide seed deck dated March 2024, asking $5M to skip the swap step in buying long-tail tokens. The deck is structurally complete — problem, solution, model, traction, team, ask — and publishes its take rate, which most crypto decks hide. It falls apart on arithmetic: the market slide states both $86B and $150B as total daily crypto trading volume, and the five-year revenue bars total $116M under a headline SOM of $173M.
Key takeaways
- MoneyBridge's 2024 seed deck states the TAM as $86B in total daily crypto trading volume and, on the same slide, cites $150B as daily trading volume across all cryptocurrencies — a 74% contradiction visible without scrolling.
- The five revenue bars on slide 8 sum to $116.0M, while slide 7 calls the SOM a $173M five-year revenue projection — a $57M gap between two of the deck's own slides.
- The TAM/SAM/SOM funnel mixes units: two daily trading volumes narrowing into a five-year cumulative revenue figure, with no conversion shown.
- Token coverage changes four times across four slides: 5,000 in circulation, 4,000+ supported, '1000s' in a headline and 1000+ on a chart, with no live-versus-planned distinction.
- There is no competition slide in 15 slides, despite the problem slide measuring 'current on-ramp' providers at an average of 52 altcoins.
- The team slide names three finance executives with strong credentials and no engineer, while the traction slide claims a beta-launched product and an API that is 85% complete.
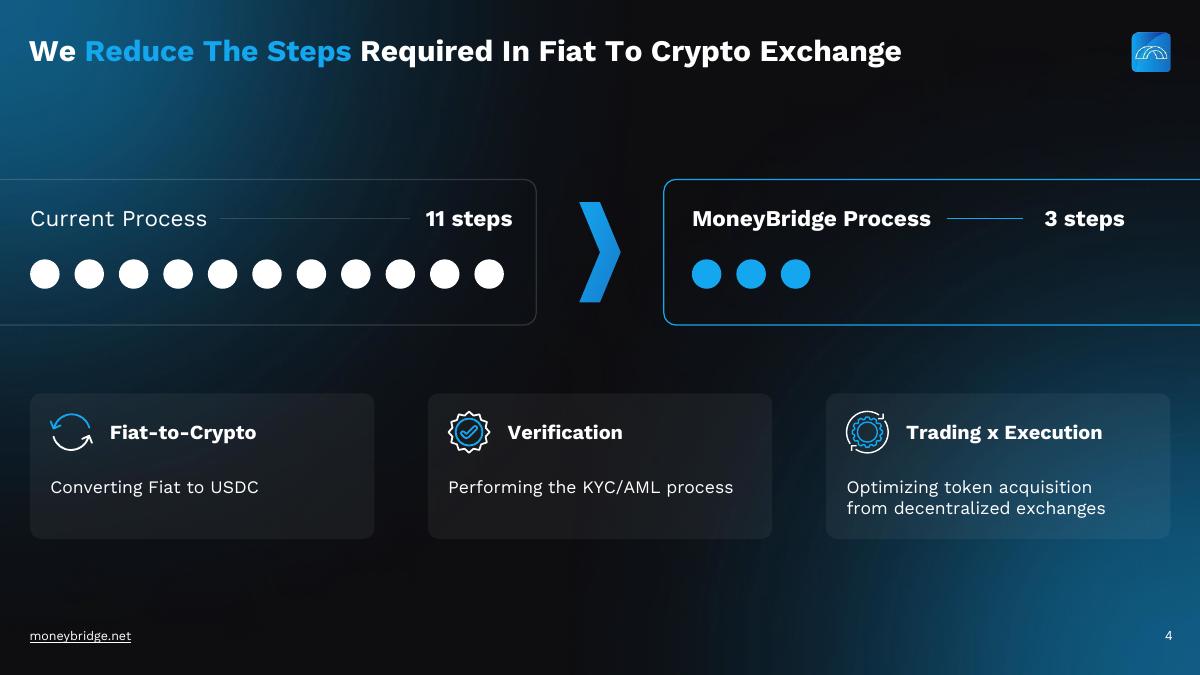
- The solution slide is the deck's best work: eleven steps versus three, with the three stages named — fiat to USDC, KYC/AML, DEX execution.
- The $5M use of funds puts 35% into marketing and 20% into development for a product that has not finished shipping, with no runway, milestones or valuation stated.
What this deck actually is
This is a 15-slide seed pitch deck for MoneyBridge, a fiat-to-altcoin on-ramp that wants to collapse the eleven-step process of buying a long-tail token into three steps. The file is a PowerPoint export dated 20 March 2024, in 960×540 widescreen format, with the internal document title still set to the PowerPoint default and an author name in the file metadata that appears nowhere on the team slide. That is a small detail, but it tells you the deck was produced by a designer outside the three-person founding team, which is normal and worth knowing before you read the polish as evidence of internal capability.
It is a real investor deck, not a company overview. Mission and vision, problem, solution, product, market, business model, competitive advantage, traction, roadmap, team, value proposition, ask, and contact — every canonical slide is present, in a sane order, with a real number on the ask slide: $5M seed. Very few decks we tear down get that far. MoneyBridge does the structural work most founders skip.
The problem is arithmetic. Three of the four number-bearing slides disagree with each other or with themselves, and the disagreements are large: a market slide that states two different figures for total daily crypto trading volume within one frame, a five-year revenue projection that adds up to $116M under a headline that says $173M, and a token count that shifts from 1,000+ to 4,000+ to 5,000 depending on which slide you are on. An investor who runs a calculator over this deck — and at seed stage in crypto, they will — finds the gaps in about four minutes.
Slide-by-slide walkthrough
Slide 1 — Title: "The Solution to Crypto Mass Adoption"
Company name, tagline, "Pitch Deck | March 2024", and the domain. The date on the title slide is correct practice and almost nobody does it; it tells a reader forwarding the file in June exactly how stale the numbers are.
The tagline is the weak part. "The Solution to Crypto Mass Adoption" is a category claim, not a company description. Nothing in those six words tells an investor that MoneyBridge sells fiat-to-altcoin on-ramping. The actual positioning line — "Skip the Swap!" — is buried on slide 2, and it is far better: three words, a specific mechanic, a real differentiator. That belongs on slide 1.
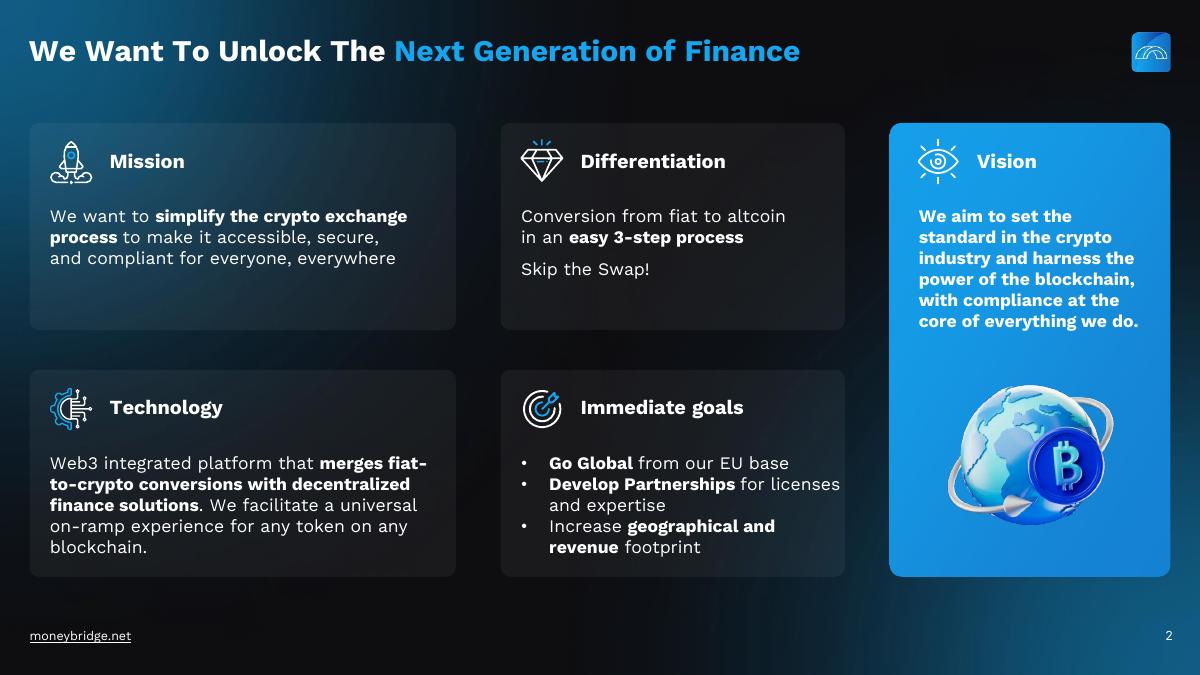
Slide 2 — Mission, differentiation, vision, technology, immediate goals
Five boxes on one slide. The mission box is clear: simplify crypto exchange to make it accessible, secure and compliant. The differentiation box carries the whole pitch: "Conversion from fiat to altcoin in an easy 3-step process. Skip the Swap!" The technology box explains the mechanism — a Web3 platform merging fiat-to-crypto conversion with DeFi execution, "a universal on-ramp experience for any token on any blockchain."
Immediate goals: go global from an EU base, develop partnerships for licences and expertise, increase geographic and revenue footprint. Note "from our EU base" — no city, no entity, no jurisdiction named. The contact slide gives a US phone number in the Dallas area code, and every team member's credentials are American. A crypto investor's first compliance question is which regulator you sit under, and this deck never answers it.
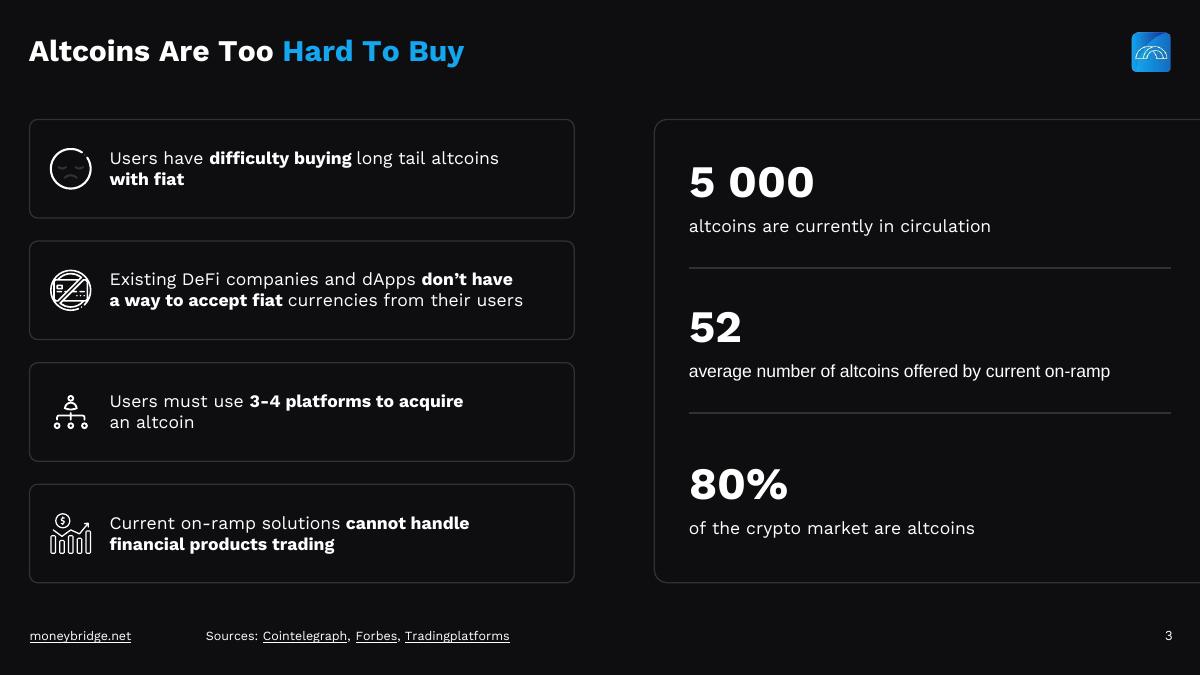
Slide 3 — Problem: "Altcoins Are Too Hard To Buy"
Four problem statements on the left, three statistics on the right: 5,000 altcoins in circulation, 52 as the average number of altcoins offered by a current on-ramp, and 80% of the crypto market being altcoins. The 5,000-versus-52 juxtaposition is the sharpest thing in the deck. It states the gap in two numbers and needs no explanation.
Sources are credited at the footer — Cointelegraph, Forbes, Tradingplatforms — which puts this deck ahead of the majority. What is missing is dates. In a market where the token count moves monthly, "5,000 altcoins" with no as-of date is an unverifiable claim, and the diligence associate checking it in July will find a different number and assume the deck is careless rather than merely undated.
Slide 4 — Solution: 11 steps versus 3 steps
The best slide in the deck. Current process: 11 steps. MoneyBridge process: 3 steps — fiat-to-crypto (fiat to USDC), verification (KYC/AML), trading and execution (optimising token acquisition from decentralised exchanges). One comparison, one number pair, three labelled stages that describe what actually happens under the hood.
It is also the slide with the largest unaddressed question. Steps one and three describe MoneyBridge routing a user's fiat into USDC and then executing a DEX trade on their behalf. Whether that makes MoneyBridge a broker, a money transmitter, or a non-custodial software provider is the single determinant of the licensing burden, the timeline, and the size of the round. The deck asserts "Non-Custodial" on the next slide and moves on.
Slide 5 — Product: eight capability tiles
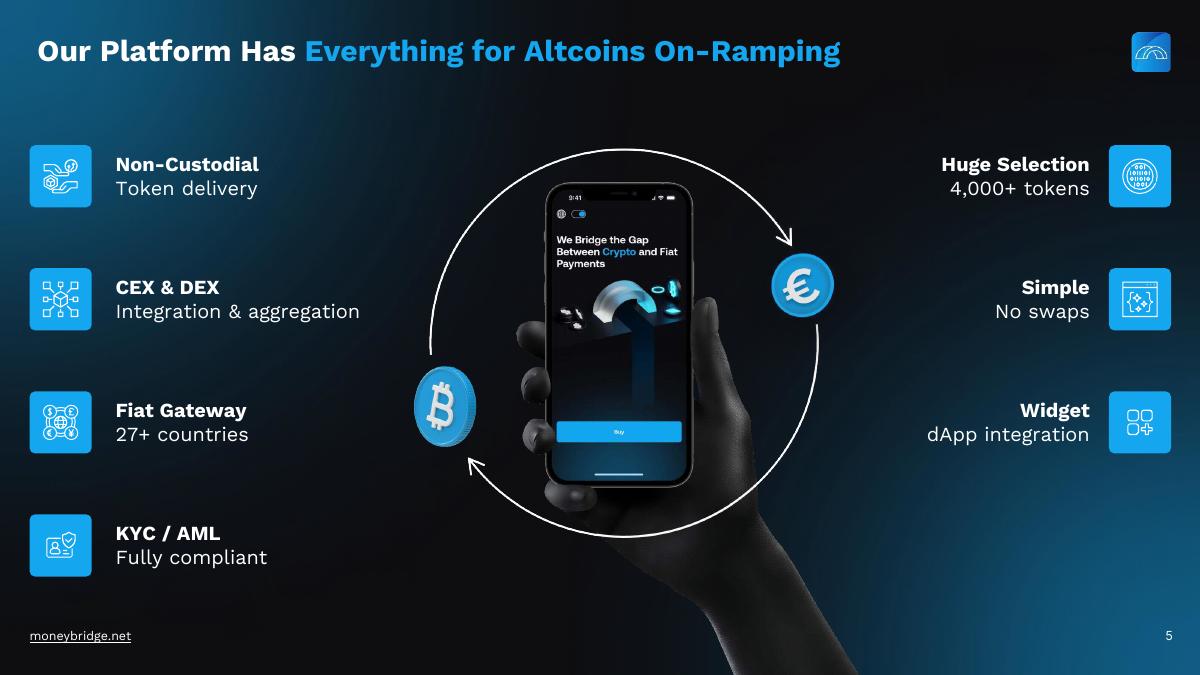
Non-custodial token delivery, 4,000+ tokens, CEX and DEX integration and aggregation, no swaps, fiat gateway in 27+ countries, dApp widget, KYC/AML compliant. The 27+ countries figure is specific enough to be checkable and is the most useful number here.
"4,000+ tokens" is the first arithmetic problem. Slide 3 says 5,000 altcoins exist. Slide 5 says the platform serves 4,000+ of them. Slide 6's chart tops out at "1000+". Slide 6's own headline says "1000s". These are four different claims about the same capability in four consecutive slides, and none of them is dated as current versus planned. If 4,000+ is the roadmap number and 1,000+ is live today, say so on both slides.
Slide 6 — Token coverage chart
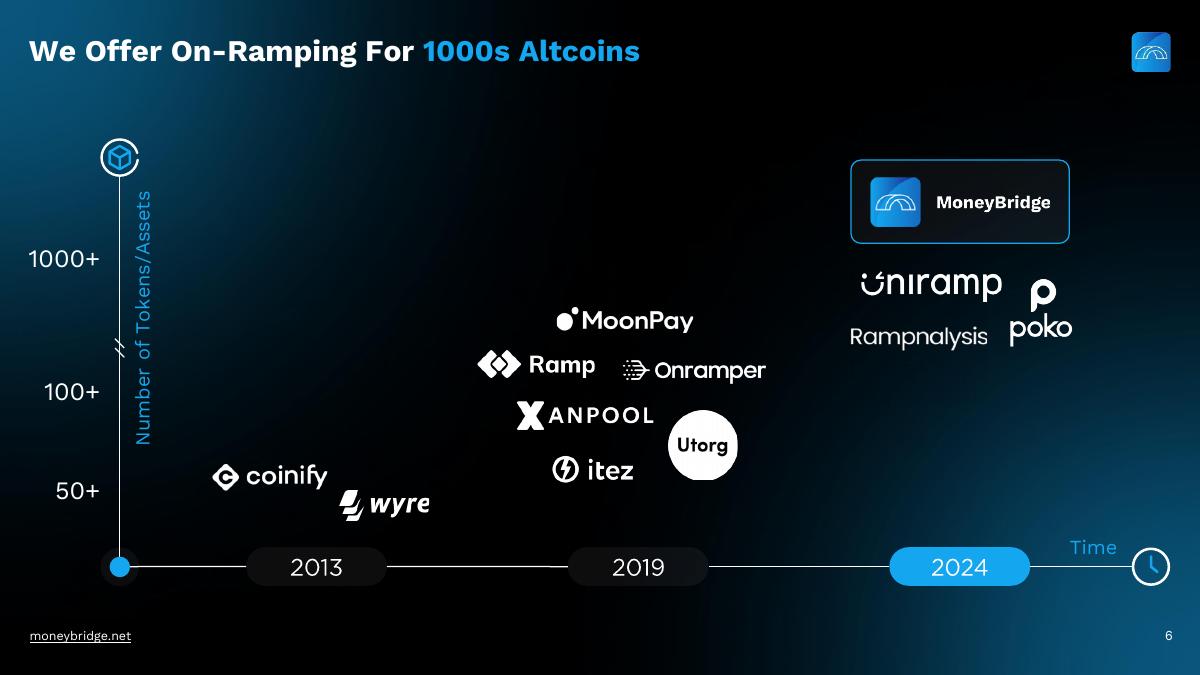
A line chart with tokens on the vertical axis and an unlabelled "Time" horizontal axis, stepping 50+ to 100+ to 1000+. There are no axis values, no dates, no indication of which point is today, and no competitor line to compare against. As drawn, it communicates "the number goes up" and nothing else.
This is a slide that costs a page and returns almost nothing. Either put dates on the axis and mark today's position, or fold the number into slide 5 and reclaim the page for the competition slide the deck does not have.
Slide 7 — Market: TAM, SAM, SOM plus "market insights"
The funnel: TAM is $86B "total daily trading volume", SAM is $13B "daily volume for target market", SOM is $173M "5Y revenue projection". Three tiers, three different units. Two are daily volumes and the third is a five-year cumulative revenue figure. You cannot draw a funnel from $86B daily to $173M over five years and call it a narrowing of the same quantity; the reader has to do a unit conversion the deck never shows.
Then the right-hand "market insights" column contradicts the left. TAM is stated as $86B total daily trading volume. Four inches to the right, an insight reads "$150B — daily trading volume across all cryptocurrencies." Both figures are on the same slide, both claim to measure total daily crypto trading volume, and they differ by 74%. Only one source is credited (livecoinwatch.com) and no date is given for either. This is the single most damaging item in the deck, because it is visible without leaving the slide.
The other two insights — a $30T expected increase in the long tail of crypto by 2030, and $2.3B as the highest valuation given to an on-ramp provider last cycle — are unsourced and, in the second case, unnamed. Naming the comparable (and its year) would do more work than the number alone.
Slide 8 — Business model and revenue projections
The fee structure is the clearest commercial statement in the deck: 3.5% on credit card, 1.5% on bank transfer, $4.99 minimum, network fees excluded. That is a real, verifiable price, and it sits inside the range charged by the incumbents this deck never names.
Then the bar chart: $1,229,359 in year one, $14,661,417, $25,221,499, $33,545,831, $41,345,393 in year five. Add them: $116,003,499. Slide 7 states the SOM as a "$173M 5Y revenue projection". The deck's own two revenue slides differ by $57M — the year-five figure is 49% short of covering the gap. One of the numbers was updated and the other was not, which is the most common failure mode in decks and the easiest for a diligence associate to find.
There is also no volume bridge. At a blended fee of roughly 2%, $41M of year-five revenue implies something around $2B of annual transaction volume, from a base of zero. The deck states the output and never the input, so a reader cannot judge whether the curve is aggressive or conservative. Show the volume assumption and the fee, and let the revenue fall out of it.
Slide 9 — Competitive advantage
Three claims: 1.5 years spent building a premier on-ramp, 50 years of collective expertise in institutional investing and compliance, and deep team insight into blockchain limitations. None of these is a competitive advantage. They are inputs. An advantage is something a competitor cannot copy this year: an exclusive banking partner, a licence in a hard jurisdiction, a routing algorithm with measurably better execution, a distribution deal with a dApp that has users.
Worse, the slide claims advantage without naming a single competitor. Ramp, MoonPay, Transak and Banxa exist, are funded, and are exactly the "current on-ramp" solutions slide 3 measures at 52 tokens. There is no competition slide anywhere in 15 slides. An investor in this category will assume you either do not know the landscape or are avoiding it.
Slide 10 — Traction
Four boxes: a beta waitlist of 16 businesses plus access to TDeFi portfolio companies; a beta-launched on-ramp with the Web3 widget and API 85% complete; backing from TDeFi Incubator and Lithium Ventures; and passed KYB and founders' KYC with EU-regulated, audited partner platforms.
The compliance box is genuinely strong and rare — most crypto seed decks assert compliance and show nothing. Naming the incubator and the VC is right. But "16 businesses on a waitlist" is demand-shaped, not demand: no signed pilots, no letters of intent, no transaction volume from the beta, no named logo. And "85% complete" is a founder's estimate with no date attached; the honest version is "widget in production with partner X, API in private beta since January."
Slide 11 — Roadmap to 2026
Eight workstreams across three years: API and widget, product enhancement, remittances and institutional transfers, ATM integrations, merchant services, expanded financial services including DeFi and cards, real-world assets, and AI for fraud detection and AML. For a company at 85% of one product with 16 waitlisted businesses, this is a roadmap for four companies.
Every additional line on this slide reduces confidence in the first one. Remittances, ATMs, merchant acquiring and RWAs are each separate licensing regimes and separate sales motions. Keeping them as a one-line "adjacencies we could grow into" and giving the whole page to the 2024–2025 on-ramp plan would make the round look far more fundable.
Slide 12 — Team
Three founders with specific, checkable credentials. The CEO led investment activity across $3B in assets, ranked as a top-30 healthcare CIO, CFA and MBA. The CFO managed hedge funds for a hospital system, does financial modelling and Python automation, CAIA and MBA from UT Austin. The COO managed a portfolio of 60 private market and venture funds and implemented KYC/AML policies for 50+ partnerships, with a finance degree from Missouri.
These are strong, credible finance operators — and that is the problem. There is no CTO, no engineering lead, no named builder anywhere in the deck, while slide 10 claims a beta-launched product and an API that is 85% complete. Someone wrote that code. If they are a co-founder, they belong on this slide; if they are an agency, the investor needs to know that before wiring $5M into a technical product. The omission is the biggest unforced error after the market arithmetic.
Slide 13 — Value for users and value for business
Two columns around the platform. User side: state-of-the-art security, easy to use with no crypto jargon, and "Pay However You Like — We accept major credit/debit cards and SEPA payments." Business side: easy to use with a Web2-style checkout, fraud prevention and compliance, and "Increase Your Revenue — We accept major credit/debit cards and SEPA payments."
The last bullet on each side is the same sentence. On the business side it sits under a heading about increasing the partner's revenue and says nothing about revenue — no revenue share, no conversion uplift, no basis-point split. This is a copy-paste that survived to the final export, and it lands on the slide a B2B partner would read most closely.
Slide 14 — The ask: $5M seed
$5M, allocated 35% marketing and sales, 30% operations, 20% development, 15% licences. The allocation adds to 100%, which is more than many decks manage, and the three round targets are stated: complete the Web3 API and widget, obtain licences to expand globally, grow the brand.
The split argues against the story. The largest line is marketing at $1.75M for a product with no paying customers and a widget that is not finished, while development — the thing that closes the last 15% and builds every 2025 roadmap item — gets $1M. Licences, described as necessary for global expansion, get $750K with no jurisdictions listed and no timeline. There is no runway length, no milestone the money buys, no valuation or instrument, and no current burn. "$5M for 24 months to reach $X of monthly volume across Y licensed markets" is the sentence this slide is missing.
Slide 15 — Close and contact
"Build Accessible Digital Economy with MoneyBridge", the CEO's direct email, a phone number, a "Book a call" action and the domain. Direct founder contact with a booking link on the closing slide is correct and underused. The phone's Dallas area code is also the first geographic signal in a deck that describes itself as EU-based, which an investor will notice.
What this deck does better than most startup pitch decks
It has a complete, correctly ordered structure. Problem, solution, product, market, model, traction, roadmap, team, ask, contact — nothing important is missing and nothing is buried in an appendix. The ask is on a main slide with a real number. · The solution slide is one comparison. Eleven steps versus three. No feature list, no architecture diagram, just the delta the company creates. · The price is published. 3.5% card, 1.5% bank transfer, $4.99 minimum, network fees excluded. Most crypto decks hide the take rate; publishing it invites the right argument. · The problem statistics are sourced. Cointelegraph, Forbes and Tradingplatforms are credited on the slide footer. Undated, but credited — which is more than most. · Compliance is treated as a feature, not a footnote. Passed KYB, founders' KYC, EU-regulated audited partners. In this category that is a differentiator, and the deck says so. · Named backers. TDeFi Incubator and Lithium Ventures are named, not implied. Named institutional support is checkable and therefore worth something. · The title slide is dated. March 2024, on slide 1. Decks circulate for months; a date protects the founder as much as the reader. · The close gives direct founder contact plus a booking link. The lowest-friction next step in the deck.
Where this deck would fail in an investor meeting
The market slide contradicts itself in one frame. $86B total daily trading volume as the TAM, $150B daily trading volume across all cryptocurrencies as a market insight, four inches apart. · The revenue projections do not add up to the stated SOM. The five bars total $116.0M; the market slide claims a $173M five-year revenue projection. A $57M gap between two of your own slides. · The TAM funnel mixes units. Two daily volume figures narrowing into a five-year cumulative revenue figure, with no conversion shown. · Token coverage changes four times. 5,000 in circulation, 4,000+ supported, "1000s" in a headline, 1000+ on the chart — with no live-versus-planned distinction. · There is no competition slide. Fifteen slides in a category with four well-funded incumbents, and not one is named. · No technical founder. A beta product and an 85%-complete API with three finance executives on the team slide and no engineer named anywhere. · Traction is a waitlist. Sixteen businesses, zero named, no signed pilots, no beta transaction volume, no revenue figure. · Jurisdiction is never stated. "Our EU base" with no entity, no country, no regulator — in a business whose entire risk is licensing. · Use of funds fights the story. 35% to marketing before the product ships; 20% to the development that finishes it. · No terms, no milestones, no runway. $5M with no valuation, no instrument, no stated period, and no target the money is supposed to hit. · A duplicated bullet on the B2B value slide. "Increase Your Revenue" explained with a sentence about accepted payment methods. · Slide 6 carries no information. An unlabelled axis and three step values.
Structure versus numbers: where MoneyBridge sits
Dimension MoneyBridge deck (March 2024) What a seed investor expects
Slide coverage All canonical slides present, correctly ordered Same — MoneyBridge passes
Ask visibility $5M on slide 14, with allocation Same — MoneyBridge passes
Internal consistency Three number conflicts across slides 3, 5, 6, 7 and 8 Every number reconciles across slides
Market sizing Two daily volumes and one 5Y revenue figure in one funnel One unit, bottom-up, with the conversion shown
Traction 16-company waitlist, 85%-complete API Live volume, named pilots, or revenue
Competition No slide, no competitor named Named incumbents and a defensibility claim
Team Three finance operators, no engineer Technical ownership visible for a technical product
Regulatory posture Compliance asserted; jurisdiction unnamed Entity, regulator and licence path stated
Round terms Amount and allocation only Amount, runway, milestones, instrument
How you would rebuild this deck in a weekend
Reconcile every number first, before touching design. Build one spreadsheet with token counts, volume figures and the revenue model, then make each slide read from it. Fix the $86B versus $150B conflict and make the SOM equal the sum of the projection bars — or relabel the SOM as annual year-five revenue if that is what $173M was meant to be. · Rebuild the market slide bottom-up. Target users × transactions per year × average ticket × blended take rate. One unit throughout. The result will be smaller than $86B and infinitely more persuasive. · Put "Skip the Swap" on slide 1. Replace the category claim with the mechanic: "Buy any of 4,000+ altcoins with a card, in three steps, no swaps." · Add a competition slide where slide 6 is. Rows for MoonPay, Ramp, Transak, Banxa; columns for token coverage, custody model, DEX execution, countries, fee. Slide 3 already implies this table exists — show it. · Put the builder on the team slide. Name the engineering lead or state plainly that the widget was built by a named agency and that the first hire from the round is a CTO. · Convert traction into evidence. Replace "16 businesses" with the beta's transacted volume to date, two named waitlist logos with permission, and a dated status for the widget and API rather than a percentage. · State the jurisdiction. Country of incorporation, the regulator, which licence is held versus applied for versus needed, and the expected date. This is the diligence question in this category, so answer it before it is asked. · Cut the roadmap to two lanes. On-ramp depth through 2025, one named adjacency for 2026. Move ATMs, RWAs and AI to a single "future adjacencies" line. · Rewrite use of funds around milestones. "$5M, 24 months, to $X monthly volume across Y licensed markets" — then flip the split so engineering and licensing lead and marketing follows the product. · Fix the duplicated bullet on slide 13 and replace it with the partner economics: what a dApp earns per transaction routed through MoneyBridge.
The transferable lesson
MoneyBridge's deck is a useful case because its failure is not one of structure or storytelling. The narrative is coherent, the mechanic is differentiated, the price is public, the compliance work is real, and the ask is on the page with a number. On the checklist most founders use to grade their own deck, this scores well.
It comes apart on internal consistency. A market figure that contradicts another figure on the same slide, and a revenue chart that sums to two-thirds of the number the previous slide promised, do more damage than a missing slide ever would. A missing competition slide is a gap; a self-contradiction is a signal about how the company handles numbers — and a fiat-to-crypto on-ramp is, in the end, a company that handles numbers.
The fix costs nothing but an afternoon with a spreadsheet. Read your own deck as an adversary would: total every chart, convert every unit, and check that any quantity appearing twice appears identically. If the two token counts, the two volume figures and the two revenue totals in your deck do not match, no amount of design will save the meeting.
Frequently asked questions
- What is MoneyBridge?
- MoneyBridge is a fiat-to-crypto on-ramp that lets users buy long-tail altcoins directly with a card or SEPA transfer, without the usual swap step. Its March 2024 seed deck describes a non-custodial Web3 platform that converts fiat to USDC, runs KYC/AML, then executes the token purchase on decentralised exchanges — collapsing an eleven-step process into three.
- Is the MoneyBridge deck a real investor pitch deck?
- Yes. The 15-slide PowerPoint export, dated 20 March 2024, is a seed investor deck with every canonical slide: mission, problem, solution, product, market sizing, business model, competitive advantage, traction, roadmap, team, value proposition, a $5M ask with allocation, and a contact close. Structurally it is more complete than most seed decks.
- How much money was MoneyBridge raising?
- $5M in a seed round, stated on slide 14 with an allocation of 35% marketing and sales, 30% operations, 20% development and 15% licences. The slide names three round targets — completing the Web3 API and widget, obtaining global licences, and building the brand — but gives no valuation, instrument, runway length or milestone the money is meant to reach.
- What is wrong with MoneyBridge's market slide?
- Two things. It states the TAM as $86B of total daily crypto trading volume while a market insight on the same slide cites $150B as daily trading volume across all cryptocurrencies — a 74% gap. And the funnel mixes units, narrowing from two daily volume figures to a $173M five-year revenue projection with no conversion shown.
- Which MoneyBridge slides should founders copy?
- Three. The solution slide reduces the whole pitch to one comparison — eleven steps versus three — with the three stages named. The business model slide publishes the actual take rate: 3.5% on card, 1.5% on bank transfer, $4.99 minimum, network fees excluded. And the closing slide gives a direct founder email plus a booking link rather than a generic contact form.
- What would fix the MoneyBridge deck fastest?
- An afternoon of reconciliation. Build one model, then make every slide read from it: pick a single total-volume figure, make the SOM equal the sum of the revenue bars, and state one token count with a live-versus-planned split. Then add a competition slide naming MoonPay, Ramp and Transak, put the engineering lead on the team slide, and state the EU jurisdiction and licence status.